Tight Gas Market Report Scope & Overview:
Get More Information on Tight Gas Market - Request Sample Report
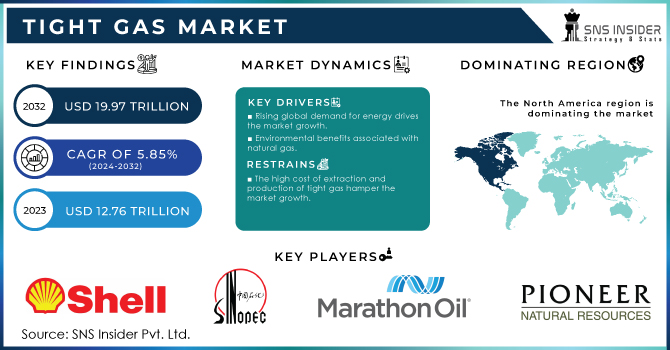
The Tight Gas Market Size was valued at USD 47.08 Billion in 2025 and is expected to reach USD 78.74 Billion by 2035 and grow at a CAGR of 5.31% over the forecast period 2026-2035.
The depletion of conventional gas reserves, coupled with the ever-increasing energy demand, has prompted a significant shift towards unconventional natural gas reserves, including tight gas, shale gas, and coal bed methane. Furthermore, the combustion of tight gas is considered cleaner compared to other fossil fuels like coal and petroleum products. This cleaner combustion is expected to have a positive impact in the years to come. Overall, the extraction and utilization of tight gas present a promising solution to meet the rising energy needs while minimizing environmental impact.
According to the Energy Information Administration reports that shale gas, a major component of tight gas, constituted about 75% of total U.S. natural gas production in recent years. This highlights the dominance of tight gas in the U.S. market.
The tight gas market is primarily driven by its lower extraction, processing, and commercialization costs, which are expected to significantly boost market growth. Furthermore, innovations in the extraction process, particularly hydraulic fracturing, are anticipated to further propel market expansion. Additionally, the increasing expenditure on the expansion of the oil and gas industry is poised to drive market growth. However, the presence of various harmful chemicals in the gas extraction process is expected to hinder market growth. Formaldehyde, asbestos, mercury, and hazardous/toxic air pollutants are among the harmful chemicals found in the extraction process. Moreover, the availability of alternative options like shale gas will also impact the market's growth trajectory.
EOG Resources launched a major expansion in the Barnett Shale, with a USD 1.6 billion investment to develop tight gas resources. The expansion includes the deployment of cutting-edge drilling technologies and the construction of new processing facilities.
Market Dynamics:
Drivers
Rising global demand for energy drives the market growth.
The increasing global demand for energy has led to a surge in the exploration and production of unconventional gas resources, including tight gas. This rising demand, coupled with advancements in drilling and extraction technologies, has created a favorable environment for the expansion of the tight gas market. As economies expand and urbanize, energy consumption increases, with natural gas being a preferred choice due to its relatively lower environmental impact compared to coal and oil.
The rising demand is also evident in the expansion of infrastructure to support natural gas distribution, such as new pipelines and LNG export terminals. For example, the expansion of the Sabine Pass LNG terminal in the U.S. has enabled increased exports to meet global demand. These trends underscore how the growing global appetite for energy, especially cleaner natural gas, propels the tight gas market forward.
Environmental benefits associated with natural gas.
The environmental benefits associated with natural gas, such as lower carbon emissions compared to other fossil fuels, have also contributed to the market's growth. As governments and organizations worldwide strive to reduce their carbon footprint, the demand for cleaner energy sources like natural gas continues to rise.
Restrain
The high cost of extraction and production of tight gas hamper the market growth.
One significant challenge is the high cost of extraction and production. Unlike conventional gas reserves, tight gas requires specialized drilling techniques, such as hydraulic fracturing, which can be expensive and complex. These costs can limit the profitability and viability of tight gas projects, especially in regions with limited infrastructure and access to markets.
Market segmentation
By Type
In the tight gas market, the processed tight gas segment leads due to its higher quality and broader applicability. Processed tight gas, which has undergone treatment to remove impurities and contaminants, is preferred by industries and utilities for its reliability and efficiency. This processing ensures the gas meets stringent standards for use in power generation, chemical manufacturing, and other industrial applications. For instance, the processing of tight gas improves its energy content and reduces potential operational issues related to impurities. The higher value and versatility of processed tight gas make it more attractive to end-users compared to unprocessed tight gas, which may contain higher levels of contaminants and require additional treatment before use. As a result, processed tight gas commands a larger share of the market due to its enhanced performance and compliance with regulatory requirements.
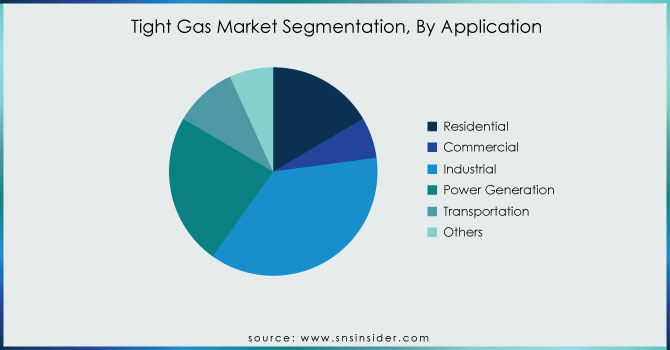
By Application
The industrial segment held the largest market share around 37% of the total volume in 2025. This growth is attributed to the increasing utilization of tight gas for various value-added outputs required in the industrial sector. For example, it is used as a feedstock for the manufacturing of fertilizers, chemicals, and other commodities. This trend has created numerous opportunities for countries rich in tight gas resources to enhance their industrial output in the coming years. Furthermore, the power generation segment is projected to experience the fastest growth in terms of volume over the forecast period. This is attributed to the global trend of transitioning from coal to gas in power plants. Tight gas combustion produces lower carbon emissions compared to other fossil fuels, making it an attractive option for several nations looking to reduce their environmental impact. As a result, the share of tight gas in the energy mix of these countries is expected to increase significantly.
Get Customized Report as per Your Business Requirement - Request For Customized Report
Regional Analysis:
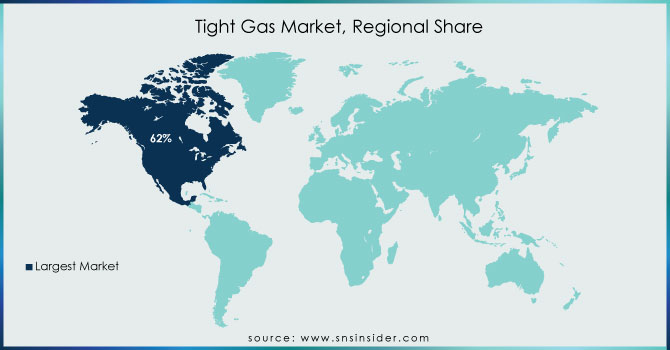
North America dominated the Tight Gas Market with the highest revenue share of about 62% in 2025. The region boasts vast reserves of tight gas, particularly in the United States and Canada. These abundant resources provide a solid foundation for North America's market dominance. Furthermore, the implementation of innovative drilling techniques, including horizontal drilling and multi-stage fracking, has significantly enhanced the efficiency and productivity of tight gas extraction. These technological advancements have allowed North American companies to tap into previously inaccessible reserves, thereby bolstering their revenue share. Another crucial factor contributing to North America's tight gas market dominance is its robust demand. The region's growing population, coupled with its heavy reliance on natural gas for power generation, industrial processes, and residential consumption, has created a consistent and substantial market for tight gas. The United States plays a significant role in driving revenue growth in this region, due to the deployment of advanced drilling technologies and the presence of abundant tight gas reserves in areas like the Permian Basin, Anadarko, Niobrara, and Bakken fields.
Asia Pacific is anticipated to grow with the highest CAGR in the tight gas market during the forecast period. Asia Pacific region boasts abundant reserves of tight gas, which has become an increasingly attractive energy source due to the depletion of conventional gas reserves. These vast reserves provide a solid foundation for the region's growth in the tight gas market. Moreover, the Asia Pacific region has witnessed a surge in energy demand, driven by rapid industrialization, urbanization, and population growth. As a result, there is a pressing need for alternative energy sources to meet this escalating demand. Tight gas, with its vast reserves and potential for extraction, has emerged as a viable solution to bridge the energy gap in the region. Additionally, advancements in drilling and extraction technologies have significantly improved the feasibility and cost-effectiveness of extracting tight gas. This has further incentivized companies to invest in the Asia Pacific region, driving market growth. China is the leading country in the Asia Pacific region. The country is focused on increasing domestic natural gas production and improving energy security in the region.
Key players:
Royal Dutch Shell, Sinopec, Marathon Oil, Pioneer Natural Resources, EOG Resources, British petroleum, Exxon Mobil and Chesapeake Energy Total SA, PetroChina, Anadarko Petroleum Co., Devon Energy, and other players.
Recent Development:
-
In 2024, ExxonMobil announced a USD 4 billion investment to expand its tight gas operations in the Permian Basin. This expansion includes the development of new drilling sites and the construction of additional infrastructure to increase production capacity and efficiency.
-
In Aug 2023, Sinopec Corp obtained certification for an additional 30.55 billion cubic meters of proven geological reserves in a deep natural gas reservoir located in the Bazhong gasfield of the Sichuan basin.
-
In November 2022, Marathon Oil Corporation announced its definitive purchase agreement to acquire the Eagle Ford assets of Ensign Natural Resources for a total cash consideration of $3.0 billion. The transaction is subject to customary terms and conditions, including closing adjustments, and is anticipated to be finalized by the end of 2022.
| Report Attributes | Details |
|---|---|
| Market Size in 2025 | US$ 47.08 Billion |
| Market Size by 2035 | US$ 78.74 Billion |
| CAGR | CAGR of 5.31% From 2026 to 2035 |
| Base Year | 2025 |
| Forecast Period | 2026-2035 |
| Historical Data | 2022-2024 |
| Report Scope & Coverage | Market Size, Segments Analysis, Competitive Landscape, Regional Analysis, DROC & SWOT Analysis, Forecast Outlook |
| Key Segments | • By Type (Processed Tight Gas, Unprocessed Tight Gas) • By Application (Residential, Commercial, Industrial, Power Generation, Transportation, Others) |
| Regional Analysis/Coverage | North America (US, Canada, Mexico), Europe (Eastern Europe [Poland, Romania, Hungary, Turkey, Rest of Eastern Europe] Western Europe] Germany, France, UK, Italy, Spain, Netherlands, Switzerland, Austria, Rest of Western Europe]), Asia Pacific (China, India, Japan, South Korea, Vietnam, Singapore, Australia, Rest of Asia Pacific), Middle East & Africa (Middle East [UAE, Egypt, Saudi Arabia, Qatar, Rest of Middle East], Africa [Nigeria, South Africa, Rest of Africa], Latin America (Brazil, Argentina, Colombia, Rest of Latin America) |
| Company Profiles | Royal Dutch Shell, Sinopec, Marathon Oil, Pioneer Natural Resources, EOG Resources, British petroleum, Exxon Mobil and Chesapeake Energy Total SA, PetroChina and Anadarko Petroleum Co., Devon Energy, and other players. |
Frequently Asked Questions
Ans: The Tight Gas Market Size was valued at USD 12.76 trillion cubic feet in 2023 and is expected to reach USD 19.97 trillion cubic feet by 2032 and grow at a CAGR of 5.85% over the forecast period 2024-2032.
Ans: Strict policies to protect the environment, Prolonged stages of government evaluation and Licence issuance are the restraints for Tight Gas Market.
Ans: Following the emergence of COVID-19, the tight gas demand has dramatically decreased. Due to the lockdown, there has been a shortage in the number of labourers, significantly hampering gas output. Furthermore, imposing lockdown has a direct impact on transportation services all over the world. Due to the scarcity of tight gas, power generation has become a big challenge. This has resulted in an upsurge in power outages in rural areas. Furthermore, the tight gas industry is experiencing daily losses as output declines. Furthermore, the implementation of lockdown has had an impact on the global import and export of tight gas.
Ans: The North American area had the biggest market share of 62 percent, and this is expected to continue in the future years.
Ans: Manufacturers, Consultant, aftermarket players, association, Research institute, private and universities libraries, suppliers and distributors of the product.
Get in Touch
