UV Stabilizers Market Report Scope & Overview:
Get more information on UV Stabilizers Market - Request Sample Report
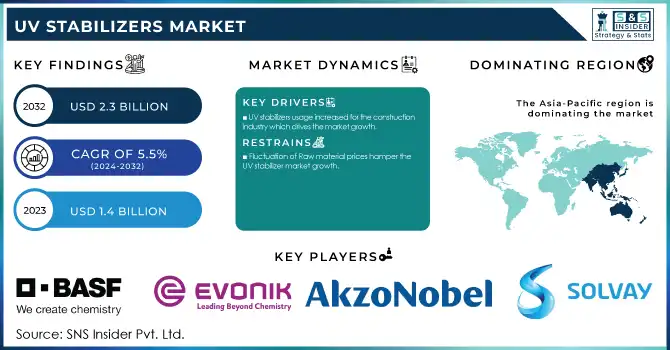
The UV Stabilizers Market Size was USD 1.4 billion in 2023 and is expected to reach USD 2.3 billion by 2032 and grow at a CAGR of 5.5% over the forecast period of 2024-2032.
The growth of the UV stabilizers market is mainly driven by the growing demand for durable polymers. High affinity toward lightweight, cost-effective, and versatility, polymers are used in the automotive, construction, packaging, and consumer products industries extensively. On the other hand, long-term exposure to ultraviolet (UV) radiation may cause deterioration, including fading, cracking, and reduced mechanical properties. UV stabilizers are an essential part of minimizing these effects by contributing defense of the polymers from damaging UV radiation to increase durability and lifespan. This is especially important in outdoor use cases like roofing, siding, and automotive exteriors where materials are under near-constant environmental duress. This demand will be further amplified by global sustainability and resource efficiency trends, with long-lasting polymers decreasing the need for frequent replacements, and supporting green practices. This is especially visible in emergent economies, where infrastructure, industry, and development are growing, requiring durable materials to achieve economic and environmental objectives.
In 2022, BASF expanded its production capacity for its hindered amine light stabilizers (HALS). This expansion with facilities in Italy and Germany, was aimed at meeting the rising demand for high-performance stabilizers used in automotive, packaging, and construction applications.
UV Stabilizers market demand is rising due to the increased usage in packaged industry. As the usage of consumer goods, food & beverage packaging, and e-commerce saw an upswing without a moment to waste, the requirement for packaging products that hold product safety and aesthetics became paramount. Particularly, UV stabilizers materials provide resistance from permanent and irreversible damage from a material such as discoloration, and brittleness through UV radiation throughout packaging materials. This is especially crucial for food and beverage packaging, where shelf life and aesthetics play pivotal roles in product perception and quality.
UV Stabilizers Market Dynamics
Drivers
-
UV stabilizers usage increased for the construction industry which drives the market growth.
Increasing adoption of UV stabilizers in the construction sector is a major driving factor for market growth. Some example exposures in the construction sector would be roofing membranes, window films, sealants, and coatings that are exposed to continuous outdoor environments of long durations and sunlight and UV radiation throughout their service life. Over time, in the absence of proper UV protection, the material can deteriorate, discolor and its structural integrity can also degrade. UV stabilizers are essential for protecting construction materials against UV damage, helping prolong their life, and preserving their aesthetics and functionality. The world construction industry continues to grow, specifically in infrastructure and residential buildings, making the need for UV-stable materials more apparent. As a result, UV stabilizers are now more integrated into construction coatings and materials to ensure they endure environmental stressors while upholding aesthetic and performance requirements. The increasing demand for effective and eco-friendly UV stabilizer formulations is prompting original equipment manufacturers to develop UV stabilizer solutions Pioneers this trend driving the market growth in this segment. The focus on sustainable and energy-efficient greenbuilding materials is also projected to activate the sustained demand for UV stabilizers in the construction industry.
Restraint
-
Fluctuation of Raw material prices hamper the UV stabilizer market growth.
The UV stabilizer market faces a major challenge in the form of fluctuations in raw material prices. Key raw materials used to manufacture the UV stabilizers including hindered amine light stabilizers (HALS), benzotriazole derivatives and other specialty chemicals are susceptible to price fluctuations due to supply chain disruptions, geopolitical tensions, and changes in demand from non-coating sectors. A rise in raw material costs will lead to a rise in production costs for manufacturers of UV stabilizers, thus raising end-product prices. Higher prices may restrict the affordability and accessibility of UV stabilizers which are widely utilized in various industries such as construction, automotive, and packaging. In addition, price volatility is compounded by dependence on some key raw materials, which may be concentrated in particular parts of the world. Geopolitical instability or changes to environmental regulations in key supplier countries may hit the supply of critical chemicals, raising material costs and causing production delays.
Opportunity
-
Agricultural landscape is witnessing a silent revolution driven by UV stabilizers.
UV Stabilizers Market Segmentation Analysis
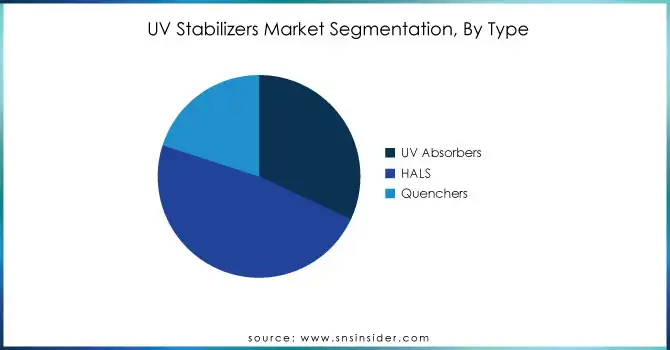
By Type
Hindered Amine Light Stabilizers (HALS) held the largest market share around 48% in 2023. This is due to their effectiveness and versatility, hindered amine light stabilizers (HALS) possess the highest market share of the UV stabilizer market. HALS is recommended for high performance as it allows isolation and disappears when absorbing UV which causes irreversible damage to the polymer by stabilizing the material against sunlight. Such properties make them perfect for use in industries like construction, automotive, and packaging, where UV is a major mechanism by which materials degrade. These are the compelling factors making them an attractive option in multiple applications, due to their efficiency in improving material durability and longevity, particularly with plastics, coatings, and fibers.
By Application
The packaging sub-segment dominated in UV stabilizer use in 2023 by application, that shield light-sensitive products like food, medicine, and cosmetics from sun damage during storage and transport. This protection is crucial to prevent discoloration, fading, and degradation, ensuring product quality and safety. Manufacturers need to deliver undamaged goods, consumers expect fresh-looking products, regulations mandate protection for certain items, and advancements in UV stabilizer formulations offer better effectiveness and compatibility with various packaging materials. As the focus on extending shelf life and minimizing waste grows, the UV stabilizer market in packaging is expected to keep flourishing.
UV Stabilizers Market Regional Overview
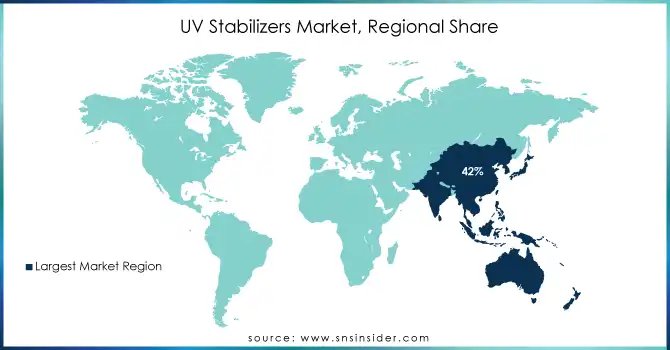
Asia Pacific held the largest market share around 42% in 2023. Asia Pacific accounted for the largest market share in the UV stabilizers market as it plays a crucial in prominent sectors like construction, automotive, and packaging. This, coupled with the swift industrialization, large-scale production capacity and rising urbanization in economies such as China, India and Japan, is helping the regional sector. With the expansion of infrastructure and consumer markets in these countries, there have also been rising need for UV-stabilized goods, especially construction materials and coatings that need protection from UV exposure and other environmental factors.
Furthermore, there is a growing rate of penetration in automotive in the Asia Pacific with China and India globally leading in the production of automobiles thus driving demand for UV stabilizers in automotive industries parts and coatings. Meanwhile, sustainable packaging is gaining momentum in the region, wherein UV stabilizers are extensively used to increase the life of packaging materials exposed to sunlight. The region's leading position is also aided by the proactive policies of governments and infrastructure and manufacturing investments. Industry reports suggest that the UV Stabilizer market will be driven further by the increasing demand for materials protected by UV and with the expansion of various industries needless.
Get Customized Report as per your Business Requirement - Request For Customized Report
Key Players
-
BASF SE (Tinuvin 1130, Tinuvin 292)
-
Solvay S.A. (Rovene 860, Additive 282)
-
Evonik Industries AG (Tegomer, Tego Stabilizer)
-
SABO S.p.A. (SaboStab UV 1, SaboStab UV 40)
-
Songwon Industrial Co., Ltd. (Songlight 200, Songlight 9020)
-
Unitechem Group (UVA 1700, UVA 108)
-
Everlight Chemical Industrial Corporation (Everlight 9000, Everlight 800)
-
Suqian Unitech Corp Ltd. (Unitech UV-1, Unitech UV-5)
-
Lycus Ltd., LLC (Lycus UV-2150, Lycus UV-1234)
-
Jiangsu Chemk Co., Ltd. (CHEMK) (CHEMK UV-9, CHEMK UV-5)
-
Clariant (Hostavin N30, Hostavin B900)
-
China National Petroleum Corporation (CNPC) (UV 531, UV 1130)
-
AkzoNobel (Intersun, Anox 20)
-
AddiSystems (Addisorb, Addistab)
-
Eastman Chemical Company (Eastman UV stabilizer, Eastman UV-S 300)
-
Chemtura Corporation (Light Stabilizer 5050, Light Stabilizer 944)
-
Sumitomo Chemical (Sumilizer, SUMILIZER F)
-
Lanxess (Lanxess Lupro- UV, Lanxess Uvinul)
-
Kraton Polymers (Kraton UV-1, Kraton UV-2)
-
Mitsui Chemicals (Mitsui UV-120, Mitsui UV-2100)
Recent Development:
-
In May 2024: Syensqo launched their innovative Ajedium™ PPSU slot liner films at CWIEME Berlin, a global exhibition for the electrical manufacturing industry. Find them at Booth 42F27 from May 14th to 16th, 2024.
-
In March 2023: SONGWON is showcasing its game-changing solutions at the fair: SONGNOX 9228, an antioxidant that extends product life, and SONGSORB 1164, a UV absorber that provides superior protection. These innovative products are perfect for applications in packaging, agriculture, building & construction, and even home & personal care.
| Report Attributes | Details |
|---|---|
| Market Size in 2023 | US$ 1.4 Billion |
| Market Size by 2032 | US$ 2.3 Billion |
| CAGR | CAGR of 5.5% From 2024 to 2032 |
| Base Year | 2023 |
| Forecast Period | 2024-2032 |
| Historical Data | 2020-2022 |
| Report Scope & Coverage | Market Size, Segments Analysis, Competitive Landscape, Regional Analysis, DROC & SWOT Analysis, Forecast Outlook |
| Key Segments | • By Type (HALS, UV Absorbers, Quenchers) • By Application (Automotive, Packaging, Agriculture Films, Building & Construction, Adhesives & Sealants, Others) |
| Regional Analysis/Coverage | North America (US, Canada, Mexico), Europe (Eastern Europe [Poland, Romania, Hungary, Turkey, Rest of Eastern Europe] Western Europe [Germany, France, UK, Italy, Spain, Netherlands, Switzerland, Austria, Rest of Western Europe]), Asia Pacific (China, India, Japan, South Korea, Vietnam, Singapore, Australia, Rest of Asia Pacific), Middle East & Africa (Middle East [UAE, Egypt, Saudi Arabia, Qatar, Rest of Middle East], Africa [Nigeria, South Africa, Rest of Africa], Latin America (Brazil, Argentina, Colombia, Rest of Latin America) |
| Company Profiles | BASF SE (Germany), Solvay S.A. (Belgium), Evonik Industries AG (Germany), SABO S.p.A. (Italy), SONGWON INDUSTRIAL CO. LTD., (South Korea), Unitechem Group (China), Everlight Chemical Industrial Corporation (Taiwan), Suqian Unitech Corp Ltd. (China), Lycus Ltd., LLC (U.S.), Jiangsu Chemk Co.,Ltd. (CHEMK) (China) |
| Drivers | • UV stabilizers usage increased for the construction industry which drives the market growth. |
| Restraints | • Fluctuation of Raw material prices hamper the UV stabilizer market growth. |
Get in Touch
