Green Building Materials Market Report Scope & Overview:
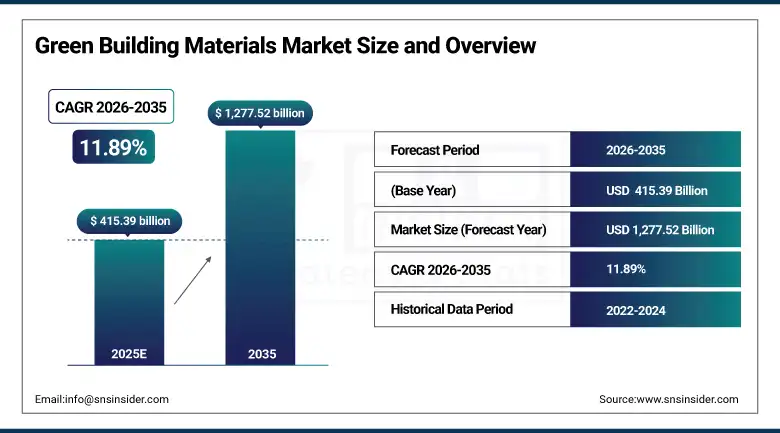
The Green Building Materials Market size was estimated at USD 415.39 billion in 2025 and is expected to reach USD 1,277.52 billion by 2035, growing at a CAGR of 11.89% over the forecast period of 2026-2035.
The global green building materials market trend is a growing demand for sustainable construction solutions such as low-carbon insulation systems, energy-efficient building envelopes, and recycled-content structural materials as the growth of the market is driven by increasing green building certification activity, government-mandated building energy codes, and developer preference for materials that reduce lifecycle carbon emissions in residential and non-residential construction. This trend is also driven by a growing adoption of net-zero building targets and the growing focus on embodied carbon reduction in construction supply chains as developers and contractors become more focused on meeting ESG commitments and are more willing to invest in certified green product procurement, resulting in growth in the domestic and international market for interior and exterior green building material solutions.
For instance, in March 2024, rising green building certification activity and tightening municipal energy codes drove a 24% increase in green building material procurement contracts for commercial construction projects in North America, boosting sustainable insulation and low-carbon exterior product adoption across new developments.
Green Building Materials Market Size and Forecast:
-
Market Size in 2025: USD 415.39 billion
-
Market Size by 2035: USD 1,277.52 billion
-
CAGR: 11.89% from 2026 to 2035
-
Base Year: 2025
-
Forecast Period: 2026–2035
-
Historical Data: 2022–2024
To Get more information On Green Building Materials Market - Request Free Sample Report
Green Building Materials Market Trends
-
Green building material solutions are being adopted because developers demand construction products that meet LEED, BREEAM, and ENERGY STAR certification requirements while reducing project operational energy costs.
-
Increased use of recycled-content materials, reclaimed wood framing systems, and low-VOC interior finishing products to reduce embodied carbon and improve indoor air quality in residential and commercial buildings.
-
The development of bio-based insulation materials, phase-change thermal storage panels, and smart building envelope systems to improve energy performance benchmarks and reduce HVAC load requirements across building types.
-
Integrated solar roofing products, building-integrated photovoltaics (BIPV), and solar thermal wall systems are being deployed to generate on-site renewable energy and reduce grid dependency in new construction projects.
-
Increased demand for prefabricated green building systems, modular construction components, and factory-certified sustainable framing assemblies to reduce on-site construction waste and shorten project delivery timelines.
-
Collaboration between material manufacturers, green certification bodies, and construction project developers to advance standardized environmental product declarations (EPDs) and improve supply chain transparency for sustainable material sourcing.
-
U.S. Green Building Council, EPA, and Department of Energy promoting standards for building energy efficiency, embodied carbon reporting, whole-building lifecycle assessment requirements, and material health transparency disclosures.
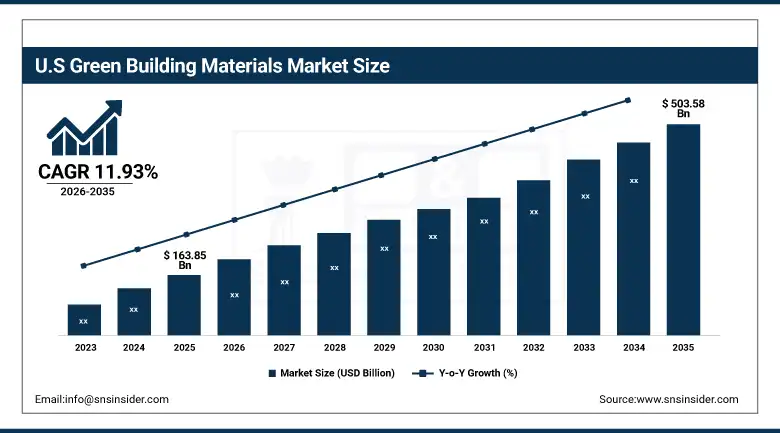
The U.S. Green Building Materials Market was estimated at USD 163.85 billion in 2025 and is expected to reach USD 503.58 billion by 2035, growing at a CAGR of 11.93% from 2026-2035. The United States represents the largest market for green building materials, primarily driven by the widespread LEED certification adoption, federal and state-level building energy code mandates, and well-established green construction supply chain infrastructure across residential and commercial building segments. Government tax incentive programs, moderately high levels of institutional investor ESG compliance requirements, and increased developer and general contractor spending on certified sustainable materials help to drive growth in the market. Also, the U.S. is the largest regional market in the world, due to the regulatory support and swift adoption of energy-efficient building envelope and solar product solutions.
Green Building Materials Market Growth Drivers:
-
Stringent Building Energy Codes and Green Certification Mandates are Driving the Green Building Materials Market Growth
Stringent building energy codes and green certification mandates take the center stage as a growth driver for the green building materials market share, and are driven by the implementation of IECC energy code updates, LEED v4.1 material credit requirements, and EPA indoor air quality standards for reduced occupant health impact and lower building operational carbon footprints. These solutions for sustainable construction compliance and developer ESG alignment are driving the base of the market, the penetration of interior and exterior green product segments, and adding to the overall market share globally.
Green Building Materials Market Restraints:
-
Higher Upfront Material Costs and Limited Contractor Awareness are Hampering the Green Building Materials Market Growth
Higher upfront material costs and limited contractor awareness also restrict the green building materials market growth, as a large number of small-to-mid-size residential builders and commercial contractors who have access to green product specifications remain hesitant or face difficulties justifying the cost premium of certified sustainable materials within fixed project budgets. This might lead to specification substitution with conventional materials, delayed project green certification timelines, and reduced return on sustainability investment for property developers. As a result, green material adoption remains uneven, and market growth is stunted in regions where contractor green building education programs and material cost subsidy frameworks remain underdeveloped.
Green Building Materials Market Opportunities:
-
Net-Zero Building Programs and Government Infrastructure Investment Drive Future Growth Opportunities for the Green Building Materials Market
The opportunity in the net-zero building programs and government infrastructure investment in green building materials market is in the form of large-scale public building retrofit contracts, federally funded school and hospital decarbonization programs, and municipal net-zero new construction mandates. These solutions provide for embodied carbon reduction in public infrastructure, improved energy performance in institutional building portfolios, and lower long-term facility operating cost burdens for government property managers. Through enhanced material specification compliance, green product supply chain expansion, and contractor workforce development programs, particularly in regions with active net-zero building code transition timelines, these programs may improve building stock energy performance, decrease construction sector carbon output, and expand the market.
Green Building Materials Market Segment Analysis
-
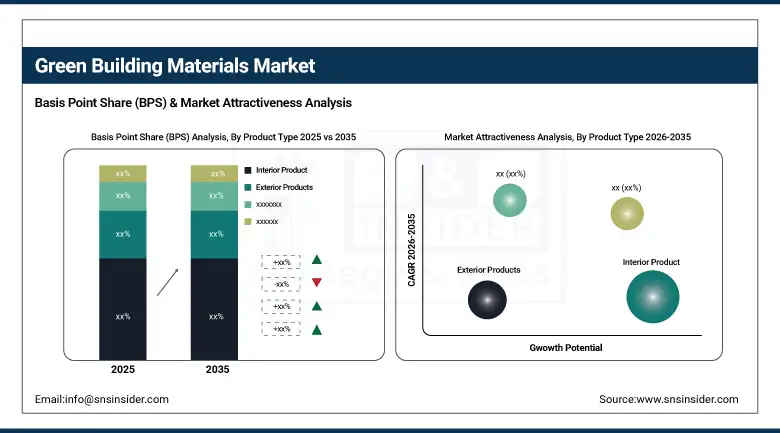
By product type, interior products held the largest share of around 34.62% in 2025, and the solar products segment is expected to register the highest growth with a CAGR of 13.47%.
-
By application, insulation dominated the market with approximately 28.74% share in 2025, while the roofing segment is expected to register the highest growth with a CAGR of 12.83%.
-
By end user, non-residential buildings accounted for the leading share of nearly 57.36% in 2025, and the residential buildings segment is expected to register the highest growth with a CAGR of 12.61%.
By Product Type, Interior Products Lead the Market, While Solar Products Register Fastest Growth
The interior products segment accounted for the highest revenue share of approximately 34.62% in 2025, owing to broad adoption of low-VOC paints and coatings, recycled-content flooring systems, and sustainable ceiling and partition materials across commercial office, healthcare, and educational building fit-out programs globally. Emerging trends, including increasing green building certification credit requirements for interior material health transparency and growing occupant wellness standards, are sustaining interior product demand across institutional construction programs. In comparison, the solar products segment is anticipated to achieve the highest CAGR of nearly 13.47% during the 2026–2035 period, driven by the increasing deployment of building-integrated photovoltaics, falling solar module cost curves, and growing OEM interest in solar roofing and solar façade product integration for net-zero building compliance. Drivers include rising utility rate pressures, expanding federal and state solar investment tax credit programs, and developer preference for on-site renewable energy generation as a net-zero specification tool.
By Application, Insulation Dominates, while Roofing Segment Registers Fastest Growth
By 2025, the insulation segment contributed the largest revenue share of 28.74% due to its direct impact on building operational energy performance, strong mandates for minimum thermal resistance values in residential and commercial building energy codes, and established supply chains for mineral wool, spray foam, and bio-based insulation products across North America, Europe, and Asia Pacific. Growing adoption of continuous exterior insulation systems and growing awareness among contractors of insulation’s contribution to LEED energy credit points are making developers increasingly aware of insulation’s value in meeting green certification targets. The roofing segment is projected to grow at the highest CAGR of about 12.83% between 2026 and 2035 due to the growing demand for cool roof systems, green roof assemblies, and solar-integrated roofing products in high heat-island urban environments. Some of the reasons include tightening municipal stormwater management requirements, better energy performance ratings for reflective roofing materials, and building owner preference for durable, low-maintenance sustainable roofing solutions.
By End User, Non-Residential Buildings Lead, and Residential Buildings Register Fastest Growth
The non-residential buildings segment accounted for the largest share of the green building materials market with about 57.36%, owing to mandatory green certification requirements for commercial office, healthcare, and government building construction programs, institutional investor ESG compliance obligations, and higher per-square-foot material specification budgets in commercial construction compared to residential projects. Reasons driving the non-residential segment include increasing corporate sustainability reporting requirements and growing tenant demand for green-certified office and retail space across major urban markets. In addition, the residential buildings segment is slated to grow at the fastest rate with a CAGR of around 12.61% throughout the forecast period of 2026–2035, as homebuilders, multifamily developers, and individual homeowners seek certified green insulation, solar roofing, and energy-efficient building envelope products to meet tightening residential energy code requirements and reduce long-term utility costs. Increased focus on healthy home indoor air quality standards and rising consumer awareness of green product health benefits contribute to adoption, while expanding green mortgage financing programs drive continued residential market investment.
Green Building Materials Market Regional Highlights:
Asia Pacific Green Building Materials Market Insights:
Asia Pacific is the fastest-growing region in the green building materials market with a CAGR of 13.72%, as the awareness about sustainable construction practices, government-backed green building rating system adoption, and building materials industry modernization across China, India, Japan, and Southeast Asia is growing. Factors including China’s Three-Star Green Building Standard rollout, India’s Green Rating for Integrated Habitat Assessment (GRIHA) program expansion, and Japan’s CASBEE certification requirement for public buildings are stimulating the market growth. Government-supported urban development programs and net-zero city planning initiatives have been instrumental in improving green material specification rates, especially in high-density metropolitan construction corridors. Public-private infrastructure investment programs and national carbon neutrality commitments also help in advancing green building material procurement and construction sector decarbonization. Increase in demand in Asia Pacific owing to rising construction sector activity against historical building start levels and growing affordability and accessibility of domestically produced green building product alternatives.
North America Green Building Materials Market Insights:
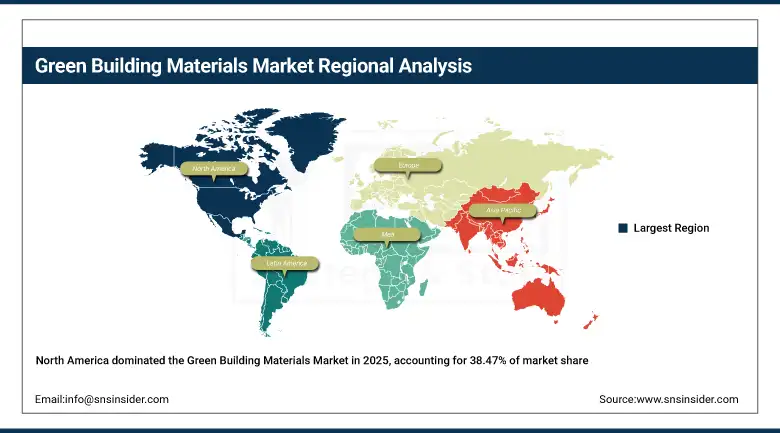
North America held the largest revenue share of over 38.47% in 2025 of the green building materials market due to an established green building certification ecosystem, stringent state and municipal building energy code requirements, and increased developer and institutional investor awareness regarding the financial and ESG advantages of certified sustainable construction. Drivers include widespread LEED and ENERGY STAR program participation, an improved domestic green product manufacturing base, growing homebuyer preference for energy-efficient new residential construction, and greater commercial tenant acceptance of green-certified office space premiums. At the same time, various federal Inflation Reduction Act incentive programs, expanded EPA indoor environment quality standards, and substantial construction industry investment in green material specification and product development are anchoring green building material product revenues in the market, and ensuring multibillion dollar demand across residential, commercial, and institutional construction sectors.
Get Customized Report as per Your Business Requirement - Enquiry Now
Europe Green Building Materials Market Insights:
The green building materials market in Europe is the second-dominating region after North America on account of the EU Taxonomy Regulation establishing green building product sustainability criteria, BREEAM certification program adoption across commercial real estate portfolios, and increasing net-zero building renovation commitments under the EU Energy Performance of Buildings Directive (EPBD) recast. Rising implementation of national renovation wave programs in Germany, France, and the Netherlands, advanced embodied carbon reporting requirements under French RE2020 building regulations, favorable EU cohesion fund support for building decarbonization investments, and cross-border green material procurement harmonization are also contributing to the sustained growth of the market in leading European construction economies.
Latin America (LATAM) and Middle East & Africa (MEA) Green Building Materials Market Insights:
In Latin America, and Middle East & Africa, the growing sustainable construction awareness and increase in green building certification activity with expanding urban development investment support the green building materials market growth. The rising popularity of affordable energy-efficient insulation and cool roofing solutions, along with government green city development programs and climate resilience building mandates, will aid sustainable material accessibility and green building adoption. The increasing urban construction activity and improving green product import and local manufacturing infrastructure in these regions are continuing to encourage market growth.
Green Building Materials Market Competitive Landscape:
Saint-Gobain S.A. (est. 1665) is a leading sustainable building materials manufacturer that focuses on high-performance insulation systems, energy-efficient glazing products, and low-carbon interior and exterior building solutions for green-certified residential and non-residential construction projects. It uses its global manufacturing network and green product certification portfolio to produce industry-leading thermal and acoustic performance materials, with strong commitment to achieving carbon neutrality across its product manufacturing operations by 2050.
-
In February 2025, launched its next-generation ISOVER bio-based glass wool insulation line with a 35% reduced embodied carbon profile and full EPD certification, targeting LEED v4.1 and BREEAM Outstanding rated commercial and residential building specifications across North American and European markets.
Kingspan Group plc (est. 1965) is a well-known global high-performance insulation and building envelope manufacturer focused on continuous insulation panels, solar-integrated façade systems, and net-zero building envelope solutions for commercial and industrial construction. It invests in low-carbon insulated panel manufacturing and building-integrated solar product development with the hopes of revolutionizing the commercial building envelope with factory-certified, energy-performance-guaranteed sustainable building product systems for developers targeting net-zero certification.
-
In October 2024, expanded its QuadCore insulated panel product range with a new ultra-low embodied carbon formulation achieving LEED Material & Resources credits compliance, targeting large-scale logistics, data center, and commercial office building projects across North America and Asia Pacific.
Owens Corning (est. 1938) is a leading North American building insulation, roofing, and composite materials manufacturer in the fields of residential and commercial thermal performance products, sustainable roofing systems, and glass fiber composite building solutions. The company’s green building material product portfolio focuses on ENERGY STAR-rated insulation and cool roofing products, and features a strong commitment to Science Based Targets initiative (SBTi) carbon reduction compliance and continuous product innovation to complement its established market presence in residential new construction and retrofit building segments.
-
In June 2024, introduced its EcoTouch PINK FIBERGLAS insulation line upgrade with improved recycled glass content of 53% and enhanced thermal performance ratings for residential wall and attic applications, strengthening green product credentials and expanding specification adoption among U.S. homebuilders targeting ENERGY STAR and DOE Zero Energy Ready Home certifications.
Green Building Materials Market Key Players:
-
Saint-Gobain S.A.
-
Kingspan Group plc
-
Owens Corning
-
BASF SE
-
Armstrong World Industries
-
Rockwool International A/S
-
Johns Manville (Berkshire Hathaway)
-
Knauf Insulation GmbH
-
Interface, Inc.
-
Forbo Holding AG
-
USG Corporation (Knauf)
-
LafargeHolcim Ltd. (Holcim Group)
-
GAF Materials LLC
-
CertainTeed LLC (Saint-Gobain)
-
Ecological Building Systems
-
Nucor Corporation
-
Trex Company, Inc.
-
Fiberon LLC (Fortune Brands)
-
SolarCity Corporation (Tesla Energy)
-
GreenMan Technologies, Inc.
| Report Attributes | Details |
|---|---|
| Market Size in 2025 | USD 415.39 Billion |
| Market Size by 2035 | USD 1,277.52 Billion |
| CAGR | CAGR of 11.89% From 2026 to 2035 |
| Base Year | 2025 |
| Forecast Period | 2026-2035 |
| Historical Data | 2022-2024 |
| Report Scope & Coverage | Market Size, Segments Analysis, Competitive Landscape, Regional Analysis, DROC & SWOT Analysis, Forecast Outlook |
| Key Segments | • By Product Type (Interior Product, Exterior Products, Solar Products, Building Systems, Other) • By Application (Roofing, Framing, Insulation, Exterior Sliding, Interior Finishing) • By End User (Residential Buildings, Non-Residential Buildings) |
| Regional Analysis/Coverage |
North America (US, Canada), Europe (Germany, UK, France, Italy, Spain, Russia, Poland, Rest of Europe), Asia Pacific (China, India, Japan, South Korea, Australia, ASEAN Countries, Rest of Asia Pacific), Middle East & Africa (UAE, Saudi Arabia, Qatar, South Africa, Rest of Middle East & Africa), Latin America (Brazil, Argentina, Mexico, Colombia, Rest of Latin America) |
| Company Profiles | Saint-Gobain S.A., Kingspan Group plc, Owens Corning, BASF SE, Armstrong World Industries, Rockwool International A/S, Johns Manville (Berkshire Hathaway), Knauf Insulation GmbH, Interface, Inc., Forbo Holding AG, USG Corporation (Knauf), LafargeHolcim Ltd. (Holcim Group), GAF Materials LLC, CertainTeed LLC (Saint-Gobain), Ecological Building Systems, Nucor Corporation, Trex Company, Inc., Fiberon LLC (Fortune Brands), SolarCity Corporation (Tesla Energy), GreenMan Technologies, Inc., and Others |
Frequently Asked Questions
Ans: The Green Building Materials Market is expected to grow at a CAGR of 11.89% during 2026-2035.
Ans: The Green Building Materials Market was USD 415.39 billion in 2025 and is expected to Reach USD 1,277.52 billion by 2035.
Ans. The green building material market is growing rapidly as environmental awareness and sustainability concerns drive the demand for eco-friendly solutions, energy efficiency, and regulatory compliance in construction.
Ans: The “Roofing” segment dominated the Green Building Materials Market.
Ans: North America dominated the Green Building Materials Market in 2025.
Get in Touch
