Virtual Event Platform Market Key Insights:
To Get More Information on Virtual Event Platform Market - Request Sample Report
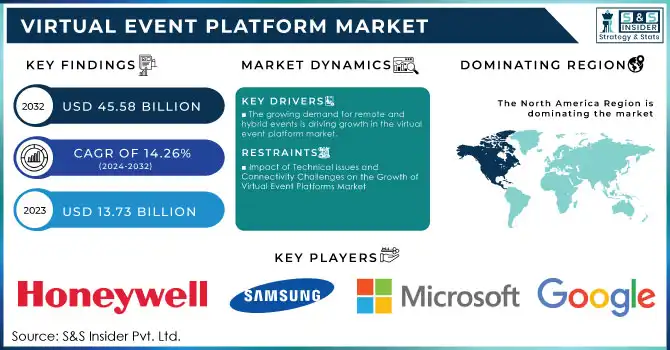
The Virtual Event Platform Market size was USD 13.73 Billion in 2023 and is expected to reach USD 45.58 Billion by 2032 with a growing CAGR of 14.26% over the forecast period of 2024-2032.
The virtual event platform market has witnessed remarkable growth, particularly following the pandemic, as businesses increasingly embrace digital transformation. These platforms have proven to be a cost-effective alternative to traditional in-person gatherings, eliminating the need for travel, venue bookings, and accommodations. Virtual events offer global accessibility, allowing participants from different regions to join without the logistical hurdles of physical events, thus expanding reach and enhancing convenience. The market's growth is driven by several key factors, including the growing adoption of digital media marketing, the rise in corporate events, and the significant advancements in digital technologies. According to the International Telecommunication Union 75% of the global population has access to mobile broadband, with nearly 90% of the world covered by a mobile broadband network, illustrating the widespread media penetration that is fueling the market. This digital connectivity facilitates the expansion of virtual platforms that enable hosting virtual conferences, webinars, expos, trade shows, and other events. Additionally, as companies and institutions shift toward hybrid and fully virtual events, demand for interactive features—such as real-time chats, virtual networking, and content sharing—has surged. The market is expected to continue its robust growth, driven by ongoing investments in digital technologies and an increasing preference for virtual and hybrid platforms that offer engaging, interactive user experiences. These platforms are now an integral part of corporate strategies for reaching global audiences while maintaining cost-efficiency and accessibility.
Market Dynamics
Drivers
- The growing demand for remote and hybrid events is driving growth in the virtual event platform market.
A major driver of the virtual event platform market is the rising demand for remote and hybrid events. As businesses, educational institutions, and entertainment sectors shift toward flexible work and learning models, virtual platforms have become crucial for hosting conferences, seminars, trade shows, and social gatherings. The ability to attend events from any location, combined with features like real-time interaction, networking opportunities, and enhanced accessibility, has accelerated the adoption of virtual event solutions. Technological advancements have further enriched user experiences, making virtual events more engaging and interactive. In 2023, users spent over 1.3 trillion minutes watching content on Twitch, reflecting the increasing demand for live, interactive experiences. The platform allows creators to broadcast live or pre-recorded videos, fostering real-time engagement with audiences through chat and building communities centered around shared interests like gaming and entertainment. This shift towards real-time interaction aligns with the broader virtual event platform market. As demand for live, social experiences grows, virtual platforms offering these features are becoming essential for creators and businesses. With the ability to monetize through ads, subscriptions, and donations, the virtual event market is poised for continued growth, driven by the increasing popularity of digital and hybrid events.
Restraints
- Impact of Technical Issues and Connectivity Challenges on the Growth of Virtual Event Platforms Market
These platforms rely heavily on stable, high-speed internet connections and advanced technological infrastructure to ensure smooth operation. Disruptions in these areas can severely affect the overall experience, leading to dissatisfaction among both organizers and attendees. One of the most common challenges is poor internet connectivity, particularly in regions with unstable or low-bandwidth internet. This can result in video lag, dropped audio, and difficulty accessing key features such as live streaming, chats, or networking rooms, which diminishes attendee engagement. Organizers also face difficulties managing sessions and real-time interactions if their internet connections are unreliable. Technical glitches, such as platform crashes or software malfunctions, can disrupt live sessions or keynote presentations, which are vital for real-time engagement. These problems can cause delays or disconnects, affecting the event’s success, especially in larger virtual gatherings. Platform overloads and unanticipated software bugs can lead to significant downtime or restrict access users. With increasing, demand for virtual and hybrid events across industries, technical challenges can tarnish the reputation of event organizers and platforms. Thus, investing in reliable infrastructure and technical support is critical to the sustained growth and success of virtual event platforms.
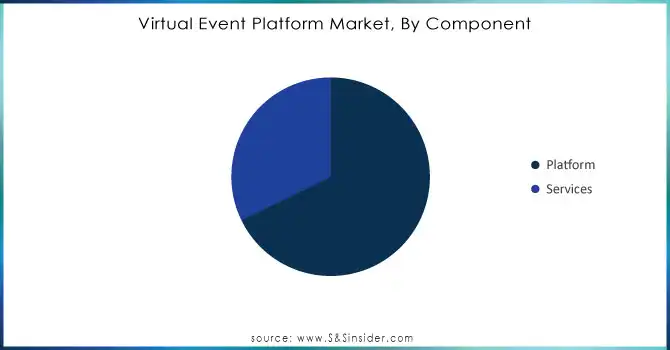
By Component
In 2023, the Platform segment leads the Virtual Event Platform Market, accounting for approximately 68% of the total revenue. This dominance is driven by the increasing need for platforms to host various virtual events like conferences, trade shows, and webinars, which offer essential features such as video streaming, interactive tools, and content management. The demand for seamless user experiences, reliable performance, and scalability has propelled the growth of this segment. Additionally, the shift towards hybrid and remote work environments has increased reliance on virtual platforms that offer live streaming, networking, and breakout rooms. Technological advancements, such as AI and machine learning, have further enhanced engagement, driving innovation. Companies like Hopin, vFairs, and Bizzabo are actively enhancing their platforms with features like AI-driven matchmaking and advanced analytics. With growing demand for hybrid events, the Platform segment is set to maintain its dominance through 2032, positioning itself as a key driver in the virtual event market’s growth.
Do You Need any Customization Research on Virtual Event Platform Market - Inquire Now
By Organization Size
In 2023, the Large Enterprises segment captured around 56% of the Virtual Event Platform Market, driven by the need for these organizations to host large-scale events such as conferences, trade shows, product launches, and webinars. These enterprises require virtual event platforms that can accommodate thousands of attendees, offer seamless streaming, and provide interactive features like real-time Q&A, networking, and engagement. The key drivers behind this dominance include the demand for scalability and customization, with platforms that can support complex event formats and branding requirements. Integration with existing enterprise systems, such as CRM and ERP, is also crucial for streamlining operations and improving data collection. Additionally, the growing trend of hosting virtual and hybrid events allows large organizations to reach global audiences, cutting travel costs and expanding their reach. As the demand for digital and hybrid events increases, large enterprises will continue to dominate the market, with virtual event platforms offering advanced features and scalability to meet their needs.
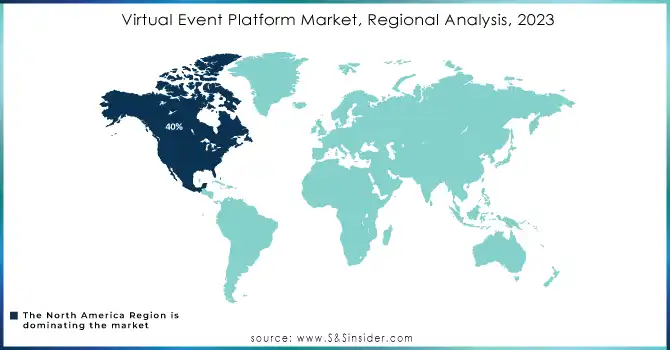
Regional Analysis
In 2023, North America dominated the Virtual Event Platform Market, capturing around 40% of total revenue. This dominance is driven by the region's advanced technological infrastructure, high adoption of virtual and hybrid events, and the presence of major tech companies. Industries such as technology, healthcare, education, and business services in North America heavily rely on virtual event platforms to engage large audiences. The region’s superior internet connectivity ensures seamless event experiences with minimal disruptions. Additionally, the widespread shift toward hybrid and remote work models has accelerated the demand for scalable, robust platforms that support diverse events, including conferences, product launches, and expos. Key developments in the market include enhanced AI-driven features, interactive networking tools, and advanced analytics to optimize attendee engagement and event success. As demand for hybrid solutions grows, North America is poised to maintain its leadership in the virtual event platform market, with ongoing innovation and improved user experiences driving future growth.
In 2023, Asia-Pacific emerged as the fastest-growing region in the Virtual Event Platform Market, driven by rapid digital transformation, increased internet penetration, high mobile device usage, and the adoption of cloud technologies. Countries like India, China, Japan, and South Korea are at the forefront of this growth, as businesses shift to virtual and hybrid events to engage broad, geographically dispersed audiences. The corporate, education, and entertainment sectors are key drivers, using virtual platforms for conferences, webinars, trade shows, and cultural events. China, a major market, is witnessing significant virtual event adoption, particularly in the tech and manufacturing sectors, while India’s growing IT industry and youthful population further contribute to the region's expansion. The shift to remote work and digital education in Japan and South Korea is fueling demand for scalable event solutions. With the integration of AI and interactive tools, Asia-Pacific is becoming a hub of innovation and growth in the virtual event platform market.
Key Players
Some of the major players in Virtual Event platform with their product:
-
Amazon – (Alexa, Echo smart speakers, Ring security cameras)
-
Apple Inc. – (HomeKit platform, Apple TV, HomePod)
-
Google – (Google Nest Thermostat, Nest Doorbell, Nest Hub)
-
Samsung Electronics – (SmartThings Hub, Family Hub Refrigerator, Galaxy Home)
-
Honeywell International Inc. – (Smart Thermostats, Home Security Systems)
-
Huawei Technologies – (Huawei Watch Fit, AI Cube Router, IoT platform)
-
Schneider Electric – (Wiser Energy System, KNX smart home automation)
-
LG Electronics – (ThinQ AI platform, Smart refrigerators, washing machines)
-
Philips Lighting (Signify) – (Philips Hue Smart Lighting System)
-
Johnson Controls – (GLAS Smart Thermostat, Building Automation Systems)
-
Siemens AG – (Desigo CC Building Management System, Synco IC)
-
ADT Inc. – (ADT Command & Control, Blue by ADT)
-
Assa Abloy – (Yale Smart Locks, August Doorbell Camera)
-
Sony Corporation – (BRAVIA Smart TVs, Life Space UX Projectors)
-
Ecobee – (Ecobee Smart Thermostat with Voice Control)
-
Bosch – (Bosch Smart Home Controller, Security Cameras)
-
Lutron Electronics – (Caseta Wireless Lighting Control, RA2 Select)
-
Vivint Smart Home – (Vivint Doorbell Camera, Smart Locks)
-
Xiaomi – (Mi Home Security Camera, Mi Smart Speaker)
-
Marvin Windows and Doors – (Marvin Connected Home Skylights, Voice-activated Windows)
List of potential companies across various industries that could be customers for virtual event platforms:
1. Corporate Sector
-
Microsoft: For hosting global meetings, webinars, and product launches.
-
Google: For virtual developer conferences, training sessions, and webinars.
-
IBM: For virtual corporate events, conferences, and webinars.
-
Salesforce: For customer-facing events, user conferences, and training sessions.
-
Accenture: For internal training, client meetings, and virtual consulting events.
-
Deloitte: For hosting virtual webinars, business meetings, and team-building events.
2. Education and Training
-
Harvard University: For hosting online lectures, webinars, and academic conferences.
-
MIT (Massachusetts Institute of Technology): For virtual workshops, online courses, and seminars.
-
Coursera: For e-learning webinars, online courses, and virtual graduation ceremonies.
-
Khan Academy: For hosting interactive educational webinars and online learning sessions.
-
LinkedIn Learning: For virtual training sessions, workshops, and certification events.
-
Pluralsight: For online training, virtual tech summits, and industry-specific webinars.
3. Government and Public Sector
-
The United Nations: For virtual summits, global conferences, and public outreach programs.
-
U.S. Department of State: For hosting virtual international relations conferences and town halls.
-
European Union: For online policy discussions, public forums, and political summits.
-
National Institutes of Health (NIH): For virtual research conferences, webinars, and workshops.
-
U.S. Centers for Disease Control and Prevention (CDC): For public health webinars, training sessions, and awareness campaigns.
4. Healthcare and Pharmaceuticals
-
Pfizer: For virtual product launches, healthcare webinars, and medical conferences.
-
Johnson & Johnson: For medical device and pharmaceutical webinars and virtual trade shows.
-
Mayo Clinic: For medical education events, virtual training, and healthcare webinars.
-
Merck: For virtual conferences, product presentations, and physician meetings.
-
Novartis: For hosting global healthcare events, medical research webinars, and industry training.
-
Roche: For virtual medical conferences, webinars, and virtual patient engagement events.
5. Entertainment and Media
-
Eventbrite: For hosting virtual events, conferences, and ticketed events.
-
Live Nation: For streaming live concerts, virtual festivals, and fan meetups.
-
Warner Bros. Entertainment: For virtual premieres, fan engagement events, and movie screenings.
-
Sony Music: For live virtual concerts, fan engagement, and artist interactions.
-
Netflix: For virtual premiere events, press releases, and interactive fan sessions.
-
Disney: For virtual movie releases, fan conventions, and global premieres.
6. Retail and E-Commerce
-
Amazon: For product launches, virtual shopping experiences, and e-commerce webinars.
-
Walmart: For virtual product showcases, promotions, and vendor meetings.
-
Nike: For virtual fashion shows, exclusive product releases, and influencer events.
-
Adidas: For virtual product launches, influencer events, and interactive shopping experiences.
-
L'Oréal: For virtual product launches, beauty seminars, and online influencer collaborations.
-
Zara: For virtual fashion shows and customer engagement events.
7. Tech and Software Industry
-
Apple: For virtual product announcements, developer events, and training sessions.
-
Facebook (Meta): For hosting virtual events, conferences, and training sessions.
-
Amazon Web Services (AWS): For webinars, cloud training, and developer conferences.
-
SAP: For virtual product demonstrations, user conferences, and enterprise webinars.
-
Oracle: For virtual conferences, product demos, and customer-facing events.
-
Slack: For virtual collaboration events, webinars, and user engagement sessions.
8. Professional Associations
-
American Bar Association (ABA): For hosting legal seminars, webinars, and conferences.
-
IEEE (Institute of Electrical and Electronics Engineers): For virtual conferences, workshops, and technical events.
-
American Marketing Association (AMA): For hosting digital marketing webinars, online conferences, and workshops.
-
National Association of Realtors (NAR): For virtual trade shows, real estate webinars, and industry seminars.
-
National Retail Federation (NRF): For virtual expos, webinars, and industry-specific events.
9. Finance and Insurance
-
JPMorgan Chase: For virtual investor conferences, product demonstrations, and global financial forums.
-
Goldman Sachs: For virtual investor and client meetings, financial conferences, and webinars.
-
AIG: For virtual insurance seminars, customer webinars, and product launches.
-
MetLife: For digital customer engagement, insurance product demos, and financial planning webinars.
-
Citi: For virtual financial services expos, investor relations events, and training sessions.
Recent Developments
-
In June 2024, Amazon rebranded its telehealth service by folding Amazon Clinic into Amazon One Medical. The revamped platform now offers pay-per-visit telehealth for over 30 common conditions, with messaging visits priced at USD 29 and video consultations at USD 49. This shift consolidates Amazon's health services under one umbrella, streamlining access for consumers
-
April 22, 2024, Huawei has intensified its efforts to expand its HarmonyOS ecosystem by porting over major apps like WeChat and Douyin. The company is targeting one million apps in the ecosystem and plans to invest USD 1 billion in developer initiatives. Despite geopolitical challenges, HarmonyOS now holds 4% of the global market share and 16% in China.
| Report Attributes | Details |
|---|---|
| Market Size in 2023 | USD 13.73 Billion |
| Market Size by 2032 | USD 45.58 Billion |
| CAGR | CAGR of 14.26 % From 2024 to 2032 |
| Base Year | 2023 |
| Forecast Period | 2024-2032 |
| Historical Data | 2020-2022 |
| Report Scope & Coverage | Market Size, Segments Analysis, Competitive Landscape, Regional Analysis, DROC & SWOT Analysis, Forecast Outlook |
| Key Segments | • By Component (Platform, Services {Training and Consulting, Support and Maintenance, Deployment and Integration}) • By Organization Size (Large enterprises, Medium-sized enterprises, Small enterprises) • By End-user (Non-Profit, Government, Education, Healthcare and Lifesciences, Third-Party Planner, Associations, Corporations) |
| Regional Analysis/Coverage | North America (US, Canada, Mexico), Europe (Eastern Europe [Poland, Romania, Hungary, Turkey, Rest of Eastern Europe] Western Europe] Germany, France, UK, Italy, Spain, Netherlands, Switzerland, Austria, Rest of Western Europe]), Asia Pacific (China, India, Japan, South Korea, Vietnam, Singapore, Australia, Rest of Asia Pacific), Middle East & Africa (Middle East [UAE, Egypt, Saudi Arabia, Qatar, Rest of Middle East], Africa [Nigeria, South Africa, Rest of Africa], Latin America (Brazil, Argentina, Colombia, Rest of Latin America) |
| Company Profiles | Amazon, Apple Inc., Google, Samsung Electronics, Honeywell International Inc., Huawei Technologies, Schneider Electric, LG Electronics, Philips Lighting (Signify), Johnson Controls, Siemens AG, ADT Inc., Assa Abloy, Sony Corporation, Ecobee, Bosch, Lutron Electronics, Vivint Smart Home, Xiaomi, Marvin Windows and Doors |
| Key Drivers | • The growing demand for remote and hybrid events is driving growth in the virtual event platform market. |
| Restraints | • Impact of Technical Issues and Connectivity Challenges on the Growth of Virtual Event Platforms |
Frequently Asked Questions
Ans. The virtual event platform market is driven by increasing demand for remote and hybrid events, technological advancements, cost efficiency, and the need for global audience engagement.
Ans. Upcoming trends in the Virtual Event Platform Market include the integration of AI and machine learning, enhanced interactivity, hybrid event formats, and advanced data analytics for personalized experiences.
Ans. The Virtual Event Platform Market size is estimated to reach USD 45.58 Billion by 2032.
Ans. The Virtual Event Platform Market is growing at a CAGR of 14.26% From 2024 to 2032.
Get in Touch
