3D CAD Software Market Report Scope & Overview:
Get More Information on 3D CAD Software Market - Request Sample Report
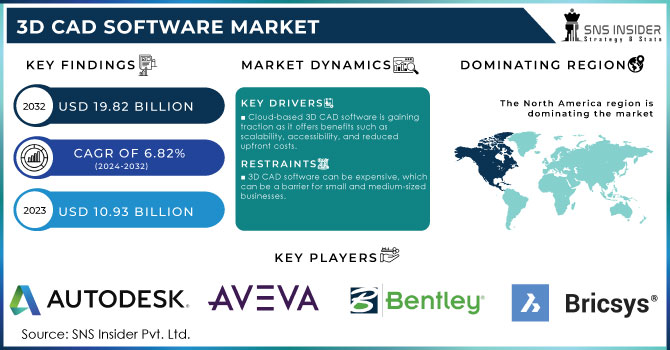
The 3D CAD Software Market size was valued at USD 10.93 billion in 2023 and is expected to reach USD 19.82 billion by 2032 and grow at a CAGR of 6.82% over the forecast period 2024-2032.
The growth of the 3D CAD software market is driven by the various industries that increasingly depend on digital technologies to enhance operations and product development. Essential in sectors such as manufacturing, construction, and engineering, 3D CAD is widely used by professionals to create and edit models of various structures. Factors such as the manufacturing industry's expansion, infrastructure development, and the rise of advanced technologies such as 3D printing and virtual reality are driving demand.
The shift to remote work and cloud-based solutions, along with the integration of AI and machine learning, is also driving market growth. The growing automation and 3D printing further boost the need for CAD software. The digital thread concept, connecting physical and digital realms, improves efficiency by reducing errors and Enhancing collaboration across product development stages. For Instance, Birdon Group adopted Siemens' Xcelerator portfolio to enhance its digital shipyard operations, demonstrating the benefits of integrating digital thread technology.
The growth of the construction and architecture industries has fueled the 3D CAD software market. The demand for precise design tools has surged due to the increasing complexity of projects, such as smart cities and sustainable buildings. Architects and engineers rely on 3D CAD for detailed modeling and efficient project execution, driving market growth. Additionally, trends like Building Information Modeling (BIM) integration and cloud-based solutions further accelerate the adoption of 3D CAD software.
Market Dynamics
Drivers
-
Ongoing advancements in software capabilities, such as cloud-based CAD, AI integration, and real-time collaboration
-
Rising need for customization in product design and development
-
Expansion of engineering services and increasing demand for outsourcing design services
-
Rising integration of 3D CAD software with other engineering tools, such as CAM and CAE
The increasing integration of 3D CAD software with other engineering tools such as computer-aided manufacturing (CAM) and computer-aided engineering (CAE) is a major driver for its growth. This integration improves the product development process in several ways. It eliminates the need for cumbersome data export and conversion between these tools. a designer might create a model in 3D CAD and then need to export it for use in CAM or CAE, potentially requiring conversion. The data can be transferred directly, reducing the risk of errors, and saving time. This integration improves efficiency by allowing engineers to work faster. With seamless data flow, they can iterate on designs more quickly, leading to a faster product development cycle. It fosters better collaboration between design, manufacturing, and engineering teams. Everyone can access and work with the latest version of the model in their respective tool, ensuring everyone is on the same page. The reduced data manipulation minimizes the chance of errors creeping in during development, ultimately leading to higher-quality products.
Restraints
-
The high cost of acquiring and implementing 3D CAD software can be a barrier, particularly for small and medium-sized enterprises (SMEs)
-
The risk of data breaches and intellectual property theft associated with cloud-based CAD solutions
Opportunities
-
3D CAD software is essential for designing products for 3D printing, which is a rapidly growing market
3D printing presents a significant opportunity for 3D CAD software. This technology is important for designing objects specifically for additive manufacturing. 3D CAD software allows designers to create models with features and details that are optimized for the 3D printing process, ensuring successful printing and functionality of the final product. As 3D printing becomes more important across various industries, the demand for 3D CAD software with its compatibility and design capabilities will continue to rise.
Segment Analysis
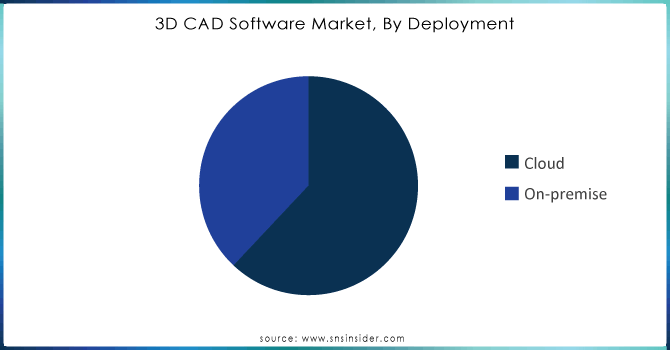
By Deployment
In 2023, the on-premises segment held the largest revenue share of more than 65.8%. This is due to the preference for on-premises solutions in industries where data security, control, and customization are critical. Additionally, these solutions offer robust functionality and performance, which are often necessary for complex design and engineering tasks. On-premises solutions face challenges in scalability, require additional hardware and servers, and have limited mobility, restricting users to physical workstations. They also demand substantial maintenance and troubleshooting efforts. The cloud-based deployment segment is expected to grow with the highest CAGR from 2024 to 2032, driven by its cost-efficiency, eliminating the need for expensive hardware and IT infrastructure. Cloud solutions improve collaboration among designers and engineers across different locations and provide advanced security features, such as encryption and multi-factor authentication, to safeguard designs and intellectual property.
Get Customized Report as per Your Business Requirement - Request For Customized Report
By Application
The manufacturing application segment led the 3D CAD software market and held more than 23% of the revenue share in 2023, driven by the growing use of additive manufacturing technologies such as 3D printing. CAD software is important for designing 3D printable parts, and its demand increases with the expanding use of 3D printing across industries. The need for customization in manufacturing also boosts demand, as 3D modeling software allows for the creation of tailored designs to meet specific customer needs. The advancements in cloud computing and virtual reality have driven market growth, with cloud-based software facilitating easy collaboration and data access, and virtual reality enabling realistic design visualization and testing. The healthcare application segment is growing with the fastest CAGR from 2024-2031. Detailed 3D models of patient anatomy, created using medical imaging data, have transformed the medical device industry, enabling the production of customized implants and devices tailored to individual patients. The software also allows for simulation of device and implant placement, enhancing surgical planning and preparation.
Regional Analysis
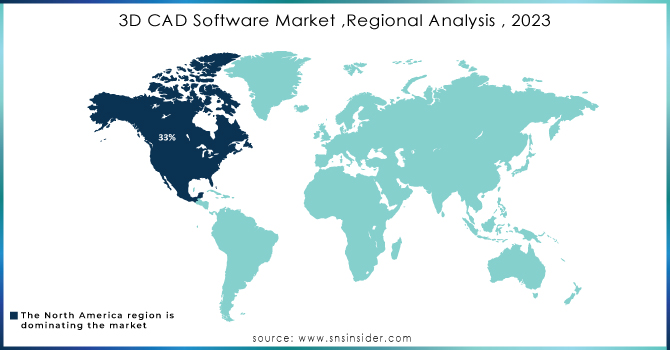
North America dominated the 3D CAD software market and held the highest revenue share of more than 31.5% in 2023, driven by the adoption of cloud-based solutions, increased automation in manufacturing, and growth in the aerospace and defense industries. Significant R&D investment in advanced CAD software and U.S. government support for digitization in manufacturing also contribute to this growth.
Asia Pacific region is expected to grow at the highest CAGR of around 7.80% from 2024-2032, due to the growing use of digital design tools, Industry 4.0 advancements, and expanding 3D printing applications. This growth is driven by increasing industrialization, rising investments in infrastructure, and the expansion of manufacturing sectors in countries like China, India, and Japan. Additionally, the region's growing focus on technological adoption and innovation further fuels this market expansion. Software such as Solidworks, Autodesk Inventor, CATIA, PTC Creo, and Siemens NX are widely used in automotive, aerospace, and industrial design for product development, simulation, and analysis, supporting the region's growing engineering and design sectors.
Key Players
Autodesk Inc., AVEVA Group plc, Bentley Systems Incorporated, Bricsys NV., Dassault Systems SE, IronCAD, LLC., PTC Inc., Siemens Industry Software Inc., Trimble Inc., ZWSOFT Co., Ltd., Beijing generous Digital Technology Co., Ltd. (CAXA), Graphisoft, Hexagon AB, Oracle, and other players.
| Report Attributes | Details |
| Market Size in 2023 | USD 10.93 billion |
| Market Size by 2032 | USD 19.82 billion |
| CAGR | CAGR of 6.82% From 2024 to 2032 |
| Base Year | 2023 |
| Forecast Period | 2024-2032 |
| Historical Data | 2020-2022 |
| Report Scope & Coverage | Market Size, Segments Analysis, Competitive Landscape, Regional Analysis, DROC & SWOT Analysis, Forecast Outlook |
| Key Segments |
• By Deployment type (Cloud and On-premise) • By Application (Architecture, Engineering, & Construction (AEC), Manufacturing, Automotive, Healthcare, Media & Entertainment, Others) |
| Regional Analysis/Coverage | North America (US, Canada, Mexico), Europe (Eastern Europe [Poland, Romania, Hungary, Turkey, Rest of Eastern Europe] Western Europe] Germany, France, UK, Italy, Spain, Netherlands, Switzerland, Austria, Rest of Western Europe]), Asia Pacific (China, India, Japan, South Korea, Vietnam, Singapore, Australia, Rest of Asia Pacific), Middle East & Africa (Middle East [UAE, Egypt, Saudi Arabia, Qatar, Rest of Middle East], Africa [Nigeria, South Africa, Rest of Africa], Latin America (Brazil, Argentina, Colombia, Rest of Latin America) |
| Company Profiles | Autodesk Inc., AVEVA Group plc, Bentley Systems Incorporated, Bricsys NV., Dassault Systems SE, IronCAD, LLC., PTC Inc., Siemens Industry Software Inc., Trimble Inc., ZWSOFT Co., Ltd., Beijing generous Digital Technology Co., Ltd. (CAXA), Graphisoft, Hexagon AB, Oracle |
| Key Drivers | • Rising need for customization in product design and development • Expansion of engineering services and increasing demand for outsourcing design services |
| Restraints | •The high cost of acquiring and implementing 3D CAD software can be a barrier, particularly for small and medium-sized enterprises (SMEs) • The risk of data breaches and intellectual property theft associated with cloud-based CAD solutions |
Frequently Asked Questions
Ans: - The primary growth tactics of 3D CAD Software market participants include merger and acquisition, business expansion, and product launch.
Ans: - In terms of revenue, North America dominated the market.
Ans: - The segments covered in the 3D CAD Software Market report for study are On the Basis of Component, Type, Streaming Type, End-user.
Ans: The 3D CAD Software Market is to grow at a CAGR of 6.82% over the forecast period 2024-2032.
Ans: - The 3D CAD Software market size was valued at USD 10.93 Bn in 2023.
Get in Touch
