3D Printing Construction Market Size & Overview:
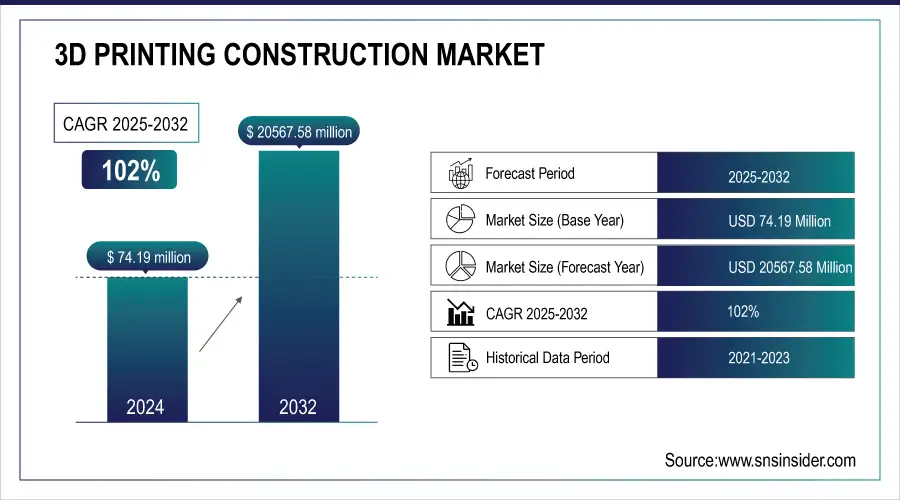
The 3D Printing Construction Market was valued at USD 74.19 million in 2024 and is expected to reach USD 20567.58 million by 2032, growing at a CAGR of 102% between 2025 and 2032.
The 3D Printing Construction Market is experiencing significant growth due to the increasing demand for faster, cost-efficient, and sustainable construction methods. This technology is reshaping the construction industry by allowing for quicker project completion, reduced material waste, and enhanced design flexibility. The growth is primarily driven by its ability to streamline complex architectural designs and structures while minimizing labor costs, making it attractive for residential, commercial, and infrastructure projects. Key trends in the market include the adoption of large-scale 3D printers for building houses and infrastructure, along with the use of eco-friendly and innovative materials such as concrete and bio-based substances. Governments and private enterprises are increasingly investing in 3D printing technology to address housing shortages and enhance construction sustainability. Automation and artificial intelligence are further improving the accuracy and scalability of 3D printing in construction.
To get more information on 3D Printing Construction Market - Request Free Sample Report
Key 3D Printing Construction Market Trends
-
Adoption of AI-driven design algorithms to optimize structural strength, reduce material wastage, and enable complex architectural geometries.
-
Growing use of sustainable binders and recycled aggregates in 3D printable concrete to align with green construction practices and carbon-neutral targets.
-
Integration of digital twin platforms for real-time monitoring, predictive performance analysis, and lifecycle management of 3D-printed structures.
-
Expansion of modular 3D-printed components that can be prefabricated off-site and rapidly assembled to accelerate housing and infrastructure projects.
-
Rising deployment of autonomous construction robots and drones to streamline large-scale 3D printing, site surveying, and quality assurance.
3D Printing Construction Market Growth Drivers:
-
The increasing demand for sustainable and eco-friendly construction practices is driving the 3D printing construction market, as it reduces material wastage and supports environmentally responsible building solutions.
The growing demand for sustainable and eco-friendly construction practices is a key driver of the 3D printing construction market. As industries and governments prioritize environmental responsibility, traditional construction methods are being scrutinized for their high material wastage, energy consumption, and significant carbon footprint. In contrast, 3D printing offers a solution by precisely depositing materials only where needed, significantly reducing waste compared to conventional methods. This technology not only minimizes excess material use but also promotes the use of sustainable materials such as recycled concrete, geopolymers, and bio-based materials.
Moreover, 3D printing construction supports energy efficiency throughout the building process. Since the technology is digitally controlled, it allows for the creation of complex, optimized designs that enhance the structural efficiency of buildings, reducing the need for excess raw materials. This precision and resource efficiency make 3D printing a highly attractive option for green construction projects, as it aligns with the increasing demand for lower environmental impact and reduced carbon emissions in building activities.
Governments and companies worldwide are increasingly adopting 3D printing technology as part of their broader sustainability goals. Many regions, especially those with stringent environmental regulations, see 3D printing as a viable solution to meet green building standards and reduce reliance on non-renewable resources. Overall, the market is being driven by the growing need for eco-friendly, waste-reducing construction techniques that align with global sustainability targets.
-
3D printing in construction offers cost efficiency and significantly reduces construction time by minimizing labor and material needs, enabling faster project completion.
3D printing in construction provides notable cost efficiency and accelerates project timelines by reducing both labor and material requirements. The technology enables precise and automated construction of structures, which minimizes the need for extensive manual labor and decreases material waste through accurate production. This efficiency leads to lower overall project costs, as fewer resources are required. Additionally, 3D printing allows for rapid production of components, significantly shortening construction time. Large-scale structures that would traditionally take months to build can be completed in a fraction of the time with 3D printing technology. By streamlining the construction process, this innovation supports faster project completion and can meet tight deadlines without compromising quality. These advantages make 3D printing a transformative tool in the construction industry, driving growth and adoption worldwide.
3D Printing Construction Market Restraints:
RESTRAIN
-
Limited material availability and challenges in ensuring compliance with building codes and regulations hinder the widespread adoption of 3D printing construction, slowing market growth.
The widespread adoption of 3D printing in construction is hindered by limited material availability and the complexities of ensuring compliance with building codes and regulations. While 3D printing offers the potential for cost-effective, sustainable building methods, the availability of suitable materials is still limited, especially in large-scale construction projects. Current materials often lack the durability, strength, or flexibility required for various structural applications, posing a significant barrier to broader use. Additionally, navigating the complex and evolving landscape of building codes and regulations adds further challenges. These codes often don't account for the unique aspects of 3D-printed structures, making it difficult for builders to ensure compliance. As a result, these challenges combine to slow the growth of the 3D printing construction market, delaying its potential to revolutionize the industry. Addressing material development and regulatory frameworks is key to unlocking the technology's full potential.
3D Printing Construction Market Segment Analysis
-
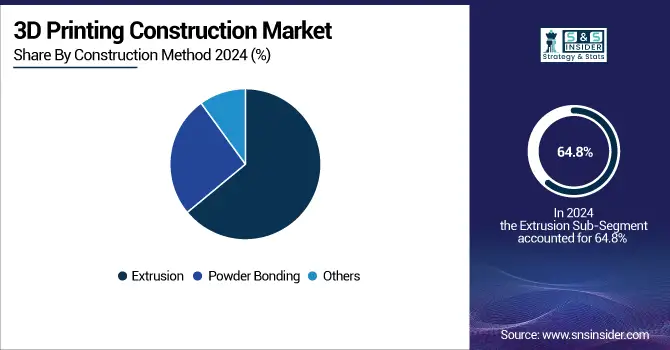
By Construction Method
The extrusion method segment dominated the market and accounted for the maximum revenue share of more than 64.8% in 2024.The segment is estimated to expand further at the fastest CAGR maintain its leading position throughout the forecast period. Extrusion 3D printing is also known as Fused Deposition Modeling, which is one of the additive manufacturing techniques used for prototyping, modeling, and production applications. The extrusion-based method is majorly used for on-site construction.
-
By Material Type
The concrete material type segment dominated the market and accounted for the largest revenue share of more than 36.4% in 2024. 3D concrete printing is increasingly being used as an alternative to conventional concrete construction owing to its potential to reduce cost, labor, and time and increase overall productivity. However, with the use of 3D-printed concrete formworks, it is possible to create double-curved surfaces and organic geometry, among others, at a fraction of the cost.
-
By End-User
The building segment dominated the market and accounted for a 74.06% market revenue in 2024. The building segment comprises commercial, residential, and industrial construction. Various construction companies are entering into partnerships with 3D printer providers for constructing homes using 3D printing technology.
3D Printing Construction Market Regional Outlook
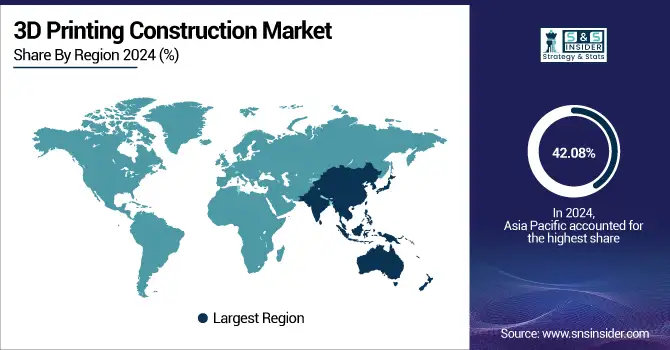
Asia Pacific 3D Printing Construction Market Insights
The Asia Pacific region dominated the 3D printing construction market with 42.08% revenue in 2024. Rapid urbanization, large-scale infrastructure projects, and the region’s emergence as a global manufacturing hub are fueling adoption. China and Japan lead innovation, offering extensive opportunities for both mature and emerging 3D printing construction technologies.
Need any customization research on 3D Printing Construction Market - Enquiry Now
North America 3D Printing Construction Market Insights
North America, led by the United States, remains a key player in the 3D printing construction market. Market growth is driven by advanced infrastructure, technological innovation, and rising adoption in residential and commercial projects. Companies increasingly implement 3D printing to improve efficiency, reduce costs, and enhance construction sustainability.
Europe 3D Printing Construction Market Insights
Europe is witnessing steady growth in 3D printing construction, driven by sustainability mandates and smart city projects. Countries like Germany, the UK, and the Netherlands focus on integrating innovative construction technologies to enhance efficiency and reduce carbon footprints. The presence of several established manufacturers accelerates market adoption across the region.
Middle East & Africa 3D Printing Construction Market Insights
The Middle East & Africa market is expanding due to large-scale construction initiatives, particularly in smart cities and luxury infrastructure. Countries such as the UAE and Saudi Arabia are adopting 3D printing to reduce construction time and costs while embracing sustainable building solutions, creating a favorable environment for technological growth.
Latin America’s 3D Printing Construction Market Insights
Latin America’s 3D printing construction market is emerging gradually, with Brazil and Mexico at the forefront. Investment in affordable housing projects, infrastructure modernization, and technological experimentation drives adoption. Though still developing, the region presents substantial opportunities for growth as construction companies increasingly explore innovative 3D printing solutions.
3D Printing Construction Market Companies are:
-
Apis Cor
-
COBOD International A/S
-
D-shape
-
Heidelberg Cement AG (Italcementi SpA)
-
LafargeHolcim
-
Sika AG
-
Skanska
-
Yingchuang Building Technique (Shanghai) Co., Ltd. (Winsun)
-
XtreeE
-
Contour Crafting Corp.
-
ICON Technology, Inc.
-
WASP S.r.I
-
Mighty Buildings
-
SQ4D
-
Branch Technology
-
PERI Group
-
3D Printhuset
-
BetAbram
Competitive Landscape for 3D Printing Construction Market:
STRABAG SE, founded in 1835, is a leading European construction company headquartered in Vienna, Austria. The company specializes in building construction, civil engineering, transportation infrastructure, and tunneling. With a strong focus on innovation, digitalization, and sustainability, STRABAG delivers large-scale projects worldwide, emphasizing efficiency, safety, and environmentally responsible construction practices.
- In May 2024: A building with load-bearing concrete walls was built from a single 3D print by Züblin, a construction engineering company based in Germany and a subsidiary of Putzmeister and Strabag. The company claims this is a "world first." The structure is the newest warehouse for Strabag Baumaschinentechnik International in Stuttgart, Germany. As it is constructed, Züblin's 3D printing technology will be tested in addition to creating a new facility for Strabag.
ABB Robotics, founded in 1988 and headquartered in Zurich, Switzerland, is a global leader in industrial automation and robotics solutions. It specializes in collaborative robots, AI-driven automation, and digital manufacturing technologies, empowering industries to enhance productivity, safety, and sustainability through innovative robotic systems and advanced software integration.
- In January 2024: ABB Robotics and Simpliforge Creations are revolutionizing India’s construction industry with their latest collaboration. Combining ABB’s advanced robots and RobotStudio with Simpliforge’s cutting-edge software, the partners are developing South Asia’s largest robotic concrete 3D printer. This groundbreaking initiative has already led to the creation of the world’s first 3D printed place of worship and India’s inaugural 3D printed bridge. The integration of robotics and 3D printing, alongside traditional construction methods, promises enhanced efficiency, safety, and sustainability for the sector.
| Report Attributes | Details |
|---|---|
| Market Size in 2024 | USD 74.19 million |
| Market Size by 2032 | USD 20567.58 million |
| CAGR | CAGR of 102% From 2025 to 2032 |
| Base Year | 2024 |
| Forecast Period | 2025-2032 |
| Historical Data | 2021-2023 |
| Report Scope & Coverage | Market Size, Segments Analysis, Competitive Landscape, Regional Analysis, DROC & SWOT Analysis, Forecast Outlook |
| Key Segments |
•By Construction Method (Extrusion, Powder Bonding, Others) •By Material Type (Concrete, Metal, Composite, Others) •By End-User (Building, Infrastructure) |
| Regional Analysis/Coverage |
North America (US, Canada), Europe (Germany, France, UK, Italy, Spain, Poland, Russsia, Rest of Europe), Asia Pacific (China, India, Japan, South Korea, Australia,ASEAN Countries, Rest of Asia Pacific), Middle East & Africa (UAE, Saudi Arabia, Qatar, Egypt, South Africa, Rest of Middle East & Africa), Latin America (Brazil, Argentina, Mexico, Colombia Rest of Latin America) |
| Company Profiles |
Apis Cor, COBOD International A/S, CyBe Construction, D-shape, Heidelberg Cement AG (Italcementi SpA), LafargeHolcim, Sika AG, Skanska, Yingchuang Building Technique (Shanghai) Co., Ltd. (Winsun), XtreeE, MX3D, Contour Crafting Corp., ICON Technology, Inc., WASP S.r.I, Mighty Buildings, SQ4D, Branch Technology, PERI Group, 3D Printhuset, BetAbram |
Frequently Asked Questions
Ans: Asia-Pacific is the dominating region in the 3D Printing Construction Market.
Ans: The increasing demand for sustainable and eco-friendly construction practices is driving the 3D printing construction market, as it reduces material wastage and supports environmentally responsible building solutions.
Ans: Extrusion segmentation is the dominating segment by construction method in the 3D Printing Construction Market.
Ans: 3D Printing Construction Market size was USD 74.19 Million in 2024 and is expected to Reach USD 20567.58 Million by 2032.
Ans: The 3D Printing Construction Market is expected to grow at a CAGR of 102%.
Get in Touch
