4K Display Resolution Market Size Analysis:
The 4K Display Resolution Market was valued at USD 224.08 billion in 2025 and is expected to reach USD 1331.84 billion by 2035, growing at a CAGR of 19.51% from 2026-2035.
The 4K Display Resolution Market is growing rapidly, due to an increasing demand in TVs and gaming monitors followed by energy efficiency measures undertaken by display companies. Improvements in OLED or QLED technology and reduction in production cost is making it more affordable Adoption is accelerating as high-quality streaming, next-gen gaming consoles and use in advertising, healthcare, education etc. are on the rise. Rising OTT platforms, rise in disposable income and a definite trend toward larger screens, facilitate greater market penetration that could render 4K displays mainstream across every category.
-
Device preferences reflect this trend, with Smart TVs and set-top boxes accounting for 69% of video-on-demand viewing time and 87% for linear TV.
-
Free services are also surging, as YouTube’s share of connected TV viewership in the U.S. rose to 12.8% by June 2025, outpacing all paid services, while free AVOD platforms such as Tubi and The Roku Channel rapidly expanded.
-
Lifetime of OLED panels now often reaches 30,000–50,000 hours before brightness decreases to 70% of the initial output.
4K Display Resolution Market Size and Growth Projection:
-
4K Display Resolution Market Size in 2025: USD 224.08 Billion
-
4K Display Resolution Market Size by 2035: USD 1331.84 Billion
-
CAGR: 19.51% from 2026 to 2035
-
Base Year: 2025
-
Forecast Period: 2026–2035
-
Historical Data: 2022–2024

To Get more information On 4K Display Resolution Market - Request Free Sample Report
4K Display Resolution Market Trends
-
Rising consumer demand for high-definition visual experiences is driving the 4K display resolution market.
-
Growing adoption across TVs, monitors, laptops, and mobile devices is boosting market growth.
-
Expansion of streaming services, gaming, and professional content creation is fueling deployment.
-
Increasing focus on enhanced picture quality, HDR support, and immersive viewing experiences is shaping adoption trends.
-
Advancements in OLED, QLED, and micro-LED technologies are improving display performance and energy efficiency.
-
Rising entertainment consumption and home theater setups are supporting market expansion.
-
Collaborations between display panel manufacturers, device OEMs, and content providers are accelerating innovation and global adoption.
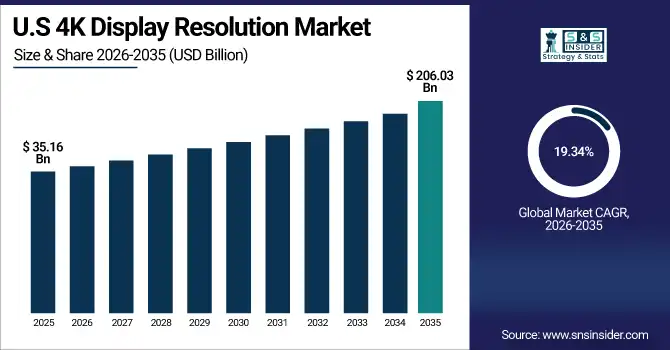
U.S. 4K Display Resolution Market Size Outlook
The U.S. 4K Display Resolution Market was valued at USD 35.16 billion in 2025 and is expected to reach USD 206.03 billion by 2035, growing at a CAGR of 19.34% from 2026-2035. growth is driven by Increasing adoption of an advanced display technologies, the demand for high-quality streaming and gaming experiences, rise in OTT services, growing preference toward a larger screen in residential and commercial applications.
4K Display Resolution Market Growth Drivers:
-
Rising Demand for Superior Visual Experience Across Entertainment, Gaming, And Digital Signage Sectors is Fueling 4k Display Resolution Adoption Globally
Demand in the outlet of consumer for home entertainment, gaming, and digital signage with a high quality of visuals which supports 4k display resolution. 4K also called offers stunning clarity that far outstrips what you can experience in any other resolution whether that is TV, film, gaming or commercial displays. Streaming services, next-gen consoles and immersive media are expected to drive digital expansion. The demand of 4K resolutions grows from business advertising, and public displays for sharply defined images. Lower prices and more content are allowing resolutions to improve at an unprecedence pace, leading to rapid uptake in the consumer and commercial sectors, boosting global market growth.
-
In its 2024 global TV lineup announcement, Samsung stated that Neo QLED and OLED models now make up a significant share of premium TV sales, with strong growth in sizes 75 inches and above, directly driven by demand for 4K and 8K resolutions.
-
Sony’s PlayStation 5, which outputs in native 4K, has sold over 59.2 million units globally as of May 2025, contributing significantly to 4K gaming adoption.
4K Display Resolution Market Restraints:
-
High Cost of Advanced 4K Display Equipment and Infrastructure Limits Adoption in Cost-Sensitive Markets and Emerging Economies
While 4K display prices have dropped, high-end OLED and premium QLED models are still expensive where consumers are price sensitive. Most consumers in developing economies opt for lower resolution choices due to pricing. Lack of widespread high-speed internet availability also contributes to hindered 4K streaming uptake. The upgrading display technology for public areas in developing regions have similar challenges faced by commercial sectors. These economic and infrastructure limitations slow down market penetration, and the replacement duration extends even further when the income levels in areas cannot support the premium price of high-end 4K display solutions.
4K Display Resolution Market Opportunities:
-
Rapid Growth of Gaming, Virtual Reality, And Augmented Reality Markets is Boosting the Demand for High-Performance 4K Display Devices
The desire for immersive experiences in gaming is already speeding up adoption of 4K, with next-gen consoles, high-performance gaming PCs, and high-refresh-rate monitors all driving placement of the specification into the market. VR and AR requires ultra-high resolution displays to increase the realism and sheer motion sickness. High level e-sports and professional streaming only reinforces the demand for the best visuals. Gamers have demanded more capable devices as the number of 4K and HDR optimized titles continues to grow. Couple that with stronger gaming and VR and AR trends and you have enough momentum for 4K displays to be a definitive addition to the future of interactive entertainment
-
The PlayStation VR2, released in February 2023, features "4K" OLED (PenTile) displays, offering 2000 × 2040 resolution per eye at 90–120 Hz demonstrating high-res VR hardware performance.
-
The newly released Nintendo Switch 2 (launched June 5, 2025) enables 4K resolution at 60 Hz with HDR when docked an important step for hybrid console importance in the 4K ecosystem.
4K Display Resolution Market Segment Analysis
By Application
Television maintained dominance in the 4K Display Resolution Market share in 2025 of a 42%, owing to mass consumer adoption, drop in panel prices and adoption of advanced features, including HDR and smart features in televisions itself. The availability of 4K content through streaming platforms and broadcast channels drove demand. The inception of monumental 4k TVs found wide acceptance as immersive home entertainment portions, whereas televisions held a decisive position in the revenue-generating application category.
Gaming Displays are projected to grow at the fastest CAGR of 23.50% over 2026 to 2035, due to rising Competitive Gaming demand for higher refresh rates, ultra-low latency and higher levels of HDR performance. Adoption is being driven by the growth of e-sports, next-gen consoles and gaming titles optimized for 4K. As the adoption of VR and AR technology spreads, the demand for ultra-high-performance displays suited to immersive gaming experiences grows accordingly.
By End User
Residential applications held the largest market share at 50% in 2025, driven by high adoption of 4K TVs, monitors and home theatre systems. Growing household appetite slowed only by falling device prices, broadening broadband penetration, and more widespread availability of 4K streaming services. The consumer demand for bigger and higher resolution displays for entertainment sustains the upgrade cycle the drives lucrative powerhouse in the 4K Display Resolution Market.
Healthcare is expected to record the fastest CAGR of 22.49% over 2026 to 2035, owing to the rapid adoption of 4K for medical imaging, and other diagnostics, and surgical displays. Higher quality detail leads to precision in minimally invasive procedures and radiology interpretation and thus, results in optimized outcomes. Growing demand has been attributed for the increasing adoption of advanced visualization technologies by hospitals and clinics for imaging purpose, telemedicine and training.
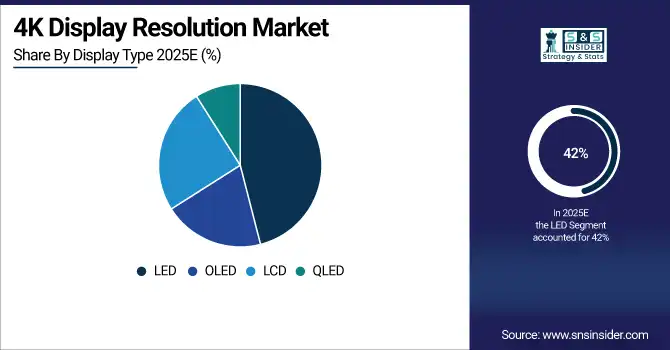
By Display Type
LED displays accounted for the largest revenue share of 42% in 2025, due to low-cost, low-energy, and ubiquitous technology used in a range of screen sizes. This allowed automakers to leverage existing production methods to deliver brighter, longer, and higher-quality images at a lower price point. This created an inclination of dominating the 4K Display Resolution Market for the use of LED in televisions, monitors and signage applications.
OLED displays are forecast to grow at the fastest CAGR of 21.60% over 2026 to 2035, due to their higher contrast ratios, deeper blacks, and wider viewing angles. Market growth is driven by the rising affordability and usage of premium consumer electronics and increasing demand for flexible and ultra-thin displays. OLED continues to be a natural fit for both premium TVs and new foldable formats, which would help it retain strength in the changing 4K TV landscape.
By Screen Size
The 32 to 55 inches category dominated the 4K Display Resolution Market in 2025 with a 44% share, owing to its balance of affordability and immersive viewing experiences. This size range appeals to both small and medium living spaces, thereby connecting with a wide consumer base. The strong demand helped the market leadership to secure on global basis owing to wide content compatibility and availability on budget to premium models.
The 56 to 75 inches segment is expected to grow at the fastest CAGR of 21.32% over 2026 to 2035, driven by consumer inclination toward larger home entertainment screens. These advancements in display technology, better power efficiency and lower costs help put large-format 4K displays in the reach of more homes. Rapid adoption of this size range (70-inch and greater) is also accelerated by consumers spending more time watching movies at home, gaming and higher-than-average demand for home theater systems.
By Connectivity Technology
HDMI led the 4K Display Resolution Market in 2025 with a 54% revenue share as it is becoming the central standard that is used for high-definition video and audio transmission. HDMI 2.1 with its higher bandwidth support for high refresh rate 4K has also been introduced, which is of interest to gamers, streamers, and others who need this feature. The fact it works with literally anything means HDMI continues to be the go-to choice when it comes to connectivity.
Wireless connectivity is projected to grow at the fastest CAGR of 22.12% over 2026 to 2035, propelled by increasing demand for cable-free, mess-free arrangement in homes and workplaces. New Wi-Fi 6, 5G, and wireless HDMI tech allow for 4K streaming and gaming on-the-go. Expansion in smart televisions, projection TVs, and commercial display systems will further drive demand, catering to users willing to sacrifice the highest level of video quality in favor of the flexibility and ease-of-use of an integrated solution.
4K Display Resolution Market Regional Analysis
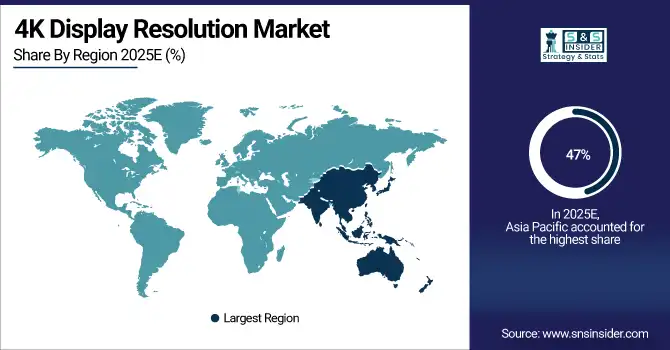
Asia Pacific 4K Display Resolution Market Insights
Asia Pacific held the largest share of 47% in the 4K Display Resolution Market in 2025, driven by consumer electronics supply chains and infrastructures, greater disposable incomes, and the diffusion of high-end display technologies in China, Japan, and South Korea. Dominance in the region was further propelled by an expanding broadband infrastructure, rising 4K content, high penetration of smart devices in addition to competitive pricing for Ultra HD television set display and rapid advancement of the technology by leading display manufacturers.
Get Customized Report as per Your Business Requirement - Enquiry Now
Middle East & Africa 4K Display Resolution Market Insights
Middle East & Africa is projected to grow at the fastest CAGR of 23.94% over 2026 to 2035, owing to increasing urbanization, growing investments in smart city projects and demand for premium home entertainment systems. Industrial and Commercial Application segment is experiencing growth due to expanding retail electronics markets, better internet infrastructure and increased usage of 4K displays in commercial applications such as hospitality and advertising. Fast regional growth is further driven by government initiatives in digital transformation.
North America 4K Display Resolution Market Insights
North America’s 4K Display Resolution Market is driven by increasing demand from consumers who are keen on adopting next generation visual technologies, availability of 4K content, and their adoption in consumer, entertainment, gaming, and commercial markets, all buttressed by strong technology push and digital infrastructure.
Europe 4K Display Resolution Market Insights
Europe’s 4K Display Resolution Market is driven by increasing consumer preference for high-end visual experiences, rapid technological developments in display panel technologies, and growing deployment in entertainment, gaming, and commercial applications. Rich supply of 4K content and cheaper devices are also allowing regional markets to grow.
Latin America 4K Display Resolution Market Insights
Growing adoption of consumer electronics, enhanced broadband infrastructure, and increasing requirement for watching high-definition videos on television, monitor and digital signage units are some of the key factors that help drive the market growth of 4K display resolution in Latin America. Stable growth is also being supported by expanding entertainment, gaming, and commercial display applications in the region.
4K Display Resolution Market Competitive Landscape:
ViewSonic Corporation
ViewSonic, a California-based multinational company founded in 1987, is a supplier of visual solutions including monitors, projectors, and interactive displays. It is an inspiration of learning, presentation and professional tool that offers innovative visuals and communication solutions primarily in the education, business, and collaborative environment. ViewSonic is boasting interactivity, connectivity and 4K visuals for immersion and team collaboration. It has a diverse product portfolio that includes interactive flat panels, large-format displays, and professional monitors.
-
2024: ViewSonic launched the ViewBoard IFP110 at InfoComm 2024, a 110-inch interactive display with native 4K UHD resolution for collaborative and educational environments.
Acer Incorporated
Acer is a Taiwanese multinational computer hardware and electronics corporation founded in 1976. It caters consumers, businesses and gamers globally through their portfolio that includes laptops, desktops, monitors and gaming systems. Acer focuses on high-end devices with fast panels and HDR for gamers and professional workloads. Acer's position in enterprise and gaming markets is underpinned by innovation in hardware design, display fidelity, and performance optimization.
-
2024: Acer unveiled the Predator XB273K V5 on September 4, 2024, a 27-inch 4K UHD gaming monitor with 160 Hz refresh rate and VESA DisplayHDR 400 certification.
Samsung Electronics
Samsung Electronics is a South Korean multinational conglomerate founded in 1969 and one of the largest electronics manufacturers in the world. Samsung is recognized for innovation in the realms of TVs, smartphones, and home appliances and even has a long-standing commitment to display technology in the form of QLED, Neo QLED, and innovations in quantum-dot tech with a hefty investment on display advancements. Its products emphasize advanced color precision, contrast and resolution intended for consumers, professionals, and the entertainment industry.
-
2023: Samsung released its Neo QLED 4K TV lineup in 2023, featuring Quantum Mini LED technology for improved contrast, color accuracy, and advanced 4K upscaling capabilities.
4K Display Resolution Companies are:
-
Apple Inc.
-
BenQ Corporation
-
LG Electronics
-
Hisense Group
-
Sony Corporation
-
Samsung Electronics
-
Acer Incorporated
-
Asus Computer International
-
Microsoft Corporation
-
Panasonic Corporation
-
Dell Technologies
-
Sharp Corporation
-
Vizio Inc.
-
AU Optronics Corporation
-
EIZO Corporation
-
Canon Inc.
-
BOE Technology Group Co., Ltd.
-
Skyworth Digital Holdings Co., Ltd.
| Report Attributes | Details |
|---|---|
| Market Size in 2025 | USD 224.08 Billion |
| Market Size by 2035 | USD 1331.84 Billion |
| CAGR | CAGR of 19.51% From 2026 to 2035 |
| Base Year | 2025 |
| Forecast Period | 2026-2035 |
| Historical Data | 2022-2024 |
| Report Scope & Coverage | Market Size, Segments Analysis, Competitive Landscape, Regional Analysis, DROC & SWOT Analysis, Forecast Outlook |
| Key Segments | • By Display Type (LED, OLED, LCD, QLED) • By Application (Television, Computer Monitors, Projectors, Digital Signage, Gaming Displays) • By End User (Residential, Commercial, Educational, Government, Healthcare) • By Screen Size (Less than 32 inches, 32 to 55 inches, 56 to 75 inches, Above 75 inches) • By Connectivity Technology (HDMI, DisplayPort, Wireless, USB-C) |
| Regional Analysis/Coverage | North America (US, Canada), Europe (Germany, UK, France, Italy, Spain, Russia, Poland, Rest of Europe), Asia Pacific (China, India, Japan, South Korea, Australia, ASEAN Countries, Rest of Asia Pacific), Middle East & Africa (UAE, Saudi Arabia, Qatar, South Africa, Rest of Middle East & Africa), Latin America (Brazil, Argentina, Mexico, Colombia, Rest of Latin America). |
| Company Profiles | Apple Inc., ViewSonic Corporation, BenQ Corporation, LG Electronics, Hisense Group, Sony Corporation, Samsung Electronics, TCL Technology, Acer Incorporated, Asus Computer International, Microsoft Corporation, Panasonic Corporation, Dell Technologies, Sharp Corporation, Vizio Inc., AU Optronics Corporation, EIZO Corporation, Canon Inc., BOE Technology Group Co., Ltd., Skyworth Digital Holdings Co., Ltd. |
Frequently Asked Questions
Ans: Asia Pacific dominated the 4K Display Resolution Market in 2025 with 47% revenue share, supported by manufacturing hubs, rising incomes, and high adoption of advanced displays.
Ans: The LED segment dominated the 4K Display Resolution Market with 42% revenue share in 2025, due to cost-effectiveness, energy efficiency, and broad availability.
Ans: Rising consumer demand for superior visual experiences, adoption of advanced displays such as OLED/QLED, streaming content, and next-generation gaming consoles drive market growth.
Ans: The 4K Display Resolution Market was valued at USD 224.08 billion in 2025, driven by growing consumer demand and adoption across multiple applications globally.
Ans: The 4K Display Resolution Market is expected to grow at a CAGR of 19.51% from 2026 to 2035.
Get in Touch
