Social Media Analytics Market Report Scope & Overview:
Get more information on Social Media Analytics Market - Request Sample Report
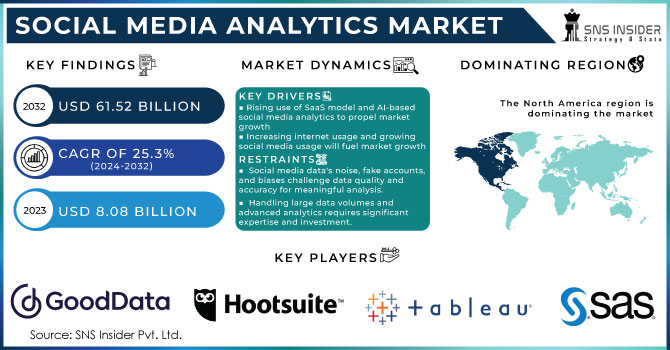
Social Media Analytics Market size was valued at USD 8.08 billion in 2023. It is expected to hit USD 61.52 Billion by 2032 and grow at a CAGR of 25.3% over the forecast period of 2024-2032.
The global use of social media analytics market has been driven by the growing adoption of enterprise intelligence techniques, superior analytics techniques, and the continuously growing social media users. By January 2024, the quantity of worldwide social media customers rose to 5.04 billion from 4.72 billion in January 2023. This signifies an increase of 8% alongside a further 320 million customers annually. The industry is experiencing growth because of increasing spending on analytics and extended interest in aggressive intelligence. Promising market opportunities are being highlighted by way of the higher adoption prices of small and medium enterprises (SMEs) and the growing use of cloud services. Businesses are increasingly utilizing real-time analytics to monitor the activity of users and quickly react to social media discussions. The growth of social media influencers has heightened the demand for influencer analytics, allowing companies to identify optimal partnerships. By April 2024, the popular social media platforms international in terms of active users are Facebook, boasting 3065 million users, YouTube with 2,504 million customers, Instagram and WhatsApp with 2,000 million customers, and WeChat with 1,343 million customers. These social media platforms are continuously growing globally due to their large variety of users.
Worldwide 6.84 billion smartphones used in 2024. Moreover, half of the American population dedicates around 5 to 6 hours daily to using their smartphones, highlighting the important function these gadgets serve in daily life and interacting with others. Businesses use social media analytics for purposes such as networking, advertising, and gaining knowledge about user needs, market demand, and growth potential. These tools aid in product development, customer experience, market intelligence, and operational efficiency. Prominent examples include IBM Watson's behaviour and sentiment analysis and Sprout Social's integrated platform for various social networks. These solutions utilize AI for real-time data extraction from major social platforms and serve diverse industries like technology, retail, and government. The demand for cloud-based analytical solutions and emerging technologies integration is accelerating market growth, with companies like Qualtrics launching advanced tools for comprehensive customer understanding.
Drivers
-
Rising use of SaaS model and AI-based social media analytics to propel market growth
-
Increasing internet usage and growing social media usage will fuel market growth
Market growth in industries together with retail, and hospitality, is driven by the growing adoption of cloud-primarily based and AI-powered social media analytics solutions. AI-powered analytics offerings have become increasingly popular in advanced countries in the U.K., the U.S., France, and Japan. Companies are developing their cloud-based artificial intelligence and facts analytics to stay competitive in the market. In March 2023, Digimind released a social listening solution that integrates OpenAI’s ChatGPT with Digimind AI Sense, making an allowance for greater efficient analytics and responses to online chats. International competition is compressing profit margins, leading businesses to search for ways to reduce costs. To gain an edge, companies integrate demographic, competitive, and business information with customer data, focusing on sales and market analysis to identify gaps and meet demand. Advanced analytics help achieve these market goals. Social media analytics provide insights from unstructured social data, enabling companies to respond to market changes and achieve high sales and profitability. These solutions support customer experience management, sales and marketing, performance monitoring, and workforce management, offering a competitive advantage by analysing customer behaviour and competition on social media.
Data from social interactions fuels business operations and revenue generation. Social media platforms are used for online purchases, communication, entertainment, health, and more. The growing use of smartphones further bolsters the market. The developing popularity of video content material, short films, and TV series is driving demand for PCs, laptops, tablets, and mobile phones. The increased use of smart devices with internet access in emerging markets generates more social media data, driving market growth.
Restraints
-
Social media data often includes noise, fake accounts, and biased information, making it challenging to ensure data quality and accuracy for meaningful analysis.
-
Managing large amounts of data, and implementing advanced analytics tools necessitate significant technological expertise and investment.
-
A lack of trained professionals in social media analytics is impeding the efficient use of analytical tools and insights.
Analyzing social media information requires a complex analytical process that includes identifying data, setting parameters, establishing business rules, preparing data, executing, modeling data, and visualizing results. Businesses use different methods like predictive, prescriptive, and descriptive analytics to optimize the value obtained from social media information. Data obtained from social media platforms is frequently disorganized, necessitating extra features for organization and improved analysis. This data comes in forms like comments, social listening, and opinion debates.
Social media analytics is still in its developing stages, and organizations are working to develop a comprehensive platform that can extract, transform, load, evaluate, and analyze social media data. Analysts need to integrate vast amounts of data from various social platforms and create effective models to achieve desired outcomes.
Segment Analysis
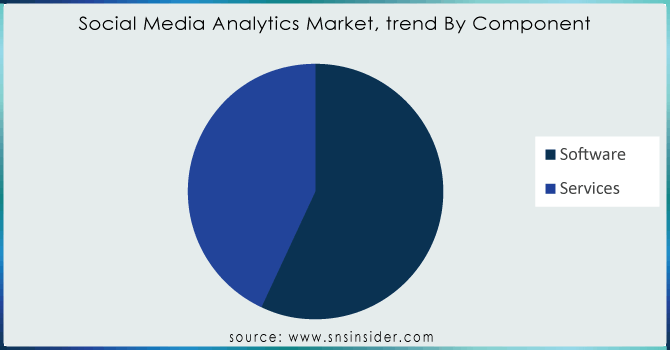
By Component
-
Software
-
Services
The software segment dominated the market in 2023, capturing a revenue share of more than 57% share. With the growing volume and speed of social media data, software tools are emphasizing real-time monitoring capabilities. This allows businesses to quick track and respond to feedback of client, emerging developments, or potential crises on social media. AI and ML (machine learning) technologies improve social media analytics software by enabling automated data processing, pattern recognition, and predictive analytics. These advancements help businesses uncover valuable insights and optimize their social media strategies. Companies are looking for carrier companies that could personalize their services to precise enterprise verticals, enterprise goals, and social media platforms. Tailored services provide insights directly relevant to unique business needs, facilitating data-driven decisions.
For example, in March 2022, Concept BIU introduced a customizable social media analytics and intelligence solution. This service offers accurate and fast social media updates, trends, and on-the-ground data to corporate clients and their agencies with just a few clicks. With this initiative, Concept BIU positions itself as India's only media monitoring and PR analytics service provider equipped to offer a comprehensive view of the media landscape and relevant data for a more effective brand strategy.
Need any customization research on Social Media Analytics Market - Enquiry Now
By Analytic Type
-
Prescriptive Analytics
-
Diagnostic Analytic
-
Descriptive Analytics
By Function
-
Sentiment Analysis
-
Competitive Analysis
-
Hashtag Analysis
-
Dashboard & Visualization
-
Others
In 2023, sentiment analysis segment held more than 36.5% revenue share. Researchers and developers are leveraging sentiment analytics to detect feelings along with pleasure, disappointment, anger, worry, surprise, and disgust in social media records. This technique is regularly incorporated with different analytics strategies, including topic modeling, network analysis, and influencer identification. Combining sentiment evaluation with those strategies permits groups to benefit from deeper insights from social media facts, contributing to growth of market. Sentiment analysis algorithms are delicate to hold close text context, with deep learning and contextual phrase embeddings improving the capture of contextual facts.
The dashboard and visualization segment is expected to grow with the fastest annual growth rate of 28% from 2024 to 2032. The growing volume and speed of social media facts make real-time visualization of data increasingly important. organizations and businesses want to monitor social media conversations and developments to respond swiftly and stay updated with recent developments. Network analysis strategies and social graph visualizations help recognize social connections, discover influential customers, locate groups, and examine information flow on social media structures.
By Application
-
Sales And Marketing Management
-
Customer Experience Management
-
Competitive Intelligence
-
Risk Management and Fraud Detection
-
Public Safety and Law Enforcement
In 2023, the risk management and fraud detection segment accounted for a revenue share of more than 31%. AI-powered algorithms make it possible to research huge quantities of social media data in actual time, leading to quicker identity and response to capacity dangers and fraudulent activities. Natural language processing (NLP) is crucial in knowledge and extracting beneficial insights from social media posts. With NLP, groups can improve their potential to examine social interactions, understand styles, compare sentiments, and uncover capability threats or dishonest behaviour.
Social media analytics offers important information on customer likes, beliefs, and demands, assisting in the development of products. By observing discussions on social media and evaluating responses, businesses can pinpoint areas in the market that need attention, uncover fresh ideas for products, and improve current offerings to cater to customer demands more effectively. This product development method focused on the user enhances the total customer satisfaction.
By Vertical
-
BFSI
-
IT And Telecommunications
-
Retail And Consumer Goods
-
Healthcare And Lifesciences
-
Government And Public Sector
-
Media And Entertainment
-
Travel And Hospitality
-
Others
The media and entertainment vertical held the largest revenue share of more than 24.3% in 2023. These industries are increasing the usage of social media analytics tools to gauge the success of their content material. Metrics together with engagement, reach, and audience sentiment assist them in understanding how their content resonates with visitors and make data-driven decisions to optimize content strategies. Social media analytics enables media and entertainment corporations to segment their target market primarily based on demographics, interests, and behaviors, bearing in mind centered advertising and marketing and content material efforts that create engaging and relevant stories, and improve viewership and engagement.
In healthcare, social media analytics tools are used to track and analyze discussions approximately medications, remedies, and medical devices. When patients or healthcare specialists report adverse events, side effects, or other safety concerns on social media, these tools help healthcare and life sciences companies identify and monitor these issues. Social media analytics offer valuable insights into affected person experiences, opinions, and alternatives. By reading social media statistics, healthcare companies can understand the sentiments of patients, get feedback on procedures or services, and identify areas for improvement, ultimately improving patient engagement and satisfaction.
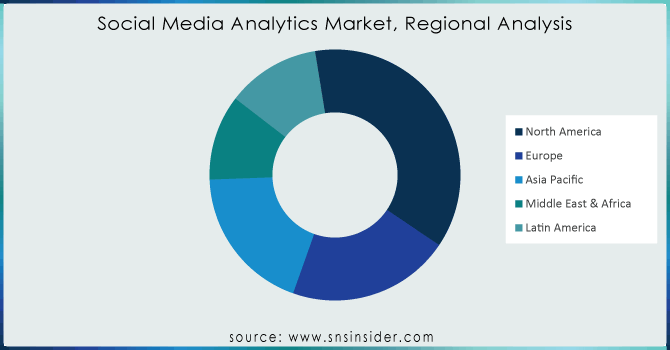
REGIONAL ANALYSIS:
The largest revenue share of more than 34% in 2023 was held by the North America region. Businesses in North America are increasingly seeking real-time social media analytics to update with the latest trends, identify consumer sentiments, and address emerging issues. Due to the developing regulations concerning privacy like GDPR and CCPA, there could be increased attention on ensuring data security and compliance in social media analytics. Businesses in North America are investing in solutions that abide by stringent privacy regulations to guarantee strong information security. In the USA, the social media analytics market is developing significantly due to the high penetration of social media platforms. According to an SNS survey, approximately 71.6% of U.S. Adults use at least one social media website, driving the demand for technologically advanced analytics tools. Businesses leverage these tools for huge amounts of data generated on various social media platforms such as Facebook, Twitter, Instagram, and LinkedIn, aiming to gain insights into behaviour of customers, sentiment, and trends of the market.
In the Asia Pacific, social media platforms have a massive and growing consumer base. Social media analytics offer insights into client behavior, sentiment, and market traits, assisting corporations make knowledgeable decisions. This trend is accelerating the adoption of social media analytics solutions throughout diverse sectors in the location.
REGIONAL COVERAGE:
North America
-
US
-
Canada
-
Mexico
Europe
-
Eastern Europe
-
Poland
-
Romania
-
Hungary
-
Turkey
-
Rest of Eastern Europe
-
-
Western Europe
-
Germany
-
France
-
UK
-
Italy
-
Spain
-
Netherlands
-
Switzerland
-
Austria
-
Rest of Western Europe
-
Asia Pacific
-
China
-
India
-
Japan
-
South Korea
-
Vietnam
-
Singapore
-
Australia
-
Rest of Asia Pacific
Middle East & Africa
-
Middle East
-
UAE
-
Egypt
-
Saudi Arabia
-
Qatar
-
Rest of Middle East
-
-
Africa
-
Nigeria
-
South Africa
-
Rest of Africa
-
Latin America
-
Brazil
-
Argentina
-
Colombia
-
Rest of Latin America
KEY PLAYERS:
The major key players are SAS Institute, Salesforce.com, GoodData, HootSuite Media, Tableau Software, IBM Corporation, Oracle Corporation, Adobe Systems, SAP SE, NetBase Solutions, SocialPilot, Agorapulse, Keyhole, Sendible, Buffer, Hubspot, Databox, Tailwind, Semrush, Awario, Oktopost, Simplify360, Frrole, Mavsocial, Heuritech, Mnemonic Ai, Lucidya, and others in final report
Recent Developments:
-
Sprinklr introduced its advanced AI-powered social media analytics platform in January 2024. This updated system provides instant data processing, improved sentiment analysis, and predictive analytics, enabling companies to better understand customer actions and enhance their social media tactics. The launch has established Sprinklr as a top player in the quickly changing social media analytics industry.
-
Tweet Binder, a Twitter analytics tool, was acquired by Audience, a leading audience intelligence platform In May 2023. This combination joins products and services that work well together, allowing both businesses to grow their offerings and strengthen their presence in the Twitter analytics industry.
-
TikTok expanded its marketing partnership programme in May 2022, introducing its first group of content marketing partners. The founding member is Brandwatch, and its social suite of the future, which would allow its customers to scale, manage, execute, and optimize the content on TikTok, all while staying within the Brandwatch platform. The official partnership of the BrandWatch and TikTok will allow their clients to take care of, understand, and react to their social profiles.
-
March 2022: Paladin, a complete influencer marketing platform, has been purchased by Brandwatch. Brandwatch has enabled full influencer marketing functionality to be implemented in its suite of products with this acquisition. In addition, it enables brands to connect with consumers in an appropriate way. Paladin's platform offers campaign management, influencer discovery and reporting across the world's most popular social media platforms.
-
April 2022: In order to provide the necessary tools for the successful growth of social media, Digimind and Facelift have entered into a partnership. Facelift is a company that provides social media management tools. Both companies have been able to monitor their brand image and centrally manage all social networks thanks to the partnership. It's helping to make business decisions and take real action.
| Report Attributes | Details |
| Market Size in 2023 |
US$ 8.08 Bn |
| Market Size by 2032 |
US$ 61.52 Bn |
| CAGR |
CAGR of 25.3 % From 2024 to 2032 |
| Base Year |
2023 |
| Forecast Period |
2024-2032 |
| Historical Data |
2020-2022 |
| Report Scope & Coverage |
Market Size, Segments Analysis, Competitive Landscape, Regional Analysis, DROC & SWOT Analysis, Forecast Outlook |
| Key Segments |
• By Component (Software, Services) |
| Regional Analysis/Coverage | North America (US, Canada, Mexico), Europe (Eastern Europe [Poland, Romania, Hungary, Turkey, Rest of Eastern Europe] Western Europe] Germany, France, UK, Italy, Spain, Netherlands, Switzerland, Austria, Rest of Western Europe]), Asia Pacific (China, India, Japan, South Korea, Vietnam, Singapore, Australia, Rest of Asia Pacific), Middle East & Africa (Middle East [UAE, Egypt, Saudi Arabia, Qatar, Rest of Middle East], Africa [Nigeria, South Africa, Rest of Africa], Latin America (Brazil, Argentina, Colombia, Rest of Latin America) |
| Company Profiles |
SAS Institute, Salesforce.com, GoodData, HootSuite Media, Tableau Software, IBM Corporation, Oracle Corporation, Adobe Systems, SAP SE, NetBase Solutions |
| Key Drivers |
• An increasing number of people are using social media |
| Market Challenges |
• There are no standard metrics for social media analytics |
Frequently Asked Questions
Ans: The risk management and fraud detection application segment Denominated the Social Media Analytics Market.
Ans: The CAGR of the Social Media Analytics Market is 25.3% During the forecast period of 2024-2032.
Ans: The Asia Pacific region is expected to grow with the highest CAGR during the forecast period of 2024-2032.
Ans: The media and entertainment segment dominated the Social Media Analytics Market.
Ans. The projected market size for the Social Media Analytics Market is USD 61.52 billion by 2032.
Get in Touch
