8K Technology Market Report Scope & Overview:
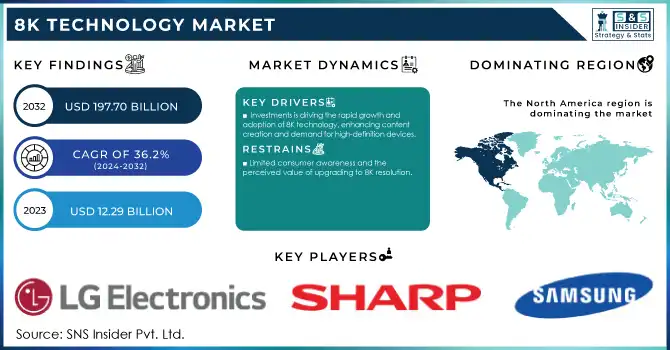
The 8K technology Market size was valued at USD 12.29 billion in 2023 and is expected to grow to USD 197.70 billion by 2032 and grow at a CAGR Of 36.2% over the forecast period of 2024-2032.
Get more information on 8K Technology Market - Request Sample Report
The 8K technology market is experiencing rapid growth, driven by the increasing demand for high-resolution displays, advanced imaging solutions, and cutting-edge consumer electronics. As industries and consumers seek ultra-high-definition visual experiences, the market for 8K televisions, monitors, and projectors is expanding significantly. The growing adoption of smart home technologies, connected devices, and premium products is also contributing to this surge. Major players like Samsung, LG, TCL, and Sharp are leading the charge in developing advanced 8K display solutions, introducing products like LG's Z3 series OLED 8K TVs and Samsung's Neural Quantum Processor 8K for enhanced viewing experiences. Furthermore, technological advancements in 8K camera capabilities, such as Samsung’s 200-megapixel ISOCELL HP2 sensor, are improving content creation, enabling 8K video recording with high-quality results. In parallel, innovations in data transfer technologies, like USB-C hybrid docks and the deployment of 5G networks, are ensuring smooth transmission of 8K content, particularly in live broadcasting and streaming. With continued improvements in camera and data processing technology, the 8K market is expected to see further growth as 8K content becomes more accessible across various industries, including entertainment, gaming, and broadcasting.
Market Dynamics
Drivers
-
Investments is driving the rapid growth and adoption of 8K technology, enhancing content creation and demand for high-definition devices.
Media companies and broadcasters are significantly ramping up their efforts to create and deliver 8K content, which is pushing the demand for 8K-ready devices and advanced broadcasting infrastructure. As audiences demand higher-quality visual experiences, major broadcasters are adopting 8K resolution to enhance their offerings, including live sports events, documentaries, and premium entertainment content. For instance, several broadcasting networks have already conducted successful 8K live broadcasts, including the Tokyo 2020 Olympics, demonstrating the capabilities and potential of 8K in the media landscape. To meet the rising need for 8K content production, companies are investing heavily in state-of-the-art cameras, post-production equipment, and distribution platforms. In parallel, broadcasters are upgrading their transmission technologies to handle the massive data demands of 8K content, with high-speed internet infrastructure like 5G networks and fiber-optic cables playing a crucial role in facilitating the seamless delivery of ultra-high-definition videos to consumers. This investment surge has led to the proliferation of 8K-enabled TVs, displays, and projectors, further expanding the market for 8K technology. With the growing accessibility of 8K content, consumers are increasingly seeking compatible devices, resulting in a significant rise in demand for 8K televisions, monitors, and streaming services that support ultra-high-definition viewing. As media companies continue to prioritize next-generation broadcasting technologies and innovate in content creation, the 8K technology market is set to experience sustained growth, driven by both consumer demand and the ongoing transformation within the media and entertainment sectors
Restraints
-
Limited consumer awareness and the perceived value of upgrading to 8K resolution.
Many consumers may not see a clear benefit in switching to 8K, especially when the visual difference between 4K and 8K can be hard to detect on smaller screens or in typical viewing environments. This is particularly true for displays under 85 inches, where the enhanced clarity and resolution offered by 8K are less noticeable. According to a report by the 8K Association, despite the excitement within the industry, many consumers are still uncertain about the need for 8K, which has slowed the adoption rate of 8K-ready devices. The growing availability of 4K content and 4K-enabled devices at more affordable prices further discourages consumers from upgrading. Additionally, in many regions, such as North America and Europe, 4K is still perceived as the premium standard, and 8K is seen as unnecessary by the average consumer. In fact, research indicates that the demand for 8K displays remains niche, with 8K TV sales accounting for less than 1% of global TV sales in 2023. Consumers in these markets may be reluctant to invest in 8K because they do not perceive it as adding substantial value to their viewing experience. Furthermore, the lack of readily available 8K content limits the utility of 8K displays, as most streaming services and media are not yet optimized for 8K resolution. The high cost of 8K TVs, which can exceed USD 5,000 for premium models, also deters consumers from making the leap to 8K. Unless consumer education is improved and content for 8K becomes more widely available, the perceived value of 8K technology will likely remain a significant barrier to its broader adoption.
Segment Analysis
By Product
The television segment held the dominant share of around 52% in the 8K technology market in 2023. This is primarily driven by the increasing consumer demand for larger, higher-resolution displays for home entertainment. As 8K TVs offer unparalleled picture quality, superior color accuracy, and enhanced viewing experiences, they have become a major focus for key players like Samsung, LG, and Sony. With advancements in OLED and QLED technologies, these manufacturers have launched premium models equipped with 8K resolution, targeting tech-savvy consumers and early adopters. Furthermore, the growing availability of 8K content, supported by platforms such as Netflix and YouTube, is fueling the demand. As the prices of 8K televisions continue to decrease, wider adoption is expected, further solidifying the segment’s market leadership.
By End User
In 2023, the sports and entertainment industry segment dominated the 8K technology market, accounting for approximately 54% of the total market share. The demand for 8K technology in this sector is driven by the pursuit of enhanced viewing experiences, particularly for live sports broadcasts, movies, and concerts. 8K resolution offers a significant leap in clarity and realism, which is highly valued by both content creators and consumers for immersive experiences. Major broadcasters, sports organizations, and streaming platforms are increasingly adopting 8K technology to meet consumer expectations and stay competitive. The integration of 8K cameras and high-resolution displays in sports arenas and entertainment venues further accelerates the adoption of this technology.
Regional Analysis
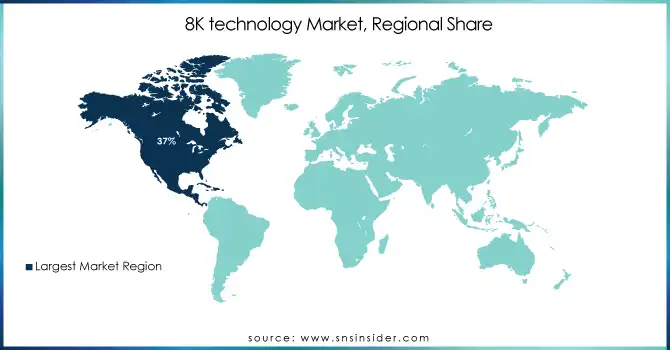
In 2023, North America emerged as the dominant region in the 8K technology market, holding a significant share of approximately 37%. The region’s leadership is driven by the high demand for advanced consumer electronics, particularly 8K televisions and displays, fueled by increasing disposable incomes and a tech-savvy consumer base. Additionally, North America is home to several leading technology companies, such as LG Electronics, Samsung, and Sony, which are heavily investing in 8K resolution development and content creation. The region’s strong media and broadcasting industry further boosts the adoption of 8K technology, with major networks and streaming platforms pushing for high-definition content. Moreover, the growing trend of smart home integration and the adoption of high-resolution displays in various sectors, such as healthcare and entertainment, contribute to North America’s dominance in the 8K technology market.
The Asia-Pacific region is set to experience the fastest growth in the 8K technology market from 2024 to 2032. Key players in countries like Japan, South Korea, and China are driving this growth through technological advancements, strong consumer demand, and government initiatives. Japan, a leader in broadcast technology, is pioneering 8K content creation and transmission, while South Korea's major brands, such as Samsung and LG, and are leading in 8K display production. China’s growing middle class and increasing disposable income are fueling demand for high-end consumer electronics. The expansion of 5G networks and the rising popularity of high-definition content in gaming and entertainment are boosting market growth. With rapid technological adoption and robust industry support, the Asia-Pacific region is positioned to lead the 8K technology market in the coming years.
Need any customization research on 8K Technology Market - Enquiry Now
Key Players
Some of the major Players in 8K Technology Market with product:
-
AUO Corporation (8K Displays, LCD Panels)
-
BOE Technology Group Co. Ltd. (8K Displays, OLED Panels)
-
Canon Inc. (8K Cameras, Imaging Solutions)
-
Dell Technologies (8K Monitors, Workstations)
-
Digital Projection (8K Projectors)
-
JVCKENWOOD Corporation (8K Camcorders, Professional Audio/Video Equipment)
-
LG Electronics (8K OLED Televisions, 8K Displays)
-
Panasonic Holdings Corporation (8K Cameras, 8K Displays)
-
RED Digital Cinema LLC (8K Cameras, Digital Cinema Cameras)
-
Samsung Electronics Co. Ltd. (8K QLED Televisions, Displays)
-
Sharp Corporation (8K LCD Displays, 8K Monitors)
-
Sony Group Corporation (8K TVs, 8K Cameras, Imaging Solutions)
-
TCL Electronics (8K QLED Televisions, 8K Displays)
-
Vizio Inc. (8K LED Televisions, 8K Displays)
-
Hisense (8K ULED Televisions, 8K Displays)
-
Skyworth (8K LED Televisions, 8K Displays)
-
Eizo Corporation (8K Monitors, Professional Displays)
-
BenQ Corporation (8K Projectors, 8K Monitors)
-
ViewSonic Corporation (8K Monitors, 8K Displays)
-
Christie Digital Systems (8K Projectors, Visualization Solutions)
List of Suppliers who provide raw material and component
-
Corning Inc.
-
Samsung SDI
-
LG Chem
-
Sharp Materials
-
3M
-
BOE Technology Group Co. Ltd.
-
Merck Group
-
Taiwan Semiconductor Manufacturing Company (TSMC)
-
Samsung Electro-Mechanics
-
Nitto Denko
Recent Development
-
August 2024: AUO Display Plus has received internal approval to acquire Avocor Technologies USA, Inc. The acquisition aims to enhance product development and expand the smart education and enterprise sectors, with Avocor CEO Scott Hix joining AUO as GM of the Education and Enterprise Business Group and CMO of ADP.
-
July 2024: Canon India unveils the EOS R1 and EOS R5 Mark II, introducing advanced features like 8K 60p RAW video recording and improved autofocus systems. The EOS R1 targets action photographers, while the EOS R5 Mark II elevates versatility for both photo and video professionals with groundbreaking sensor and performance upgrades.
-
June 2024: Sony Semiconductor Solutions announces the release of the IMX901, an 8K horizontal resolution global shutter CMOS image sensor. Designed for C-mount lenses, it offers high image quality, high-speed performance, and wide-field imaging for industrial applications, including barcode reading and machine vision inspections.
| Report Attributes | Details |
| Market Size in 2023 | USD 12.29 Billion |
| Market Size by 2032 | USD 197.70 Billion |
| CAGR | CAGR of 36.2% From 2024 to 2032 |
| Base Year | 2023 |
| Forecast Period | 2024-2032 |
| Historical Data | 2020-2022 |
| Report Scope & Coverage | Market Size, Segments Analysis, Competitive Landscape, Regional Analysis, DROC & SWOT Analysis, Forecast Outlook |
| Key Segments | • By Product (Television, Professional camera, Monitor and notebook, Projector) • By End User (Consumers, Sports, and entertainment industry, Medical industry, Other industries (retail, hospitality, defense, education, and corporate industries) |
| Regional Analysis/Coverage | North America (US, Canada, Mexico), Europe (Eastern Europe [Poland, Romania, Hungary, Turkey, Rest of Eastern Europe] Western Europe] Germany, France, UK, Italy, Spain, Netherlands, Switzerland, Austria, Rest of Western Europe]), Asia Pacific (China, India, Japan, South Korea, Vietnam, Singapore, Australia, Rest of Asia Pacific), Middle East & Africa (Middle East [UAE, Egypt, Saudi Arabia, Qatar, Rest of Middle East], Africa [Nigeria, South Africa, Rest of Africa], Latin America (Brazil, Argentina, Colombia, Rest of Latin America) |
| Company Profiles | AUO Corporation, BOE Technology Group Co. Ltd., Canon Inc., Dell Technologies, Digital Projection, JVCKENWOOD Corporation, LG Electronics, Panasonic Holdings Corporation, RED Digital Cinema LLC, Samsung Electronics Co. Ltd., Sharp Corporation, Sony Group Corporation, TCL Electronics, Vizio Inc., Hisense, Skyworth, Eizo Corporation, BenQ Corporation, ViewSonic Corporation, and Christie Digital Systems are key players in the 8K technology market. |
| Key Drivers | • Investments is driving the rapid growth and adoption of 8K technology, enhancing content creation and demand for high-definition devices. |
| Restraints | • Limited consumer awareness and the perceived value of upgrading to 8K resolution. |
Frequently Asked Questions
Ans: Rising global demand for large-screen TVs and displays with greater resolutions. And The biggest demand in the television segment.
Ans: 8K Technology Market size was valued at USD 12.29 billion in 2023
Ans: USD 197.70 billion is expected to grow by 2032.
Ans: 8K Technology Market is anticipated to expand by 36.2% from 2024 to 2032.
Get in Touch
