Photonics Market Size
Get More Information on Photonics Market - Request Sample Report
Photonics Market Overview:
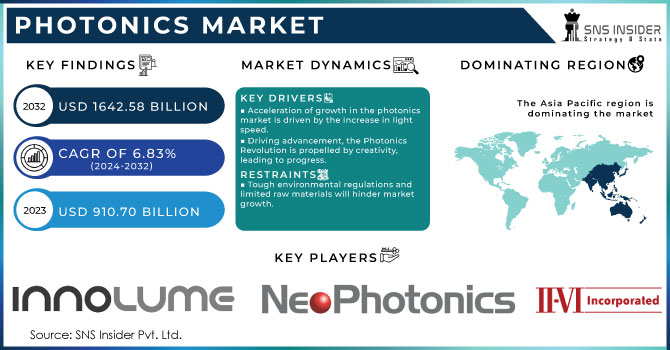
The Photonics Market size was USD 910.70 billion in 2023 to USD 1642.58 billion by 2032 and grow at a CAGR of 6.83% over the forecast period of 2024-2032.
Driven by the need of consumers for innovative products and progress in different industries. The demand for effective light-based solutions is increasing, from LiDAR in autonomous vehicles to high-resolution displays and medical advancements in bio photonics. This request is also heightened by the growing requirement for quicker data transfer in telecommunications systems. Innovation is not only meeting demand but also propelling it forward. Ongoing advancements in key photonic elements such as lasers and sensors are resulting in new and more efficient uses. Governments around the globe are realizing the potential and are making strategic investments in research and development, which is leading to a significant merging of market forces and technological progress.
VIGO Photonics, a leading company in infrared detector technology, is well placed to take advantage of this expansion. Their dedication is shown through their recent entrance into the North American market, with an emphasis on security & defense, gas sensing, and scientific instrumentation. VIGO Photonics plans to enhance their US team by bringing in expert engineers in order to offer advanced detectors and aid customers in incorporating them into innovative technologies. This growth allows VIGO Photonics to become a major influencer in shaping the upcoming advancements in light-based technology, advancements spurred by innovation and driven by market needs.
There are changes happening in the photonics industry, especially in relation to spectrometers. A variety of factors are converging to lead to a rise in demand. Spectrometers are increasingly important in multiple sectors, being used in healthcare to diagnose diseases and in material science to guarantee product quality. This technology is currently being utilized for environmental surveillance as well. Manufacturers are focusing on and integrating spectrometers into their high-volume production lines. To meet growing demand and uphold quality standards, Avantes is launching a cutting-edge system called AvaMation. Switching from manual assembly to automation is a strategic choice that allows them to capitalize on the opportunity and deliver the high-quality, dependable spectrometers that manufacturers require. For instance, they are now using robotic arms to streamline production processes.
| Report Attributes | Details |
|---|---|
| Key Segments | • By Type (LED, Optical Communication System And Components, Lasers, Detectors, Sensors And Imaging Devices, Consume Electronics And Device) • By Application (Lighting Displays , Photovoltaic, Medical Technology And Life Sciences [Bio Photonics] Production Technology, Measurement And Automated Vision , Information And Communication Technology) • By End Use Industry (Building And Construction , Safety And Defence, Medical, Media Broadcasting And Telecommunications, Industrial) |
| Regional Coverage | North America (US, Canada, Mexico), Europe (Eastern Europe [Poland, Romania, Hungary, Turkey, Rest of Eastern Europe] Western Europe] Germany, France, UK, Italy, Spain, Netherlands, Switzerland, Austria, Rest of Western Europe]), Asia Pacific (China, India, Japan, South Korea, Vietnam, Singapore, Australia, Rest of Asia Pacific), Middle East & Africa (Middle East [UAE, Egypt, Saudi Arabia, Qatar, Rest of Middle East], Africa [Nigeria, South Africa, Rest of Africa], Latin America (Brazil, Argentina, Colombia, Rest of Latin America) |
| Company Profiles | Innolume, Neophotnics Corporation, IPG Photonics Corporation, II - VI Incorporated, Hamamatsu Photonics K.K, Molex, TRUMPF, Sicoya GMBH, One Silicone chip photonics Inc, RANOVUS |
MARKET DYNAMICS
Drivers
-
Acceleration of growth in the photonics market is driven by the increase in light speed.
The photonics industry is seeing a rise due to a combination of strong trends. There is a rapid increase in consumer interest for cutting-edge items such as self-driving cars powered by LiDAR and high-definition displays. Bio photonics breakthroughs are transforming diagnostics and treatments in the healthcare field. Telecommunication networks need faster and more efficient data transmission, relying greatly on photonics technology. Market-driven growth is being complemented by ongoing advancements in core photonic elements such as lasers and sensors, expanding the possibilities and paving the way for innovative new uses. Global governments are strategically investing in research and development to accelerate innovation, acknowledging the potential economic and technological advancements. Due to the combination of these factors, the photonics industry is ready for an incredible evolution, paving the way for a future filled with light-centric innovations.
-
Driving advancement, the Photonics Revolution is propelled by creativity, leading to progress.
The field of photonics is experiencing a significant change, propelled by continuous progress in essential parts such as lasers and sensors. These are not just minor adjustments they are advancements that push the limits of what is possible and spark a wave of innovative uses. Picture medical treatments utilizing highly precise lasers, or environmental sensors capable of detecting even the most subtle changes on Earth. This is not a vision of the future; it is the emerging reality influenced by the advancements in photonics. The advantages go far beyond just the thrill of new uses. These developments are also causing an increase in productivity. Consider using less energy and utilizing light more efficiently for its intended use, which is making photonics a more sustainable technology. For instance, improved lasers can lead to more streamlined and quicker data transfer in communication networks. A chain reaction occurs when a breakthrough in a certain area generates a series of positive effects throughout the entire field of photonics.
Restraints
-
Tough environmental regulations and limited raw materials will hinder market growth.
The photonics sector, advocating for sustainable light-based solutions, encounters an unexpected obstacle in the form of environmental regulations. While the majority of products are naturally environmentally friendly, others depend on performance-boosting chemicals that are considered dangerous according to regulations such as REACH and RoHS. These constraints, although essential for environmental protection, restrict material options and may increase development expenses. Discovering sustainable alternatives that satisfy performance and regulatory standards is essential for the photonics sector to navigate the green paradox and sustain its environmentally-friendly trajectory.
-
The high expenses related to advancement are obstructing the broad use of photonics technology.
Getting more widely accepted in the photonics industry is challenged by the substantial barrier of expensive initial investments. Creating and implementing these advanced technologies frequently demands a substantial initial financial investment. This serves as an obstacle for smaller firms and initiatives operating on a tight budget. This not only impacts specific projects, but also the overall rate at which this technology with transformative potential is adopted. Coming up with innovative financing models or using modular component designs is essential to fully utilize the potential of photonics and make it accessible to all, not just the wealthy.
KEY MARKET SEGMENTS
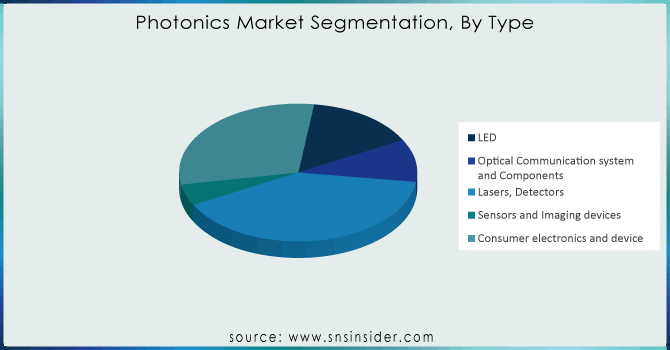
By Type
By Type, Laser, Detectors segment is the dominating segment with 40% of market in 2023. Lasers are the power sources in the field of photonics. Advancements have resulted in highly precise and controlled concentrated beams of light being generated. This includes a wide range of uses, such as industrial material processing, cutting, medical procedures, and high-speed data transmission in fiber optic networks. The impact of lasers is undeniable, from sculpting metals in car manufacturing to performing intricate eye surgeries. Detectors, serve as the vigilant observers of photonics. They change light signals into electrical signals, enabling us to perceive and understand the light in our surroundings. These sensors vary from the highly sensitive ones utilized in astronomical telescopes to the common photodiodes present in smoke detectors and smartphone cameras. They have a crucial function in a wide range of applications, including environmental monitoring, chemical analysis, security systems, and self-driving cars.
Get Customized Report as per Your Business Requirement - Request For Customized Report
By Application
In 2023, the photonics market was primarily driven by Information and communication technology, which accounted for 35% of the market share in terms of application. This highlight underscores the crucial significance of light technologies in our increasingly interconnected world. The fundamental nature of data transmission. These cables utilizing photonics enable fast data transmission across extensive distances. The reliance of ICT on photonics goes far beyond just the internet. Lasers are used to fabricate intricate components in smartphones and computers, while detectors allow cameras to capture and store our memories. The impact extends past consumer gadgets. Photonics plays a vital role in the functioning of data centers, ensuring the smooth running of cloud computing and internet services. Advanced sensors using photonics technology enable real-time monitoring of communication networks, facilitating swift issue resolution and ensuring continuous connectivity. Besides the Internet, photonics plays a significant role in ICT that extends beyond just internet usage. Lumentum Holdings Inc. is a well-known company in the photonics industry that creates lasers for producing complex parts in smartphones and computers. Teledyne FLIR LLC (FLIR), yet another significant company, provides detector technology that enables the cameras to capture our memories on these devices.
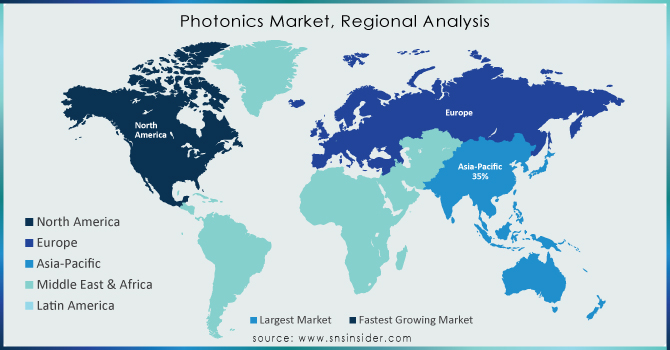
REGIONAL ANALYSIS
The Asia Pacific region dominated the Photonics market in 2023, with a market share of 35%. The Asia Pacific market is poised for rapid growth due to its early adoption of technology and increasing emphasis on research and development. China has emerged as a major contributor to photonics innovation, with leading companies establishing manufacturing plants and a robust supply network. China is expected to dominate a significant share of the photonics market because of its robust market presence and export capabilities. China, as the dominant force in photonics in the Asia Pacific region, is at the forefront of the global market due to its emphasis on innovation and strong manufacturing capabilities. Ever light Electronics (EVERLIGHT) is at the forefront, being a major player in the LED and optoelectronic components industry for a wide range of applications, from consumer electronics to industrial automation. Han's Laser Technology specializes in high-power lasers designed for industrial use, standing out in the market. Huawei, a significant player in both telecommunications and photonics research and development, is also a major player in manufacturing components and improving fiber optic technology. BGI Genomics (BGI) demonstrates the transformation of healthcare through the use of photonics in DNA sequencing tools. There are only a handful of shining examples; China's dynamic photonics ecosystem supports many innovative companies. China's solid domestic manufacturing sector and growing ability to export will undoubtedly ensure its continued dominance in the global photonics market.
The growth of photonics in advancing next-generation integrated electronics is expected to fuel market growth in the area. The presence of tech giants like Facebook and Microsoft in North America will drive market growth of 25% in market share in 2023, as they require efficient data processing and transmission for their large data center networks. Photonics technologies provide important improvements in rapid data processing and communication, essential elements of contemporary computer systems. Moreover, photon-based quantum computers have an advantage over electron-based ones as they can function at ambient temperatures instead of needing colder environments.
Key Players
Some of the major key players in the Photonics Market are Innolume, Neophotnics Corporation, IPG Photonics Corporation, II - VI Incorporated, Hamamatsu Photonics K.K, Molex, TRUMPF, Sicoya GMBH, One Silicone chip photonics Inc, RANOVUS and other players.
RECENT DEVELOPMENT
- In March 2024, VLC Photonics, a division of the Hitachi group, teamed up to provide design and testing services utilizing the OpenLight process design kit (PDK) for creating photonic integrated circuits (PICs). This has increased the range of designs that OpenLight can accommodate for the Tower Semiconductor PH18DA process, leading to progress in different applications and market sectors within the silicon photonics industry.
- In October 2023, Governor Greg Gianforte of Montana stressed the significance of Taiwan as a crucial partner in enhancing Montana's photonics industry during his meeting with President Tsai Ing-wen. Montana is home to numerous optics, photonics, and quantum computing businesses. Gianforte emphasized the urgent need to develop the photonics sector in Montana, due to the projected international expansion to nearly USD 2 trillion by 2025. He recognized Taiwan's capability in this area as a valuable resource. Through collaborating with Taiwan, Montana can speed up the expansion of its photonics sector, leading to the creation of fresh prospects and boosting economic development.
- In July 2023, Celestial AI secured $100 million for its Photonic Fabric technology platform through a series B funding round. IAG Capital Partners, Koch Disruptive Technologies, and Temasek's Xora Innovation fund spearheaded the round, joined by Samsung Catalyst, Smart Global Holdings, Porsche Automobil Holding SE, The Engine Fund, ImecXpand, and M Ventures. The funding will allow Celestial AI to speed up the creation and marketing of its platform, which provides a distinct and attractive solution for quick, low-delay data transmission and processing.
| Report Attributes | Details |
| Market Size in 2023 | US$ 910.70 Billion |
| Market Size by 2032 | US$ 1642.58 Billion |
| CAGR | CAGR of 6.83% From 2024 to 2032 |
| Base Year | 2023 |
| Forecast Period | 2024-2032 |
| Historical Data | 2020-2022 |
| Report Scope & Coverage | Market Size, Segments Analysis, Competitive Landscape, Regional Analysis, DROC & SWOT Analysis, Forecast Outlook |
| Key Drivers |
|
| Market Restraints |
|
Get in Touch
