To Get More Information on LED Modular Display Market - Request Sample Report
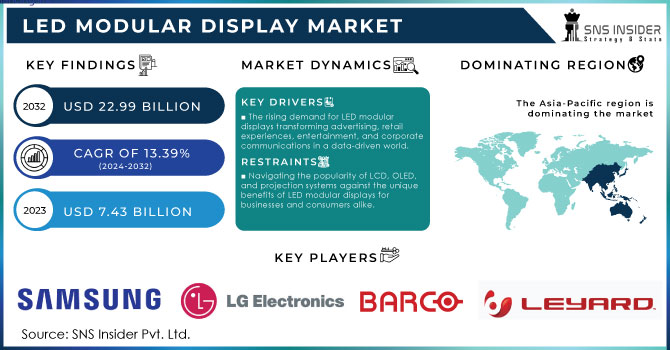
The LED Modular Display Market was valued at USD 7.43 Billion in 2023 and is expected to reach USD 22.99 Billion by 2032, growing at a CAGR of 13.39% over the forecast period 2024-2032.
The LED modular display market has witnessed remarkable growth in recent years, driven by advancements in technology and an increasing demand for high-quality visual displays across various industries. One of the primary factors contributing to the expansion of the LED modular display market is the surge in digital advertising and digital signage. Digital signage has become a powerful communication tool, with 70% of Americans reporting they've seen a digital display at least occasionally. Notably, 47% recall specific ads or messages, with this figure rising to 55% for outdoor digital billboards. Furthermore, 80% of shoppers have entered stores due to interest piqued by digital signs. This high visibility translates to effectiveness, as 90% of information transmitted to the brain is visual, with 30% of the brain's cortex dedicated to processing visual information. People can remember over 2,000 images with 90% accuracy for several days while retaining only 20% of written or spoken information after three days.
Technological advancements, such as the development of energy-efficient LED modules and improved image quality, are further propelling the growth of the LED modular display market. Manufacturers are continually innovating to provide displays with higher resolution, better color accuracy, and increased durability, catering to the diverse needs of end-users. The rise of smart technologies, including the integration of IoT capabilities, allows for remote monitoring and control of LED displays, adding to their appeal in various applications like retail, hospitality, entertainment, and corporate environments. The growing trend of digital transformation and the adoption of interactive display solutions are further boosting the market, with applications in outdoor advertising, sports arenas, transportation hubs, and smart cities. As demand for customizable LED modular displays grows, the market is expected to experience sustained growth, driven by innovations in LED technology, increasing investment in smart infrastructure, and the growing importance of visual communication in the digital age.
Drivers
Top-notch visual presentations are crucial for grabbing audience interest in a world overflowing with data. LED modular displays provide better brightness, color accuracy, and clarity in contrast to conventional display technologies. This quality makes them very appealing for advertising, as vivid images can greatly improve brand recognition and message recall. LED displays are more commonly utilized in retail to display products in an engaging and eye-catching manner. Companies can use these screens to develop engaging shopping experiences that increase customer interaction and drive sales. Likewise, LED screens play a crucial role in the entertainment industry by improving audience experience at concerts, sports events, and live performances with captivating visuals and up-to-date information. The business industry is also moving towards utilizing LED screens for presenting information and internal messaging. With the increase in remote work, companies are purchasing top-notch displays to enhance virtual meetings and collaborations. The demand for advanced display technologies, driven by the requirement for professional-grade presentations and visual aids, is boosting the growth of the LED modular display market.
Digital signage, as opposed to static signage, allows for content that is dynamic and can be quickly updated and personalized in real-time. This adaptability allows companies to promptly adapt to shifting market conditions and customer preferences. LED modular displays are commonly utilized in industries like retail, hospitality, and transportation for advertising, promotions, and sharing information. Retailers can display products, advertise sales, and share brand narratives with captivating visuals that capture the interest of customers. Within the hospitality industry, digital signage improves guest experiences by presenting engaging information about services, events, and promotions. Transportation centers, like airports and train stations, utilize digital signage to give current information on schedules, directions, and safety details. Utilizing LED displays in such settings guarantees visibility and clarity, even in difficult lighting conditions.
Restraints
LCDs are often more affordable than LED displays, making them attractive options for businesses with budget constraints. On the other hand, OLED displays offer exceptional color reproduction and contrast ratios, appealing to high-end consumers and businesses. Furthermore, projection systems remain a viable alternative for larger display needs, especially in environments where space is limited. Projectors can deliver impressive visuals at a lower cost, providing a cost-effective solution for presentations and events. As a result, LED modular displays must compete not only on quality but also on pricing and application suitability. This competition can limit market growth, particularly in price-sensitive segments where organizations prioritize cost over quality. To address this challenge, LED manufacturers need to emphasize the unique benefits of their products, such as superior brightness, durability, and versatility. Developing innovative applications and enhancing energy efficiency can also help differentiate LED displays from competitors, creating a stronger value proposition for potential buyers.
By Type
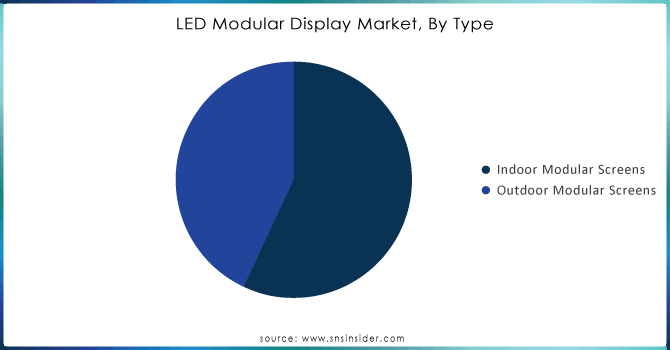
Indoor modular screens led the market in 2023 with a 59% market share. These displays are specially created for use in different indoor locations, such as malls, offices, airports, and entertainment sites. Their excellent clarity and luminosity improve visibility and interaction, making them perfect for advertising, presentations, and interactive displays. The flexible configurations of the modular design make it easy to cater to various spatial requirements during installation. Companies like Samsung and LG have effectively integrated indoor modular screens into their commercial offerings, delivering vivid displays for retail spaces and events.
Outdoor modular screens are expected to register the fastest CAGR during 2024-2032. These screens are commonly utilized for billboards, sports arenas, concerts, and public events, as they are created to endure different weather conditions. Advertisers and event organizers find them appealing due to their strong resilience and intense luminosity, ensuring visibility even in the glare of the sun. The increased focus on outdoor advertising and timely information sharing has led to a higher demand for outdoor modular screens. For instance, Daktronics and Absen are examples of firms that offer state-of-the-art outdoor modular display solutions, enabling easy integration into different settings.
Do You Need any Customization Research on LED Modular Display Market - Inquire Now
Asia-Pacific led the market regionally in 2023 with a 36% market share, due to its strong manufacturing abilities, fast urban growth, and rising need for digital signage solutions. Nations such as China, Japan, and India are leading the way, making significant investments in technology and infrastructure. Major companies like Sony and Panasonic are actively investing in LED technology to offer cutting-edge solutions for both indoor and outdoor applications. For instance, Leyard has established a strong presence in the region by providing high-performance LED displays for large-scale events and exhibitions. The area's increasing focus on events, concerts, and advertising strategies strengthens its market leadership, as ongoing innovations in LED technology maintain a dynamic and competitive environment.
North America is expected to register a rapid growth rate due to the rising use of advanced display technologies in retail, advertising, and events. The increasing need for high-quality screens for ads and sharing information in cities has sped up market expansion. Leading companies such as Samsung and LG Electronics are consistently improving their product lineup to improve screen quality and energy efficiency. Examples of usage range from digital billboards in Times Square to interactive displays in retail settings, and even large-scale video walls for corporate events.
The major key players in the LED Modular Display Market are:
Samsung Electronics (Samsung IF Series, Samsung QLED Signage)
LG Electronics (LG MAGNIT, LG Transparent OLED)
Sony Corporation (Sony Crystal LED, Sony BRAVIA Professional Displays)
Barco (Barco LED displays, Barco UniSee)
Christie Digital Systems (Christie Pandoras Box, Christie MicroTiles)
Daktronics (Daktronics Tickers, Daktronics LED Video Displays)
Leyard (Leyard TVH Series, Leyard CarbonLight Series)
Unilumin (Unilumin Upanel, Unilumin LED Video Wall)
Absen (Absen A2720, Absen PL Series)
Planar Systems (Planar UltraRes X, Planar TVF Series)
Sharp NEC Display Solutions (NEC LED Display, NEC MultiSync)
VTRON Technologies (VTRON LED Display, VTRON R&D Solutions)
BenQ (BenQ LU951, BenQ ST100)
Mitsubishi Electric (Mitsubishi Diamond Vision, Mitsubishi LED Video Walls)
ViewSonic (ViewSonic LD Series, ViewSonic IFP Series)
Peerless-AV (Peerless-AV Xtreme™ Outdoor Displays, Peerless-AV Full HD Displays)
Infinito (Infinito Infinity Series, Infinito Performance Series)
AOTO Electronics (AOTO P1.56, AOTO P2.5)
Nanolumens (Nanolumens Aware, Nanolumens Flex Series)
KONKA (KONKA Transparent LED, KONKA Indoor LED Display)
May 2023: Porotech debuted the world's first 0.26-inch active matrix full-color Micro LED on silicon with an array frame at Slide Display Week. Dynamic Pixel Tuning (DPT) technology ensures fast color switching with no RGB color stacking, which is a very innovative display.
March 2024: Samsung details a new version of its Wall All-in-One, a modular MicroLED display. This new device has a better resolution than the old version and is capable of fitting into locations in retail, corporate, or other sites.
January 2024: Leyard introduced its LVP Series LED video wall displays. These are indoor displays with ultra-slim bezels and high brightness. Targeted at control rooms, broadcast studios, and public venues, they offer enhanced viewing experience due to the products' excellent image quality and seamless integration.
February 2023: LG unveiled a new lineup of 4KUHD LED digital signage solutions that are modular and easy to install and maintain. These screens boast brilliant colors and crisp images that make them ideal for a wide array of contexts, from retail to event environments.
Report Attributes | Details |
---|---|
Market Size in 2023 | USD 7.43 Billion |
Market Size by 2032 | USD 22.99 Billion |
CAGR | CAGR of 13.39% From 2024 to 2032 |
Base Year | 2023 |
Forecast Period | 2024-2032 |
Historical Data | 2020-2022 |
Report Scope & Coverage | Market Size, Segments Analysis, Competitive Landscape, Regional Analysis, DROC & SWOT Analysis, Forecast Outlook |
Key Segments | • By Type (Indoor Modular Screens, Outdoor Modular Screens) |
Regional Analysis/Coverage | North America (US, Canada, Mexico), Europe (Eastern Europe [Poland, Romania, Hungary, Turkey, Rest of Eastern Europe] Western Europe] Germany, France, UK, Italy, Spain, Netherlands, Switzerland, Austria, Rest of Western Europe]), Asia Pacific (China, India, Japan, South Korea, Vietnam, Singapore, Australia, Rest of Asia Pacific), Middle East & Africa (Middle East [UAE, Egypt, Saudi Arabia, Qatar, Rest of Middle East], Africa [Nigeria, South Africa, Rest of Africa], Latin America (Brazil, Argentina, Colombia, Rest of Latin America) |
Company Profiles | Samsung Electronics, LG Electronics, Sony Corporation, Barco, Christie Digital Systems, Daktronics, Leyard, Unilumin, Absen, Planar Systems, Sharp NEC Display Solutions, VTRON Technologies, BenQ, Mitsubishi Electric, ViewSonic, Peerless-AV, Infinito, AOTO Electronics, Nanolumens, KONKA. |
Key Drivers | • The rising demand for LED modular displays transforming advertising, retail experiences, entertainment, and corporate communications in a data-driven world. • Transforming marketing and communication through dynamic digital signage in retail, hospitality, and transportation industries. |
RESTRAINTS | • Navigating the popularity of LCD, OLED, and projection systems against the unique benefits of LED modular displays for businesses and consumers alike. |
Ans: The LED Modular Display Market is expected to grow at a CAGR of 13.39% during 2024-2032.
Ans: The LED Modular Display Market was USD 7.43 Billion in 2023 and is expected to Reach USD 22.99 Billion by 2032.
Ans: The rising demand for led modular displays: transforming advertising, retail experiences, entertainment, and corporate communications in a data-driven world.
Ans: The indoor modular screens segment dominated the LED Modular Display Market.
Ans: APAC dominated the LED Modular Display Market in 2023.
Table of Contents
1. Introduction
1.1 Market Definition
1.2 Scope (Inclusion and Exclusions)
1.3 Research Assumptions
2. Executive Summary
2.1 Market Overview
2.2 Regional Synopsis
2.3 Competitive Summary
3. Research Methodology
3.1 Top-Down Approach
3.2 Bottom-up Approach
3.3. Data Validation
3.4 Primary Interviews
4. Market Dynamics Impact Analysis
4.1 Market Driving Factors Analysis
4.1.1 Drivers
4.1.2 Restraints
4.1.3 Opportunities
4.1.4 Challenges
4.2 PESTLE Analysis
4.3 Porter’s Five Forces Model
5. Statistical Insights and Trends Reporting
5.1 Demand and Supply Metrics (2023)
5.2 Pricing Trends, (2023), by Region
5.3 Market Penetration Rates, by Region (2020-2032)
5.4 Environmental Impact Metrics, by Region
6. Competitive Landscape
6.1 List of Major Companies, By Region
6.2 Market Share Analysis, By Region
6.3 Product Benchmarking
6.3.1 Product specifications and features
6.3.2 Pricing
6.4 Strategic Initiatives
6.4.1 Marketing and promotional activities
6.4.2 Distribution and Supply Chain Strategies
6.4.3 Expansion plans and new product launches
6.4.4 Strategic partnerships and collaborations
6.5 Technological Advancements
6.6 Market Positioning and Branding
7. Consumer Genomics Market Segmentation, By Application
7.2 Indoor Modular Screens
7.2.1 Indoor Modular Screens Market Trends Analysis (2020-2032)
7.2.2 Indoor Modular Screens Market Size Estimates and Forecasts to 2032 (USD Million)
7.3 Outdoor Modular Screens
7.3.1 Outdoor Modular Screens Market Trends Analysis (2020-2032)
7.3.2 Outdoor Modular Screens Market Size Estimates and Forecasts to 2032 (USD Million)
8. Regional Analysis
8.1 Chapter Overview
8.2 North America
8.2.1 Trends Analysis
8.2.2 North America Consumer Genomics Market Estimates and Forecasts, by Country (2020-2032) (USD Million)
8.2.3 North America Consumer Genomics Market Estimates and Forecasts, by Application (2020-2032) (USD Million)
8.2.2 USA
8.2.2.1 USA Consumer Genomics Market Estimates and Forecasts, by Application (2020-2032) (USD Million)
8.2.3 Canada
8.2.3.1 Canada Consumer Genomics Market Estimates and Forecasts, by Application (2020-2032) (USD Million)
8.2.4 Mexico
8.2.4.1 Mexico Consumer Genomics Market Estimates and Forecasts, by Application (2020-2032) (USD Million)
8.3 Europe
8.3.1 Eastern Europe
8.3.1.1 Trends Analysis
8.3.1.2 Eastern Europe Consumer Genomics Market Estimates and Forecasts, by Country (2020-2032) (USD Million)
8.3.1.3 Eastern Europe Consumer Genomics Market Estimates and Forecasts, by Application (2020-2032) (USD Million)
8.3.1.4 Poland
8.3.1.4.1 Poland Consumer Genomics Market Estimates and Forecasts, by Application (2020-2032) (USD Million)
8.3.1.5 Romania
8.3.1.5.1 Romania Consumer Genomics Market Estimates and Forecasts, by Application (2020-2032) (USD Million)
8.3.1.6 Hungary
10.3.1.8.1 Hungary Consumer Genomics Market Estimates and Forecasts, by Application (2020-2032) (USD Million)
8.3.1.7 Turkey
8.3.1.7.1 Turkey Consumer Genomics Market Estimates and Forecasts, by Application (2020-2032) (USD Million)
8.3.1.8 Rest of Eastern Europe
8.3.1.8.1 Rest of Eastern Europe Consumer Genomics Market Estimates and Forecasts, by Application (2020-2032) (USD Million)
8.3.2 Western Europe
8.3.2.1 Trends Analysis
8.3.2.2 Western Europe Consumer Genomics Market Estimates and Forecasts, by Country (2020-2032) (USD Million)
8.3.2.3 Western Europe Consumer Genomics Market Estimates and Forecasts, by Application (2020-2032) (USD Million)
8.3.2.4 Germany
8.3.2.4.1 Germany Consumer Genomics Market Estimates and Forecasts, by Application (2020-2032) (USD Million)
8.3.2.5 France
8.3.2.5.1 France Consumer Genomics Market Estimates and Forecasts, by Application (2020-2032) (USD Million)
8.3.2.6 UK
8.3.2.6.1 UK Consumer Genomics Market Estimates and Forecasts, by Application (2020-2032) (USD Million)
8.3.2.7 Italy
8.3.2.7.1 Italy Consumer Genomics Market Estimates and Forecasts, by Application (2020-2032) (USD Million)
8.3.2.8 Spain
8.3.2.8.1 Spain Consumer Genomics Market Estimates and Forecasts, by Application (2020-2032) (USD Million)
8.3.2.9 Netherlands
8.3.2.9.1 Netherlands Consumer Genomics Market Estimates and Forecasts, by Application (2020-2032) (USD Million)
8.3.2.10 Switzerland
8.3.2.10.1 Switzerland Consumer Genomics Market Estimates and Forecasts, by Application (2020-2032) (USD Million)
8.3.2.11 Austria
8.3.2.11.1 Austria Consumer Genomics Market Estimates and Forecasts, by Application (2020-2032) (USD Million)
8.3.2.12 Rest of Western Europe
8.3.2.12.1 Rest of Western Europe Consumer Genomics Market Estimates and Forecasts, by Application (2020-2032) (USD Million)
8.4 Asia-Pacific
8.4.1 Trends Analysis
8.4.2 Asia-Pacific Consumer Genomics Market Estimates and Forecasts, by Country (2020-2032) (USD Million)
8.4.3 Asia-Pacific Consumer Genomics Market Estimates and Forecasts, by Application (2020-2032) (USD Million)
8.4.4 China
8.4.4.1 China Consumer Genomics Market Estimates and Forecasts, by Application (2020-2032) (USD Million)
8.4.5 India
8.4.5.1 India Consumer Genomics Market Estimates and Forecasts, by Application (2020-2032) (USD Million)
8.4.6 Japan
8.4.6.1 Japan Consumer Genomics Market Estimates and Forecasts, by Application (2020-2032) (USD Million)
8.4.7 South Korea
8.4.7.1 South Korea Consumer Genomics Market Estimates and Forecasts, by Application (2020-2032) (USD Million)
8.4.8 Vietnam
8.4.8.1 Vietnam Consumer Genomics Market Estimates and Forecasts, by Application (2020-2032) (USD Million)
8.4.9 Singapore
8.4.9.1 Singapore Consumer Genomics Market Estimates and Forecasts, by Application (2020-2032) (USD Million)
8.4.10 Australia
8.4.10.1 Australia Consumer Genomics Market Estimates and Forecasts, by Application (2020-2032) (USD Million)
8.4.11 Rest of Asia-Pacific
8.4.11.1 Rest of Asia-Pacific Consumer Genomics Market Estimates and Forecasts, by Application (2020-2032) (USD Million)
8.5 Middle East and Africa
8.5.1 Middle East
8.5.1.1 Trends Analysis
8.5.1.2 Middle East Consumer Genomics Market Estimates and Forecasts, by Country (2020-2032) (USD Million)
10.5.1.3 Middle East Consumer Genomics Market Estimates and Forecasts, by Application (2020-2032) (USD Million)
8.5.1.4 UAE
8.5.1.4.1 UAE Consumer Genomics Market Estimates and Forecasts, by Application (2020-2032) (USD Million)
8.5.1.5 Egypt
8.5.1.5.1 Egypt Consumer Genomics Market Estimates and Forecasts, by Application (2020-2032) (USD Million)
8.5.1.6 Saudi Arabia
8.5.1.6.1 Saudi Arabia Consumer Genomics Market Estimates and Forecasts, by Application (2020-2032) (USD Million)
8.5.1.7 Qatar
8.5.1.7.1 Qatar Consumer Genomics Market Estimates and Forecasts, by Application (2020-2032) (USD Million)
8.5.1.8 Rest of Middle East
8.5.1.8.1 Rest of Middle East Consumer Genomics Market Estimates and Forecasts, by Application (2020-2032) (USD Million)
8.5.2 Africa
8.5.2.1 Trends Analysis
8.5.2.2 Africa Consumer Genomics Market Estimates and Forecasts, by Country (2020-2032) (USD Million)
8.5.2.3 Africa Consumer Genomics Market Estimates and Forecasts, by Application (2020-2032) (USD Million)
8.5.2.4 South Africa
8.5.2.4.1 South Africa Consumer Genomics Market Estimates and Forecasts, by Application (2020-2032) (USD Million)
8.5.2.5 Nigeria
8.5.2.5.1 Nigeria Consumer Genomics Market Estimates and Forecasts, by Application (2020-2032) (USD Million)
8.5.2.6 Rest of Africa
8.5.2.6.1 Rest of Africa Consumer Genomics Market Estimates and Forecasts, by Application (2020-2032) (USD Million)
8.6 Latin America
8.6.1 Trends Analysis
8.6.2 Latin America Consumer Genomics Market Estimates and Forecasts, by Country (2020-2032) (USD Million)
8.6.3 Latin America Consumer Genomics Market Estimates and Forecasts, by Application (2020-2032) (USD Million)
8.6.4 Brazil
8.6.4.1 Brazil Consumer Genomics Market Estimates and Forecasts, by Application (2020-2032) (USD Million)
8.6.5 Argentina
8.6.5.1 Argentina Consumer Genomics Market Estimates and Forecasts, by Application (2020-2032) (USD Million)
8.6.6 Colombia
8.6.6.1 Colombia Consumer Genomics Market Estimates and Forecasts, by Application (2020-2032) (USD Million)
8.6.7 Rest of Latin America
8.6.7.1 Rest of Latin America Consumer Genomics Market Estimates and Forecasts, by Application (2020-2032) (USD Million)
9. Company Profiles
9.1 Samsung Electronics
9.1.1 Company Overview
9.1.2 Financial
9.1.3 Products/ Services Offered
9.1.4 SWOT Analysis
9.2 LG Electronics
9.2.1 Company Overview
9.2.2 Financial
9.2.3 Products/ Services Offered
9.2.4 SWOT Analysis
9.3 Sony Corporation
9.3.1 Company Overview
9.3.2 Financial
9.3.3 Products/ Services Offered
9.3.4 SWOT Analysis
9.4 Barco
9.4.1 Company Overview
9.4.2 Financial
9.4.3 Products/ Services Offered
9.4.4 SWOT Analysis
9.5 Christie Digital Systems
9.5.1 Company Overview
9.5.2 Financial
9.5.3 Products/ Services Offered
9.5.4 SWOT Analysis
9.6 Daktronics
9.6.1 Company Overview
9.6.2 Financial
9.6.3 Products/ Services Offered
9.6.4 SWOT Analysis
9.7 Leyard
9.7.1 Company Overview
9.7.2 Financial
9.7.3 Products/ Services Offered
9.7.4 SWOT Analysis
9.8 Unilumin
9.8.1 Company Overview
9.8.2 Financial
9.8.3 Products/ Services Offered
9.8.4 SWOT Analysis
9.9 Absen
9.9.1 Company Overview
9.9.2 Financial
9.9.3 Products/ Services Offered
9.9.4 SWOT Analysis
9.10 Planar Systems
9.10.1 Company Overview
9.10.2 Financial
9.10.3 Products/ Services Offered
9.10.4 SWOT Analysis
10. Use Cases and Best Practices
11. Conclusion
An accurate research report requires proper strategizing as well as implementation. There are multiple factors involved in the completion of good and accurate research report and selecting the best methodology to compete the research is the toughest part. Since the research reports we provide play a crucial role in any company’s decision-making process, therefore we at SNS Insider always believe that we should choose the best method which gives us results closer to reality. This allows us to reach at a stage wherein we can provide our clients best and accurate investment to output ratio.
Each report that we prepare takes a timeframe of 350-400 business hours for production. Starting from the selection of titles through a couple of in-depth brain storming session to the final QC process before uploading our titles on our website we dedicate around 350 working hours. The titles are selected based on their current market cap and the foreseen CAGR and growth.
The 5 steps process:
Step 1: Secondary Research:
Secondary Research or Desk Research is as the name suggests is a research process wherein, we collect data through the readily available information. In this process we use various paid and unpaid databases which our team has access to and gather data through the same. This includes examining of listed companies’ annual reports, Journals, SEC filling etc. Apart from this our team has access to various associations across the globe across different industries. Lastly, we have exchange relationships with various university as well as individual libraries.
Step 2: Primary Research
When we talk about primary research, it is a type of study in which the researchers collect relevant data samples directly, rather than relying on previously collected data. This type of research is focused on gaining content specific facts that can be sued to solve specific problems. Since the collected data is fresh and first hand therefore it makes the study more accurate and genuine.
We at SNS Insider have divided Primary Research into 2 parts.
Part 1 wherein we interview the KOLs of major players as well as the upcoming ones across various geographic regions. This allows us to have their view over the market scenario and acts as an important tool to come closer to the accurate market numbers. As many as 45 paid and unpaid primary interviews are taken from both the demand and supply side of the industry to make sure we land at an accurate judgement and analysis of the market.
This step involves the triangulation of data wherein our team analyses the interview transcripts, online survey responses and observation of on filed participants. The below mentioned chart should give a better understanding of the part 1 of the primary interview.
Part 2: In this part of primary research the data collected via secondary research and the part 1 of the primary research is validated with the interviews from individual consultants and subject matter experts.
Consultants are those set of people who have at least 12 years of experience and expertise within the industry whereas Subject Matter Experts are those with at least 15 years of experience behind their back within the same space. The data with the help of two main processes i.e., FGDs (Focused Group Discussions) and IDs (Individual Discussions). This gives us a 3rd party nonbiased primary view of the market scenario making it a more dependable one while collation of the data pointers.
Step 3: Data Bank Validation
Once all the information is collected via primary and secondary sources, we run that information for data validation. At our intelligence centre our research heads track a lot of information related to the market which includes the quarterly reports, the daily stock prices, and other relevant information. Our data bank server gets updated every fortnight and that is how the information which we collected using our primary and secondary information is revalidated in real time.
Step 4: QA/QC Process
After all the data collection and validation our team does a final level of quality check and quality assurance to get rid of any unwanted or undesired mistakes. This might include but not limited to getting rid of the any typos, duplication of numbers or missing of any important information. The people involved in this process include technical content writers, research heads and graphics people. Once this process is completed the title gets uploader on our platform for our clients to read it.
Step 5: Final QC/QA Process:
This is the last process and comes when the client has ordered the study. In this process a final QA/QC is done before the study is emailed to the client. Since we believe in giving our clients a good experience of our research studies, therefore, to make sure that we do not lack at our end in any way humanly possible we do a final round of quality check and then dispatch the study to the client.
Key Segments:
By Type
Indoor Modular Screens
Outdoor Modular Screens
Request for Segment Customization as per your Business Requirement: Segment Customization Request
REGIONAL COVERAGE:
North America
US
Canada
Mexico
Europe
Eastern Europe
Poland
Romania
Hungary
Turkey
Rest of Eastern Europe
Western Europe
Germany
France
UK
Italy
Spain
Netherlands
Switzerland
Austria
Rest of Western Europe
Asia Pacific
China
India
Japan
South Korea
Vietnam
Singapore
Australia
Rest of Asia Pacific
Middle East & Africa
Middle East
UAE
Egypt
Saudi Arabia
Qatar
Rest of the Middle East
Africa
Nigeria
South Africa
Rest of Africa
Latin America
Brazil
Argentina
Colombia
Rest of Latin America
Request for Country Level Research Report: Country Level Customization Request
Available Customization
With the given market data, SNS Insider offers customization as per the company’s specific needs. The following customization options are available for the report:
Product Analysis
Criss-Cross segment analysis (e.g. Product X Application)
Product Matrix which gives a detailed comparison of the product portfolio of each company
Geographic Analysis
Additional countries in any of the regions
Company Information
Detailed analysis and profiling of additional market players (Up to five)
The Multi-factor authentication Market size was valued at USD 16.00 billion in 2023 and is expected to grow to USD 54.12 billion by 2032 and grow at a CAGR of 14.5% over the forecast period of 2024-2032.
The Microdisplay Market Size was valued at USD 2.45 Billion in 2023, it is expected to reach USD 13.82 Billion by 2032 with a growing CAGR of 21.29% over the forecast period 2024-2032.
The Livestock Identification Market Size was valued at USD 1.79 Billion in 2023 and is expected to reach USD 3.99 Billion by 2032 and grow at a CAGR of 9.77% over the forecast period 2024-2032.
The Flame Arrestor Market size was valued at USD 984.77 million in 2023 and is expected to grow to USD 1750.45 million by 2032 and grow at a CAGR of 6.6% over the forecast period of 2024-2032.
The Underfloor Heating Market Size was valued at $4.8 billion in 2023 and is expected to reach $9.7 billion by 2032 & grow at a CAGR of 8.2 % by 2024-2032.
The Gaming Hardware Market Size was valued at USD 36.2 Billion in 2023 and is expected to Reach USD 63.86 Billion by 2032, at 6.51% CAGR During 2024-2032
Hi! Click one of our member below to chat on Phone