Smart Shelves Market Report Scope & Overview:
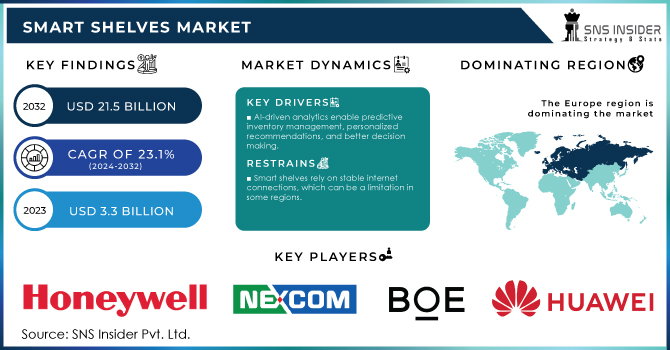
The Smart Shelves Market was valued at USD 3.3 billion in 2023 and is expected to reach USD 21.5 billion by 2032 and grow at a CAGR of 23.1% from 2024-2032.
The smart shelves market is experiencing rapid growth, driven by technological advancements in retail automation and inventory management. Smart shelves, equipped with sensors, RFID tags, and IoT technology, help retailers track inventory in real-time, enhance customer experience, and reduce operational costs. These shelves are widely used in supermarkets, convenience stores, and warehouses, where they streamline inventory tracking, prevent stockouts, and improve overall efficiency.
Get more information on Smart Shelves Market - Request Free Sample Report
Key factors driving the market growth include the rising demand for automated retail solutions, the increasing adoption of smart retail technologies, and the need for real-time inventory monitoring. Retailers are leveraging these technologies to enhance customer service, reduce labor costs, and gain insights into consumer behavior through data analytics. The integration of AI and machine learning further enhances the functionality of smart shelves by enabling predictive analytics, personalized promotions, and dynamic pricing strategies. Additionally, the growing popularity of contactless shopping has accelerated the adoption of smart shelves as they support seamless, self-service experiences. Retailers are also focusing on minimizing losses due to theft or misplaced items, with smart shelves providing a valuable tool for monitoring product movements.
Market Dynamics
Drivers
-
The development of eco-friendly and energy-efficient smart shelving solutions aligns with the increasing focus on sustainability in retail.
-
AI-driven analytics enable predictive inventory management, personalized recommendations, and better decision-making.
-
Retailers are increasingly adopting automation technologies to streamline operations, reduce labor costs, and enhance efficiency.
Retailers are increasingly adopting automation technologies like smart shelves to streamline operations, reduce labor costs, and enhance efficiency. Smart shelves, equipped with sensors, RFID tags, and IoT technology, automate the inventory management process, allowing retailers to monitor stock levels in real-time without manual checks.
The automation provided by smart shelves helps retailers significantly reduce labor costs, which traditionally account for about 10-20% of operational expenses in retail. For instance, Walmart reported a reduction in stock-related issues by 30% after implementing smart shelf technology across selected stores. This reduction is not just about cost savings but also translates into fewer out-of-stock situations, enhancing customer satisfaction.
Moreover, automated inventory tracking increases efficiency by reducing errors and enabling faster restocking, critical in high-traffic stores. In a survey by McKinsey, 73% of retailers using automation technologies, including smart shelves, reported improved operational efficiency and faster inventory turnover, highlighting the pivotal role of smart shelves in modern retail strategies.
AI-driven analytics in smart shelves enable retailers to manage their inventory more accurately, make personalized recommendations, and make better decisions. AI can predict demand patterns by analyzing data collected from sensors and RFID tags on smart shelves, helping retailers maintain optimal stock levels and reduce overstocking. Additionally, AI analytics support better decision-making by identifying trends and inefficiencies, enabling retailers to optimize store layouts, pricing strategies, and product assortments, which has led to a 15-20% increase in sales efficiency in stores that have adopted these technologies.
Restraints
-
Smart shelves rely on stable internet connections, which can be a limitation in some regions.
-
Retailers accustomed to traditional systems may be reluctant to adopt new technologies.
-
Handling and securing customer data can pose challenges.
Smart shelves use sensors, RFID tags, cameras, and IoT devices to gather real-time data on inventory levels, product movements, and even customer interactions. This data helps retailers optimize stock levels, personalize shopping experiences, and enhance operational efficiency. However, it also involves collecting personal information, such as purchasing habits, preferences, and, in some cases, biometric data through cameras or sensors.
The primary concern is safeguarding this data against breaches, unauthorized access, and misuse. Cybersecurity threats, such as hacking and data leaks, pose significant risks to retailers, potentially leading to financial losses, reputational damage, and legal liabilities due to non-compliance with data protection regulations like GDPR and CCPA. Moreover, the integration of smart shelves into broader retail systems increases the potential attack surface for cybercriminals.
Retailers must invest in robust security measures, including encryption, secure cloud storage, and regular system updates, to safeguard data. Additionally, transparent data privacy policies and gaining customer trust through proper consent mechanisms are crucial. Failure to address these security challenges can hinder the adoption of smart shelves, as data privacy concerns are a major deterrent for both businesses and consumers.
Segment Analysis
By Component
In 2023, the hardware segment dominated the market, accounting for over 46.0% of global revenue, as retailers and warehouse owners increasingly invest in hardware to minimize shrinkage, optimize inventory, and maintain product availability. A key trend is the miniaturization and integration of sensors and RFID tags, enabling smoother deployment and more discreet designs. moreover, there is a growing move towards battery-free RFID tags that utilize ambient energy, significantly lowering operational costs for retailers.
The software segment is anticipated to grow at the fastest CAGR of more than 24.6% during the forecast period, driven by increasing demand for personalized shopping experiences and the adoption of software solutions that monitor customer behavior and preferences.
By Application
In 2023, The inventory management segment dominated the market and represented more than 35.0% share of global revenue. The need for real-time visibility into stock levels is a key factor driving the adoption of smart shelves for inventory management. With increasing consumer expectations for product availability, retailers must ensure their shelves are consistently stocked with the correct items.
The pricing management segment is anticipated to grow significantly during the forecast period. A key trend is the use of electronic shelf labels (ESLs), which show real-time prices that can be updated remotely using data from smart shelves. Smart shelves help with dynamic pricing by providing up-to-date sales and inventory information, allowing retailers to adjust prices automatically. Additionally, AI and machine learning are increasingly used to analyze data from smart shelves and suggest the best pricing strategies.
By End-Use
In 2023, The hypermarkets segment dominated the market and represented more than 29.70% of global revenue. The rising need for efficient inventory control is paramount in these vast retail environments. Smart shelves help minimize stockouts and overstocking, leading to better inventory management. Additionally, hypermarkets are placing more emphasis on improving customer experience to stand out in a competitive market.
The department stores segment is expected to see substantial growth during the forecast period. The adoption of smart shelves in these stores is driven by the need to innovate and remain competitive against the rise of e-commerce. Additionally, smart shelves assist department stores in managing their varied inventory more efficiently, ensuring popular items are consistently available. The ability to collect detailed customer insights from smart shelf interactions also plays a crucial role, allowing department stores to adjust their offerings to align with changing consumer preferences.
Regional Analysis
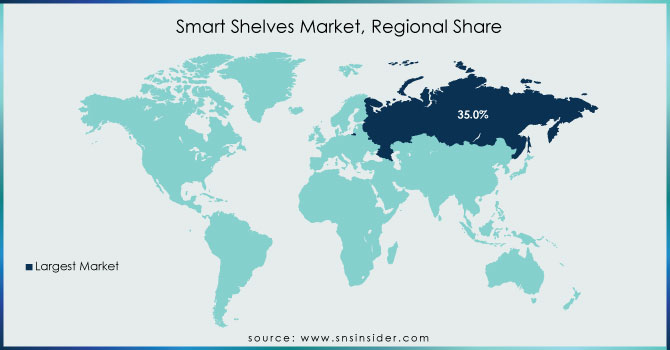
In 2023, Europe led the global smart shelves market, representing more than 35.0% of the revenue. Both consumers and governments in Europe are placing a growing emphasis on sustainability. Additionally, the smart shelves market in North America is projected to grow at a substantial CAGR of 23.7% during the forecast period. The rapid advancement of IoT and AI technologies in the region is a key driver of this growth. Additionally, increasing consumer demand for personalized and convenient shopping experiences is pushing retailers to adopt smart shelves, which offer real-time product information and customized promotions to meet these expectations.
The smart shelves market in the Asia Pacific region is anticipated to grow at the fastest rate, with a CAGR of 26.4% during the forecast period. Retailers in countries like China, Japan, and South Korea are increasingly incorporating smart shelves into their digital transformation efforts.
Do You Need any Customization Research on Smart Shelves Market - Enquire Now
Key Players:
Some major key players are Honeywell, Nexcom International Co., Ltd., BOE Technology Group Co., Ltd, Avery Dennison, Samsung Electronics, E Ink Holdings, Intel, Huawei, AWM Smart Shelf, Lenovo PCCW Solutions Limited, and others.
Recent Development
- In April 2024, Inc. established a strategic partnership with AUO Corporation, a display manufacturer based in Taiwan, to develop ePaper displays.
- In March 2024, Huawei Technologies Co. Ltd. introduced the Smart Retail Solution, designed for stores, retail campuses, and multi-branch connectivity. This solution emphasizes intelligent warehousing, smart store operations, digital marketing, and energy efficiency.
| Report Attributes | Details |
| Market Size in 2023 | USD 3.3 Bn |
| Market Size by 2032 | USD 21.5 Bn |
| CAGR | CAGR of 23.1% From 2024 to 2032 |
| Base Year | 2023 |
| Forecast Period | 2024-2032 |
| Historical Data | 2020-2022 |
| Report Scope & Coverage | Market Size, Segments Analysis, Competitive Landscape, Regional Analysis, DROC & SWOT Analysis, Forecast Outlook |
| Key Segments |
• By Component (Hardware,Software and Services) • By Application (Planogram Management, Inventory Management,Pricing Management,Content Management and Others) |
| Regional Analysis/Coverage | North America (US, Canada, Mexico), Europe (Eastern Europe [Poland, Romania, Hungary, Turkey, Rest of Eastern Europe] Western Europe] Germany, France, UK, Italy, Spain, Netherlands, Switzerland, Austria, Rest of Western Europe]), Asia Pacific (China, India, Japan, South Korea, Vietnam, Singapore, Australia, Rest of Asia Pacific), Middle East & Africa (Middle East [UAE, Egypt, Saudi Arabia, Qatar, Rest of Middle East], Africa [Nigeria, South Africa, Rest of Africa], Latin America (Brazil, Argentina, Colombia Rest of Latin America) |
| Company Profiles | Some major key players are Honeywell, Nexcom International Co., Ltd., BOE Technology Group Co., Ltd, Avery Dennison, Samsung Electronics, E Ink Holdings, Intel, Huawei, AWM Smart Shelf, Lenovo PCCW Solutions Limited, and others. |
| Key Drivers | • The development of eco-friendly and energy-efficient smart shelving solutions aligns with the increasing focus on sustainability in retail. • AI-driven analytics enable predictive inventory management, personalized recommendations, and better decision-making. |
| Market Restraints | • Smart shelves rely on stable internet connections, which can be a limitation in some regions. • Retailers accustomed to traditional systems may be reluctant to adopt new technologies. |
Frequently Asked Questions
- The development of eco-friendly and energy-efficient smart shelving solutions aligns with the increasing focus on sustainability in retail.
- AI-driven analytics enable predictive inventory management, personalized recommendations, and better decision-making.
The forecast period of the Smart Shelves Market is 2024-2032.
The four segments are covered in the Smart Shelves Market, By Components, By Enterprise Size, By Application, By End-user.
smart shelves market CAGR rate during the forecast period growing at a CAGR of 23.1%
Smart Shelves Market was valued at USD 3.32 billion in 2023 and is expected to reach USD 21.48 billion by 2032 and grow at a CAGR of 23.07% from 2024-2032.
Get in Touch
