Video Conferencing Market Report Scope & Overview:

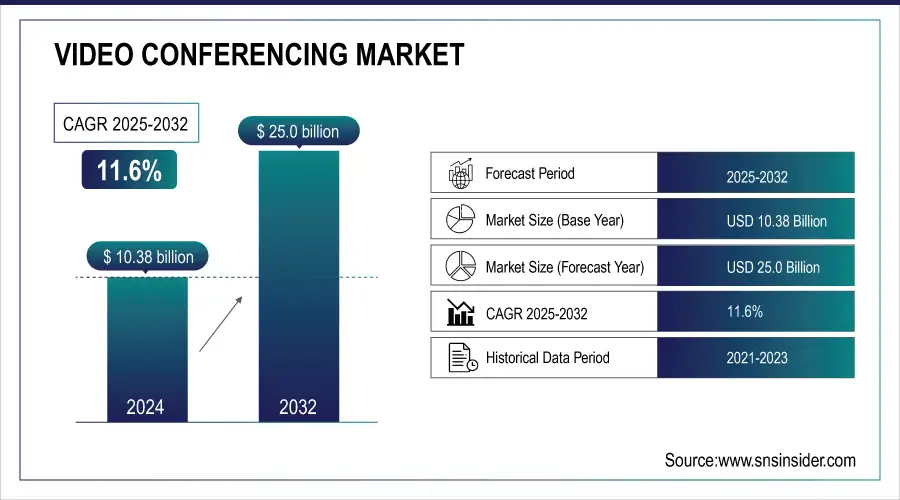
The Video Conferencing Market was valued at USD 10.38 billion in 2024 and is expected to reach USD 25.0 billion by 2032, growing at a CAGR of 11.6% from 2025-2032.

The video conferencing market is growing due to rising demand for virtual communication across industries, driven by remote and hybrid work models. Healthcare, education, and government sectors increasingly use it for consultations, learning, and secure communication. Growth is fueled by cloud-based solutions for scalable, cost-effective services, AI and ML features like real-time transcription and noise suppression, and 5G adoption, which enhances video quality and reduces latency, even in areas with limited internet infrastructure.

Video Conferencing Market Revenue Analysis

Get more information on Video Conferencing Market - Request Free Sample Report

Furthermore, the increasing focus on digital transformation across businesses, coupled with the need for improved team collaboration tools, has spurred the adoption of video conferencing software. Leading platforms like Zoom, Microsoft Teams, and Google Meet have rapidly expanded their feature sets to meet growing enterprise needs, such as security enhancements, better integration with business workflows, and virtual collaboration tools like whiteboarding and breakout rooms.

However, the market faces challenges such as data privacy concerns and the need for better cybersecurity measures due to the sensitive nature of video communications. Despite these challenges, the growing importance of global business operations, remote workforce management, and digital learning environments will continue to drive the video conferencing market forward.

Video Conferencing Market Drivers:

  • Demand for improved cybersecurity and data privacy measures to protect sensitive video communications.

  • Improved video performance with lower latency and higher quality, particularly in regions with limited internet infrastructure.

  • Enhanced user experience through real-time transcription, noise suppression, and video quality improvements.

In the video conferencing market, enhanced user experience through technologies like real-time transcription, noise suppression, and video quality improvements is becoming a key differentiator. These features, driven by advancements in artificial intelligence (AI) and machine learning (ML), improve the accessibility, clarity, and overall effectiveness of virtual meetings. For instance, real-time transcription allows users to follow conversations more easily, particularly in multinational or hearing-impaired settings, while AI-powered noise suppression ensures that background sounds are minimized, leading to clearer communication. As 5G networks expand, video quality will further improve, offering high-definition streaming with reduced latency, especially in areas with previously limited internet capabilities. This will enable smoother, more immersive communication, encouraging wider adoption of video conferencing across industries like healthcare, education, and global business operations.

Future growth will also be driven by the increasing integration of AI for more advanced capabilities, such as smart camera adjustments, sentiment analysis, and real-time language translation, making virtual meetings even more seamless and inclusive. Additionally, as more businesses transition to remote or hybrid models, the demand for high-quality, reliable, and secure video conferencing solutions will increase.

Video Conferencing Market Restraints:

  • Reliable, high-quality video calls demand significant internet bandwidth, limiting accessibility in areas with poor infrastructure.

  • Prolonged virtual meetings contribute to "Zoom fatigue," potentially reducing the frequency of usage over time.

  • Rising cyberattacks and vulnerabilities in video conferencing platforms require stronger protection measures.

The rise in cyberattacks and vulnerabilities in video conferencing platforms is a growing concern in the market. As virtual meetings have become essential for businesses, schools, and government institutions, cybercriminals are increasingly targeting these platforms to exploit sensitive information. Common threats include unauthorized access, data breaches, and "zoom bombing" (where uninvited users disrupt meetings). These incidents highlight the need for stronger cybersecurity measures to protect users and sensitive data shared during video calls. Leading video conferencing providers like Zoom, Microsoft Teams, and Google Meet have been ramping up their efforts by introducing end-to-end encryption, multi-factor authentication, and other advanced security features to mitigate these risks. However, as cyber threats evolve, the demand for even more robust security solutions will intensify.

Future growth in the market will be closely linked to how well these platforms can address cybersecurity challenges. Businesses, especially those handling sensitive data in sectors like healthcare, finance, and government, will prioritize security when choosing video conferencing solutions. This is already leading to increased investments in AI-powered threat detection systems, encrypted data storage, and secure cloud infrastructure.

Video Conferencing Market Segment Analysis:
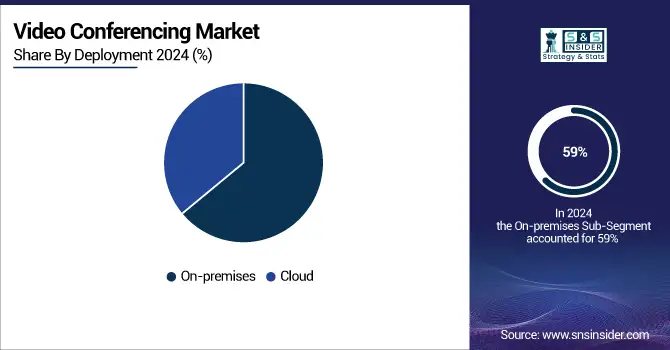
  • By Deployment

In 2023, the on-premise segment dominated the market and captured the largest revenue share, around 59%, fueled by industries with stringent data security requirements, existing IT infrastructure investments, and challenges related to internet reliability, latency, and bandwidth. Additionally, the segment's growth is driven by the rising demand for flexible, scalable remote work solutions, lower upfront costs, reduced maintenance, and advancements in cloud technology that improve security and interoperability.

The cloud segment is projected to experience the highest CAGR of over 12.3% during the forecast period. This growth is driven by the increasing adoption of cloud-based video conferencing solutions in businesses, which provide flexible work environments and enhance overall productivity.

  • By Component

In 2023, the hardware segment dominated the market. It accounted for the largest revenue share of 42.6%, driven by the growing adoption of endpoints such as laptops, smartphones, and desktops equipped with high-resolution cameras, speakers, and microphones. The shift toward remote and hybrid work culture, especially following the pandemic, has accelerated the use of video conferencing solutions for team collaboration.

Moreover, the software segment will experience the highest CAGR rate during the forecast period. This growth is fueled by rising demand for software solutions that offer real-time communication, screen sharing, virtual backgrounds, and enhanced collaboration and productivity. Additionally, the expansion of high-speed internet and the widespread use of smartphones are further boosting the demand for video conferencing software.

  • By Application

In 2023, the enterprise segment dominated the market and captured the largest market share of around 53.3%, driven by the increased demand for room-based conference video endpoints that are deployed and configured in meeting rooms. In the enterprise segment, the large enterprises held the highest market share of around 54.5%, driven by the significant adoption of video conferencing solutions for business communications across various geographies. Consequently, leading market players are concentrating on developing offerings that meet the specific needs of multinational enterprises. The SME segment is anticipated to grow at the highest CAGR during the forecast period, fueled by the growing awareness of the significance of conferencing and collaboration. Various market players are creating cost-effective solutions tailored to the needs of SMEs. For example, Cisco Systems Inc. provides collaboration solutions like the Cisco Business Edition 7000 specifically for small and mid-sized businesses. This focus on developing suitable offerings is significantly contributing to the segment's growth in the coming years.

The consumer segment is anticipated to register the highest CAGR of around 12.6% during the forecast period, driven by the increasing demand for consumer-grade solutions. The surge in online learning has further fueled the need for these solutions to facilitate virtual classes, lectures, and workshops. Additionally, the growing demand for remote medical consultations and follow-ups has led to a higher adoption of video conferencing solutions.

  • By End-Use

In 2023, the corporate segment dominated the market and represented over 36.3% market share, driven by increasing consumer interest in cloud-based communication and collaboration solutions. The rise in geographically dispersed teams has further enhanced the use of cloud-based platforms for seamless data sharing, collaboration, and communication.

The healthcare segment is expected to experience a significant CAGR during the forecast period. The increasing trend of telemedicine, which enables medical practitioners to use video conferencing solutions for providing medical advice, monitoring patients, and discussing treatment plans virtually, is expected to drive this growth. Moreover, healthcare institutions are working together across regions and specialties, with video conferencing enabling multidisciplinary discussions, case reviews, and knowledge sharing among medical professionals. This collaborative approach is further propelling the segment's growth in the coming years.

Video Conferencing Market Regional Analysis:

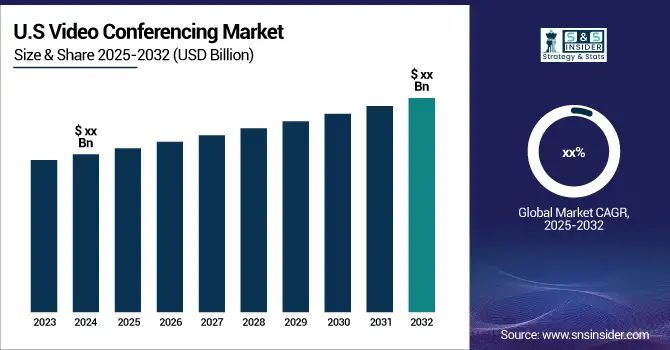
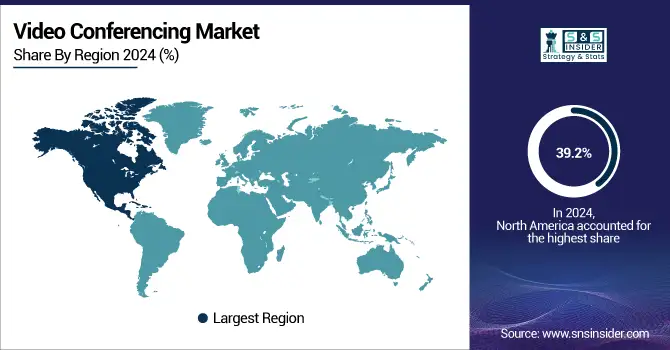
North America Video Conferencing Market Insights

The North American video conferencing market accounted for approximately 39.2% of revenue in 2024, driven by a higher number of adoptions across the region. Market growth is expected to be driven by the growing demand for high-quality internet and visual meeting services. Moreover, market growth is further driven by the strong presence of various major players in this region and a growing trend towards Bring Your Own Device solutions that lead to an increase in demand for webcams and headphones.

With the adoption of new working styles in regional enterprises, the Asia Pacific video conferencing market is expected to grow at a compound annual growth rate of more than 13.2% during the forecast period. In addition, market growth will be further accelerated by the evolution of mobile broadband technologies like WiMAX and HSDPA networks in Japan and other countries. The Japan video conferencing market is expected to grow at a CAGR of approximately 12.1% during the forecast period, driven by the rising trend of remote and hybrid working models in organizations that require dependable video conferencing platforms.

Video-Conferencing-Market-Regional-Share

Video Conferencing Market Key Players:

  • Zoom Video Communications - (Zoom Meetings, Zoom Phone, Zoom Rooms)

  • Microsoft - (Microsoft Teams, Skype, Microsoft 365)

  • Cisco Systems - (Cisco Webex, Cisco Jabber, Cisco TelePresence)

  • Google - (Google Meet, Google Chat)

  • GoTo - (GoTo Meeting, GoToWebinar, GoToConnect)

  • RingCentral - (RingCentral Video Meetings, RingCentral Office)

  • BlueJeans Network - (BlueJeans Meetings, BlueJeans Events)

  • Lifesize - (Lifesize Go, Lifesize Cloud)

  • Pexip - (Pexip Infinity, Pexip Meetings)

  • Logitech - (Logitech MeetUp, Logitech Rally)

  • Polycom - (Polycom RealPresence, Polycom Trio)

  • Avaya - (Avaya Spaces, Avaya Equinox)

  • Adobe- (Adobe Connect)

  • Huawei - (Huawei WeLink)

  • Jitsi - (Jitsi Meet, Jitsi Videobridge)

  • 8x8 - (8x8 Video Meetings, 8x8 Contact Center)

  • ZoomInfo - (ZoomInfo Meetings)

  • GoToWebinar - (GoToWebinar)

  • Join.me - (Join.me)

  • VSee - (VSee Telehealth)

Recent Developments:

  • Adobe Inc.

Adobe Inc. is a global leader in digital media and digital experience solutions, headquartered in San Jose, California. Founded in 1982, the company is best known for its industry-defining software, including Photoshop, Illustrator, Acrobat, and Adobe Creative Cloud, which empower individuals and enterprises to create, manage, and deliver compelling digital content. Beyond creative tools, Adobe has expanded into digital experience and marketing solutions through Adobe Experience Cloud, enabling businesses to optimize customer engagement, analytics, and personalization. With its strong emphasis on innovation, subscription-based SaaS model, and cloud-first strategy, Adobe continues to play a pivotal role in shaping the digital economy.

  • In April 2024, Adobe Inc. introduced the latest version of Frame.io, V4, a flexible, fast, and intuitive creative collaboration platform designed to streamline and simplify workflows in content creation and production.

  • Zoom Video Communications, Inc.

Zoom Video Communications, Inc. is a leading provider of cloud-based communication and collaboration solutions, headquartered in San Jose, California. Founded in 2011, Zoom revolutionized virtual communication with its user-friendly video conferencing platform, enabling seamless meetings, webinars, and hybrid collaboration across industries. The company gained global recognition during the COVID-19 pandemic, becoming a vital tool for remote work, online learning, and telehealth. Beyond video conferencing, Zoom has expanded its portfolio to include Zoom Phone, Zoom Rooms, and Zoom Contact Center, supporting unified communications. With its scalability, reliability, and innovation, Zoom continues to shape the future of digital interaction and enterprise collaboration.

  • In April 2024, Zoom Video Communications, Inc. announced the general availability of Zoom Workplace, an AI-powered collaboration platform featuring new tools to enhance teamwork, foster connections, and boost productivity.

Video Conferencing Market Report Scope:

Report Attributes Details
Market Size in 2024 USD 10.38 Billion
Market Size by 2032 USD 25.0 Billion
CAGR CAGR 11.6% From 2025 to 2032
Base Year 2024
Forecast Period 2025-2032
Historical Data 2020-2022
Report Scope & Coverage Market Size, Segments Analysis, Competitive  Landscape, Regional Analysis, DROC & SWOT Analysis, Forecast Outlook
Key Segments • By Component (Hardware, Software and Service)
• By Deployment (On-premise and Cloud)
• By Application (Consumer, Enterprise
• By End-Use (Corporate, Education, Healthcare, Government & Defense, BFSI, Media & Entertainment and Others)
 
Regional Analysis/Coverage North America (US, Canada), Europe (Germany, UK, France, Italy, Spain, Russia, Poland, Rest of Europe), Asia Pacific (China, India, Japan, South Korea, Australia, ASEAN Countries, Rest of Asia Pacific), Middle East & Africa (UAE, Saudi Arabia, Qatar, South Africa, Rest of Middle East & Africa), Latin America (Brazil, Argentina, Mexico, Colombia, Rest of Latin America).
Company Profiles Zoom Video Communications, Microsoft, Cisco Systems, Google, GoTo, RingCentral, BlueJeans Network, Lifesize, Pexip, Logitech 

Table Of Contents

1. Introduction

1.1 Market Definition & Scope

 1.2 Research Assumptions & Abbreviations

 1.3 Research Methodology

2. Executive Summary

2.1 Market Snapshot

 2.2 Market Absolute $ Opportunity Assessment & Y-o-Y Analysis, 2021–2032

 2.3 Market Size & Forecast, By Segmentation, 2021–2032

  2.3.1 Market Size By Component

  2.3.2 Market Size By Application

         2.3.2 Market Size By Deployment

         2.3.2 Market Size By End-Use

 2.4 Market Share & BPS Analysis By Region, 2024

 2.5 Industry Growth Scenarios – Conservative, Likely & Optimistic

 2.6 Industry CxO’s Perspective

3. Market Overview

3.1 Market Dynamics

  3.1.1 Drivers

  3.1.2 Restraints

  3.1.3 Opportunities

  3.1.4 Key Market Trends

 3.2 Industry PESTLE Analysis

 3.3 Key Industry Forces (Porter’s) Impacting Market Growth

 3.4 Industry Supply Chain Analysis

  3.4.1 Raw Material Suppliers

  3.4.2 Manufacturers

  3.4.3 Distributors/Suppliers

  3.4.4 Customers/End-Users

 3.5 Industry Life Cycle Assessment

 3.6 Parent Market Overview

 3.7 Market Risk Assessment

4. Statistical Insights & Trends Reporting

     4.1 User Adoption & Engagement Statistics

4.1.1 Average daily/weekly active users on leading video conferencing platforms

4.1.2 Percentage of enterprises using video conferencing as a primary collaboration tool

4.1.3 Growth rate of hybrid work adoption driving video conferencing usage

     4.2 Usage Metrics & Behavior Trends

4.2.1 Average meeting duration (minutes) across industries

4.2.2 Percentage of meetings with video-enabled vs. audio-only sessions

4.2.3 Average number of participants per virtual meeting

     4.3 Infrastructure & Technology Integration

4.3.1 Percentage of video conferences hosted via cloud-based platforms

4.3.2 Share of organizations integrating AI-driven features (e.g., transcription, translation)

4.3.3 Growth in mobile and tablet-based video conferencing sessions

     4.4 Cost Efficiency & ROI Indicators

4.4.1 Average reduction in business travel expenses (%) due to video conferencing adoption

4.4.2 Annual cost savings per enterprise from remote collaboration tools

4.4.3 Estimated productivity increase (%) attributed to reduced travel and faster decision-making

5. Video Conferencing Market Segmental Analysis & Forecast, By Component, 2021 – 2032, Value (USD Billion)

5.1 Introduction

 5.2 Hardware

  5.2.1 Key Trends

  5.2.2 Market Size & Forecast, 2021 – 2032

         5.2.3 Camera

  5.2.3.1 Key Trends

  5.2.3.2 Market Size & Forecast, 2021 – 2032

         5.2.4 Microphone/Headphone

  5.2.4.1 Key Trends

  5.2.4.2 Market Size & Forecast, 2021 – 2032

         5.2.5 Others

  5.2.5.1 Key Trends

  5.2.5.2 Market Size & Forecast, 2021 – 2032

 5.3 Software

  5.3.1 Key Trends

  5.3.2 Market Size & Forecast, 2021 – 2032

 5.4 Service

  5.4.1 Key Trends

  5.4.2 Market Size & Forecast, 2021 – 2032

6. Video Conferencing Market Segmental Analysis & Forecast, By Application, 2021 – 2032, Value (USD Billion)

    6.1 Introduction

 6.2 Consumer

  6.2.1 Key Trends

  6.2.2 Market Size & Forecast, 2021 – 2032

 6.3 Enterprise

  6.3.1 Key Trends

  6.3.2 Market Size & Forecast, 2021 – 2032

     6.3.3 Large Enterprise

  6.3.3.1 Key Trends

  6.3.3.2 Market Size & Forecast, 2021 – 2032

     6.3.4 Small & Medium Enterprises (SMEs)

  6.3.4.1 Key Trends

  6.3.4.2 Market Size & Forecast, 2021 – 2032

7. Video Conferencing Market Segmental Analysis & Forecast, By End-Use, 2021 – 2032, Value (USD Billion)

    7.1 Introduction

 7.2 Corporate

  7.2.1 Key Trends

  7.2.2 Market Size & Forecast, 2021 – 2032

 7.3 Education

  7.3.1 Key Trends

  7.3.2 Market Size & Forecast, 2021 – 2032

 7.4 Healthcare

  7.4.1 Key Trends

  7.4.2 Market Size & Forecast, 2021 – 2032

 7.5 Government & Defense

  7.5.1 Key Trends

  7.5.2 Market Size & Forecast, 2021 – 2032

 7.6 BFSI

  7.6.1 Key Trends

  7.6.2 Market Size & Forecast, 2021 – 2032

 7.7 Media & Entertainment

  7.7.1 Key Trends

  7.7.2 Market Size & Forecast, 2021 – 2032

 7.8 Others

  7.8.1 Key Trends

  7.8.2 Market Size & Forecast, 2021 – 2032

8. Video Conferencing Market Segmental Analysis & Forecast, By Deployment, 2021 – 2032, Value (USD Billion)

    8.1 Introduction

 8.2 On-premise

  8.2.1 Key Trends

  8.2.2 Market Size & Forecast, 2021 – 2032

 8.3 Cloud

  8.3.1 Key Trends

  8.3.2 Market Size & Forecast, 2021 – 2032

9. Video Conferencing Market Segmental Analysis & Forecast By Region, 2021 – 2025, Value (USD Billion)

9.1 Introduction

9.2 North America

 9.2.1 Key Trends

 9.2.2 Video Conferencing Market Size & Forecast, By Component, 2021 – 2032

 9.2.3 Video Conferencing Market Size & Forecast, By Application, 2021 – 2032

 9.2.4 Video Conferencing Market Size & Forecast, By End-Use, 2021 – 2032

 9.2.5 Video Conferencing Market Size & Forecast, By Deployment, 2021 – 2032

 9.2.6 Video Conferencing Market Size & Forecast, By Country, 2021 – 2032

  9.2.6.1 USA

   9.2.6.1.1 Video Conferencing Market Size & Forecast, By Component, 2021 – 2032

   9.2.6.1.2 Video Conferencing Market Size & Forecast, By Application, 2021 – 2032

   9.2.6.1.3 Video Conferencing Market Size & Forecast, By End-Use, 2021 – 2032

   9.2.6.1.4 Video Conferencing Market Size & Forecast, By Deployment, 2021 – 2032

  9.2.6.2 Canada

   9.2.6.2.1 Video Conferencing Market Size & Forecast, By Component, 2021 – 2032

   9.2.6.2.2 Video Conferencing Market Size & Forecast, By Application, 2021 – 2032

   9.2.6.2.3 Video Conferencing Market Size & Forecast, By End-Use, 2021 – 2032

   9.2.6.2.4 Video Conferencing Market Size & Forecast, By Deployment, 2021 – 2032

9.3 Europe

 9.3.1 Key Trends

 9.3.2 Video Conferencing Market Size & Forecast, By Component, 2021 – 2032

 9.3.3 Video Conferencing Market Size & Forecast, By Application, 2021 – 2032

 9.3.4 Video Conferencing Market Size & Forecast, By End-Use, 2021 – 2032

 9.3.5 Video Conferencing Market Size & Forecast, By Deployment, 2021 – 2032

 9.3.6 Video Conferencing Market Size & Forecast, By Country, 2021 – 2032

  9.3.6.1 Germany

   9.3.6.1.1 Video Conferencing Market Size & Forecast, By Component, 2021 – 2032

   9.3.6.1.2 Video Conferencing Market Size & Forecast, By Application, 2021 – 2032

   9.3.6.1.3 Video Conferencing Market Size & Forecast, By End-Use, 2021 – 2032

   9.3.6.1.4 Video Conferencing Market Size & Forecast, By Deployment, 2021 – 2032

  9.3.6.2 UK

   9.3.6.2.1 Video Conferencing Market Size & Forecast, By Component, 2021 – 2032

   9.3.6.2.2 Video Conferencing Market Size & Forecast, By Application, 2021 – 2032

   9.3.6.2.3 Video Conferencing Market Size & Forecast, By End-Use, 2021 – 2032

   9.3.6.2.4 Video Conferencing Market Size & Forecast, By Deployment, 2021 – 2032

  9.3.6.3 France

   9.3.6.3.1 Video Conferencing Market Size & Forecast, By Component, 2021 – 2032

   9.3.6.3.2 Video Conferencing Market Size & Forecast, By Application, 2021 – 2032

   9.3.6.3.3 Video Conferencing Market Size & Forecast, By End-Use, 2021 – 2032

   9.3.6.3.4 Video Conferencing Market Size & Forecast, By Deployment, 2021 – 2032

  9.3.6.4 Italy

   9.3.6.4.1 Video Conferencing Market Size & Forecast, By Component, 2021 – 2032

   9.3.6.4.2 Video Conferencing Market Size & Forecast, By Application, 2021 – 2032

   9.3.6.4.3 Video Conferencing Market Size & Forecast, By End-Use, 2021 – 2032

   9.3.6.4.4 Video Conferencing Market Size & Forecast, By Deployment, 2021 – 2032

  9.3.6.5 Spain

   9.3.6.5.1 Video Conferencing Market Size & Forecast, By Component, 2021 – 2032

   9.3.6.5.2 Video Conferencing Market Size & Forecast, By Application, 2021 – 2032

   9.3.6.5.3 Video Conferencing Market Size & Forecast, By End-Use, 2021 – 2032

   9.3.6.5.4 Video Conferencing Market Size & Forecast, By Deployment, 2021 – 2032

  9.3.6.6 Russia

   9.3.6.6.1 Video Conferencing Market Size & Forecast, By Component, 2021 – 2032

   9.3.6.6.2 Video Conferencing Market Size & Forecast, By Application, 2021 – 2032

   9.3.6.6.3 Video Conferencing Market Size & Forecast, By End-Use, 2021 – 2032

   9.3.6.6.4 Video Conferencing Market Size & Forecast, By Deployment, 2021 – 2032

  9.3.6.7 Poland

   9.3.6.7.1 Video Conferencing Market Size & Forecast, By Component, 2021 – 2032

   9.3.6.7.2 Video Conferencing Market Size & Forecast, By Application, 2021 – 2032

   9.3.6.7.3 Video Conferencing Market Size & Forecast, By End-Use, 2021 – 2032

   9.3.6.7.4 Video Conferencing Market Size & Forecast, By Deployment, 2021 – 2032

  9.3.6.8 Rest of Europe

   9.3.6.8.1 Video Conferencing Market Size & Forecast, By Component, 2021 – 2032

   9.3.6.8.2 Video Conferencing Market Size & Forecast, By Application, 2021 – 2032

   9.3.6.8.3 Video Conferencing Market Size & Forecast, By End-Use, 2021 – 2032

   9.3.6.8.4 Video Conferencing Market Size & Forecast, By Deployment, 2021 – 2032   

9.4 Asia-Pacific

 9.4.1 Key Trends

 9.4.2 Video Conferencing Market Size & Forecast, By Component, 2021 – 2032

 9.4.3 Video Conferencing Market Size & Forecast, By Application, 2021 – 2032

 9.4.4 Video Conferencing Market Size & Forecast, By End-Use, 2021 – 2032

 9.4.5 Video Conferencing Market Size & Forecast, By Deployment, 2021 – 2032

 9.4.6 Video Conferencing Market Size & Forecast, By Country, 2021 – 2032

  9.4.6.1 China

   9.4.6.1.1 Video Conferencing Market Size & Forecast, By Component, 2021 – 2032

   9.4.6.1.2 Video Conferencing Market Size & Forecast, By Application, 2021 – 2032

   9.4.6.1.3 Video Conferencing Market Size & Forecast, By End-Use, 2021 – 2032

   9.4.6.1.4 Video Conferencing Market Size & Forecast, By Deployment, 2021 – 2032

  9.4.6.2 India

   9.4.6.2.1 Video Conferencing Market Size & Forecast, By Component, 2021 – 2032

   9.4.6.2.2 Video Conferencing Market Size & Forecast, By Application, 2021 – 2032

   9.4.6.2.3 Video Conferencing Market Size & Forecast, By End-Use, 2021 – 2032

   9.4.6.2.4 Video Conferencing Market Size & Forecast, By Deployment, 2021 – 2032

  9.4.6.3 Japan

   9.4.6.3.1 Video Conferencing Market Size & Forecast, By Component, 2021 – 2032

   9.4.6.3.2 Video Conferencing Market Size & Forecast, By Application, 2021 – 2032

   9.4.6.3.3 Video Conferencing Market Size & Forecast, By End-Use, 2021 – 2032

   9.4.6.3.4 Video Conferencing Market Size & Forecast, By Deployment, 2021 – 2032

  9.4.6.4 South Korea

   9.4.6.4.1 Video Conferencing Market Size & Forecast, By Component, 2021 – 2032

   9.4.6.4.2 Video Conferencing Market Size & Forecast, By Application, 2021 – 2032

   9.4.6.4.3 Video Conferencing Market Size & Forecast, By End-Use, 2021 – 2032

   9.4.6.4.4 Video Conferencing Market Size & Forecast, By Deployment, 2021 – 2032

  9.4.6.5 Australia

   9.4.6.5.1 Video Conferencing Market Size & Forecast, By Component, 2021 – 2032

   9.4.6.5.2 Video Conferencing Market Size & Forecast, By Application, 2021 – 2032

   9.4.6.5.3 Video Conferencing Market Size & Forecast, By End-Use, 2021 – 2032

   9.4.6.5.4 Video Conferencing Market Size & Forecast, By Deployment, 2021 – 2032

  9.4.6.6 ASEAN Countries

   9.4.6.6.1 Video Conferencing Market Size & Forecast, By Component, 2021 – 2032

   9.4.6.6.2 Video Conferencing Market Size & Forecast, By Application, 2021 – 2032

   9.4.6.6.3 Video Conferencing Market Size & Forecast, By End-Use, 2021 – 2032

   9.4.6.6.4 Video Conferencing Market Size & Forecast, By Deployment, 2021 – 2032

  9.4.6.7 Rest of Asia-Pacific

   9.4.6.7.1 Video Conferencing Market Size & Forecast, By Component, 2021 – 2032

   9.4.6.7.2 Video Conferencing Market Size & Forecast, By Application, 2021 – 2032

   9.4.6.7.3 Video Conferencing Market Size & Forecast, By End-Use, 2021 – 2032

   9.4.6.7.4 Video Conferencing Market Size & Forecast, By Deployment, 2021 – 2032

9.5 Latin America

 9.5.1 Key Trends

 9.5.2 Video Conferencing Market Size & Forecast, By Component, 2021 – 2032

 9.5.3 Video Conferencing Market Size & Forecast, By Application, 2021 – 2032

 9.5.4 Video Conferencing Market Size & Forecast, By End-Use, 2021 – 2032

 9.5.5 Video Conferencing Market Size & Forecast, By Deployment, 2021 – 2032

 9.5.6 Video Conferencing Market Size & Forecast, By Country, 2021 – 2032

  9.5.6.1 Brazil

   9.5.6.1.1 Video Conferencing Market Size & Forecast, By Component, 2021 – 2032

   9.5.6.1.2 Video Conferencing Market Size & Forecast, By Application, 2021 – 2032

   9.5.6.1.3 Video Conferencing Market Size & Forecast, By End-Use, 2021 – 2032

   9.5.6.1.4 Video Conferencing Market Size & Forecast, By Deployment, 2021 – 2032

  9.5.6.2 Argentina

   9.5.6.2.1 Video Conferencing Market Size & Forecast, By Component, 2021 – 2032

   9.5.6.2.2 Video Conferencing Market Size & Forecast, By Application, 2021 – 2032

   9.5.6.2.3 Video Conferencing Market Size & Forecast, By End-Use, 2021 – 2032

   9.5.6.2.4 Video Conferencing Market Size & Forecast, By Deployment, 2021 – 2032

  9.5.6.3 Mexico

   9.5.6.3.1 Video Conferencing Market Size & Forecast, By Component, 2021 – 2032

   9.5.6.3.2 Video Conferencing Market Size & Forecast, By Application, 2021 – 2032

   9.5.6.3.3 Video Conferencing Market Size & Forecast, By End-Use, 2021 – 2032

   9.5.6.3.4 Video Conferencing Market Size & Forecast, By Deployment, 2021 – 2032

  9.5.6.4 Colombia

   9.5.6.4.1 Video Conferencing Market Size & Forecast, By Component, 2021 – 2032

   9.5.6.4.2 Video Conferencing Market Size & Forecast, By Application, 2021 – 2032

   9.5.6.4.3 Video Conferencing Market Size & Forecast, By End-Use, 2021 – 2032

   9.5.6.4.4 Video Conferencing Market Size & Forecast, By Deployment, 2021 – 2032

  9.5.6.5 Rest of Latin America

   9.5.6.5.1 Video Conferencing Market Size & Forecast, By Component, 2021 – 2032

   9.5.6.5.2 Video Conferencing Market Size & Forecast, By Application, 2021 – 2032

   9.5.6.5.3 Video Conferencing Market Size & Forecast, By End-Use, 2021 – 2032

   9.5.6.5.4 Video Conferencing Market Size & Forecast, By Deployment, 2021 – 2032

9.6 Middle East & Africa

 9.6.1 Key Trends

 9.6.2 Video Conferencing Market Size & Forecast, By Component, 2021 – 2032

 9.6.3 Video Conferencing Market Size & Forecast, By Application, 2021 – 2032

 9.6.4 Video Conferencing Market Size & Forecast, By End-Use, 2021 – 2032

 9.6.5 Video Conferencing Market Size & Forecast, By Deployment, 2021 – 2032

 9.6.6 Video Conferencing Market Size & Forecast, By Country, 2021 – 2032

  9.6.6.1 UAE

   9.6.6.1.1 Video Conferencing Market Size & Forecast, By Component, 2021 – 2032

   9.6.6.1.2 Video Conferencing Market Size & Forecast, By Application, 2021 – 2032

   9.6.6.1.3 Video Conferencing Market Size & Forecast, By End-Use, 2021 – 2032

   9.6.6.1.4 Video Conferencing Market Size & Forecast, By Deployment, 2021 – 2032

  9.6.6.2 Saudi Arabia

   9.6.6.2.1 Video Conferencing Market Size & Forecast, By Component, 2021 – 2032

   9.6.6.2.2 Video Conferencing Market Size & Forecast, By Application, 2021 – 2032

   9.6.6.2.3 Video Conferencing Market Size & Forecast, By End-Use, 2021 – 2032

   9.6.6.2.4 Video Conferencing Market Size & Forecast, By Deployment, 2021 – 2032

  9.6.6.3 Qatar

   9.6.6.3.1 Video Conferencing Market Size & Forecast, By Component, 2021 – 2032

   9.6.6.3.2 Video Conferencing Market Size & Forecast, By Application, 2021 – 2032

   9.6.6.3.3 Video Conferencing Market Size & Forecast, By End-Use, 2021 – 2032

   9.6.6.3.4 Video Conferencing Market Size & Forecast, By Deployment, 2021 – 2032

  9.6.6.4 Egypt

   9.6.6.4.1 Video Conferencing Market Size & Forecast, By Component, 2021 – 2032

   9.6.6.4.2 Video Conferencing Market Size & Forecast, By Application, 2021 – 2032

   9.6.6.4.3 Video Conferencing Market Size & Forecast, By End-Use, 2021 – 2032

   9.6.6.4.4 Video Conferencing Market Size & Forecast, By Deployment, 2021 – 2032

  9.6.6.5 South Africa

   9.6.6.5.1 Video Conferencing Market Size & Forecast, By Component, 2021 – 2032

   9.6.6.5.2 Video Conferencing Market Size & Forecast, By Application, 2021 – 2032

   9.6.6.5.3 Video Conferencing Market Size & Forecast, By End-Use, 2021 – 2032

   9.6.6.5.4 Video Conferencing Market Size & Forecast, By Deployment, 2021 – 2032

  9.6.6.6 Rest of Middle East & Africa

   9.6.6.6.1 Video Conferencing Market Size & Forecast, By Component, 2021 – 2032

   9.6.6.6.2 Video Conferencing Market Size & Forecast, By Application, 2021 – 2032

   9.6.6.6.3 Video Conferencing Market Size & Forecast, By End-Use, 2021 – 2032

   9.6.6.6.4 Video Conferencing Market Size & Forecast, By Deployment, 2021 – 2032

10. Competitive Landscape

 10.1 Key Players' Positioning

 10.2 Competitive Developments

  10.2.1 Key Strategies Adopted (%), By Key Players, 2024

  10.2.2 Year-Wise Strategies & Development, 2021 – 2025

  10.2.3 Number of Strategies Adopted by Key Players, 2024

 10.3 Market Share Analysis, 2024

 10.4 Product/Service & Application Benchmarking

  10.4.1 Product/Service Specifications & Features By Key Players

  10.4.2 Product/Service Heatmap By Key Players

  10.4.3 Application Heatmap By Key Players

 10.5 Industry Start-Up & Innovation Landscape

 10.6 Key Company Profiles

10.6 Key Company Profiles

 10.6.1 Zoom Video Communications

  10.6.1.1 Company Overview & Snapshot

  10.6.1.2 Product/Service Portfolio

  10.6.1.3 Key Company Financials

  10.6.1.4 SWOT Analysis

 10.6.2 Microsoft

  10.6.2.1 Company Overview & Snapshot

  10.6.2.2 Product/Service Portfolio

  10.6.2.3 Key Company Financials

  10.6.2.4 SWOT Analysis

 10.6.3 Cisco Systems

  10.6.3.1 Company Overview & Snapshot

  10.6.3.2 Product/Service Portfolio

  10.6.3.3 Key Company Financials

  10.6.3.4 SWOT Analysis

 10.6.4 Google

  10.6.4.1 Company Overview & Snapshot

  10.6.4.2 Product/Service Portfolio

  10.6.4.3 Key Company Financials

  10.6.4.4 SWOT Analysis

 10.6.5 GoTo

  10.6.5.1 Company Overview & Snapshot

  10.6.5.2 Product/Service Portfolio

  10.6.5.3 Key Company Financials

  10.6.5.4 SWOT Analysis

 10.6.6 RingCentral

  10.6.6.1 Company Overview & Snapshot

  10.6.6.2 Product/Service Portfolio

  10.6.6.3 Key Company Financials

  10.6.6.4 SWOT Analysis

 10.6.7 BlueJeans Network

  10.6.7.1 Company Overview & Snapshot

  10.6.7.2 Product/Service Portfolio

  10.6.7.3 Key Company Financials

  10.6.7.4 SWOT Analysis

 10.6.8 Lifesize

  10.6.8.1 Company Overview & Snapshot

  10.6.8.2 Product/Service Portfolio

  10.6.8.3 Key Company Financials

  10.6.8.4 SWOT Analysis

 10.6.9 Pexip

  10.6.9.1 Company Overview & Snapshot

  10.6.9.2 Product/Service Portfolio

  10.6.9.3 Key Company Financials

  10.6.9.4 SWOT Analysis

 10.6.10 Logitech

  10.6.10.1 Company Overview & Snapshot

  10.6.10.2 Product/Service Portfolio

  10.6.10.3 Key Company Financials

  10.6.10.4 SWOT Analysis

 10.6.11 Polycom

  10.6.11.1 Company Overview & Snapshot

  10.6.11.2 Product/Service Portfolio

  10.6.11.3 Key Company Financials

  10.6.11.4 SWOT Analysis

 10.6.12 Avaya

  10.6.12.1 Company Overview & Snapshot

  10.6.12.2 Product/Service Portfolio

  10.6.12.3 Key Company Financials

  10.6.12.4 SWOT Analysis

 10.6.13 Adobe

  10.6.13.1 Company Overview & Snapshot

  10.6.13.2 Product/Service Portfolio

  10.6.13.3 Key Company Financials

  10.6.13.4 SWOT Analysis

 10.6.14 Huawei

  10.6.14.1 Company Overview & Snapshot

  10.6.14.2 Product/Service Portfolio

  10.6.14.3 Key Company Financials

  10.6.14.4 SWOT Analysis

 10.6.15 Jitsi

  10.6.15.1 Company Overview & Snapshot

  10.6.15.2 Product/Service Portfolio

  10.6.15.3 Key Company Financials

  10.6.15.4 SWOT Analysis

 10.6.16 8x8

  10.6.16.1 Company Overview & Snapshot

  10.6.16.2 Product/Service Portfolio

  10.6.16.3 Key Company Financials

  10.6.16.4 SWOT Analysis

 10.6.17 ZoomInfo

  10.6.17.1 Company Overview & Snapshot

  10.6.17.2 Product/Service Portfolio

  10.6.17.3 Key Company Financials

  10.6.17.4 SWOT Analysis

 10.6.18 GoToWebinar

  10.6.18.1 Company Overview & Snapshot

  10.6.18.2 Product/Service Portfolio

  10.6.18.3 Key Company Financials

  10.6.18.4 SWOT Analysis

 10.6.19 Join.me

  10.6.19.1 Company Overview & Snapshot

  10.6.19.2 Product/Service Portfolio

  10.6.19.3 Key Company Financials

  10.6.19.4 SWOT Analysis

 10.6.20 VSee

  10.6.20.1 Company Overview & Snapshot

  10.6.20.2 Product/Service Portfolio

  10.6.20.3 Key Company Financials

  10.6.20.4 SWOT Analysis

11. Analyst Recommendations

 11.1 SNS Insider Opportunity Map

 11.2 Industry Low-Hanging Fruit Assessment

 11.3 Market Entry & Growth Strategy

 11.4 Analyst Viewpoint & Suggestions On Market Growth

12. Assumptions

13. Disclaimer

14. Appendix

 14.1 List Of Tables

 14.2 List Of Figures

Key Segments:

By Component

  • Hardware

  • Camera

  • Microphone/Headphone

  • Others

  • Software

  • Service

 By Deployment

  • On-premise

  • Cloud

By Application

  • Consumer

  • Enterprise

  • Large Enterprise

  • Small & Medium Enterprises (SMEs)

By End-Use

  • Corporate

  • Education

  • Healthcare

  • Government & Defense

  • BFSI

  • Media & Entertainment

  • Others

Request for Segment Customization as per your Business Requirement: Segment Customization Request

REGIONAL COVERAGE:

North America

  • US

  • Canada

  • Mexico

Europe

  • Eastern Europe

    • Poland

    • Romania

    • Hungary

    • Turkey

    • Rest of Eastern Europe

  • Western Europe

    • Germany

    • France

    • UK

    • Italy

    • Spain

    • Netherlands

    • Switzerland

    • Austria

    • Rest of Western Europe

Asia Pacific

  • China

  • India

  • Japan

  • South Korea

  • Vietnam

  • Singapore

  • Australia

  • Rest of Asia Pacific

Middle East & Africa

  • Middle East

    • UAE

    • Egypt

    • Saudi Arabia

    • Qatar

    • Rest of the Middle East

  • Africa

    • Nigeria

    • South Africa

    • Rest of Africa

Latin America

  • Brazil

  • Argentina

  • Colombia

Request for Country Level Research Report: Country Level Customization Request

Available Customization

With the given market data, SNS Insider offers customization as per the company’s specific needs. The following customization options are available for the report:

  • Product Analysis

  • Criss-Cross segment analysis (e.g. Product X Application)

  • Product Matrix which gives a detailed comparison of product portfolio of each company

  • Geographic Analysis

  • Additional countries in any of the regions

  • Company Information

  • Detailed analysis and profiling of additional market players (Up to five)

An accurate research report requires proper strategizing as well as implementation. There are multiple factors involved in the completion of good and accurate research report and selecting the best methodology to compete the research is the toughest part. Since the research reports we provide play a crucial role in any company’s decision-making process, therefore we at SNS Insider always believe that we should choose the best method which gives us results closer to reality. This allows us to reach at a stage wherein we can provide our clients best and accurate investment to output ratio.

Each report that we prepare takes a timeframe of 350-400 business hours for production. Starting from the selection of titles through a couple of in-depth brain storming session to the final QC process before uploading our titles on our website we dedicate around 350 working hours. The titles are selected based on their current market cap and the foreseen CAGR and growth.


The 5 steps process:

Step 1: Secondary Research:

Secondary Research or Desk Research is as the name suggests is a research process wherein, we collect data through the readily available information. In this process we use various paid and unpaid databases which our team has access to and gather data through the same. This includes examining of listed companies’ annual reports, Journals, SEC filling etc. Apart from this our team has access to various associations across the globe across different industries. Lastly, we have exchange relationships with various university as well as individual libraries.

Secondary Research

Step 2: Primary Research

When we talk about primary research, it is a type of study in which the researchers collect relevant data samples directly, rather than relying on previously collected data.  This type of research is focused on gaining content specific facts that can be sued to solve specific problems. Since the collected data is fresh and first hand therefore it makes the study more accurate and genuine.

We at SNS Insider have divided Primary Research into 2 parts.

Part 1 wherein we interview the KOLs of major players as well as the upcoming ones across various geographic regions. This allows us to have their view over the market scenario and acts as an important tool to come closer to the accurate market numbers. As many as 45 paid and unpaid primary interviews are taken from both the demand and supply side of the industry to make sure we land at an accurate judgement and analysis of the market.

This step involves the triangulation of data wherein our team analyses the interview transcripts, online survey responses and observation of on filed participants. The below mentioned chart should give a better understanding of the part 1 of the primary interview.

Primary Research

Part 2: In this part of primary research the data collected via secondary research and the part 1 of the primary research is validated with the interviews from individual consultants and subject matter experts.

Consultants are those set of people who have at least 12 years of experience and expertise within the industry whereas Subject Matter Experts are those with at least 15 years of experience behind their back within the same space. The data with the help of two main processes i.e., FGDs (Focused Group Discussions) and IDs (Individual Discussions). This gives us a 3rd party nonbiased primary view of the market scenario making it a more dependable one while collation of the data pointers.

Step 3: Data Bank Validation

Once all the information is collected via primary and secondary sources, we run that information for data validation. At our intelligence centre our research heads track a lot of information related to the market which includes the quarterly reports, the daily stock prices, and other relevant information. Our data bank server gets updated every fortnight and that is how the information which we collected using our primary and secondary information is revalidated in real time.

Data Bank Validation

Step 4: QA/QC Process

After all the data collection and validation our team does a final level of quality check and quality assurance to get rid of any unwanted or undesired mistakes. This might include but not limited to getting rid of the any typos, duplication of numbers or missing of any important information. The people involved in this process include technical content writers, research heads and graphics people. Once this process is completed the title gets uploader on our platform for our clients to read it.

Step 5: Final QC/QA Process:

This is the last process and comes when the client has ordered the study. In this process a final QA/QC is done before the study is emailed to the client. Since we believe in giving our clients a good experience of our research studies, therefore, to make sure that we do not lack at our end in any way humanly possible we do a final round of quality check and then dispatch the study to the client.