Advanced Visualization Market Report Scope & Overview:
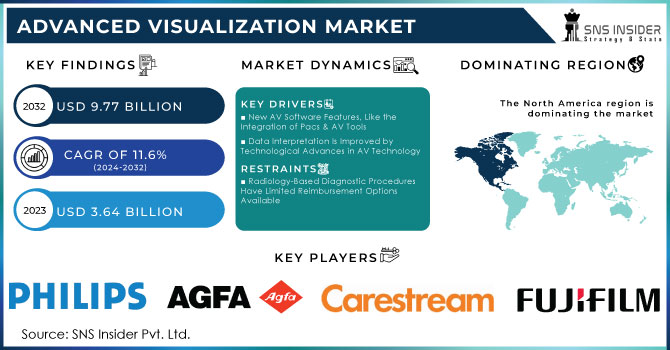
The Advanced Visualization Market was valued at USD 3.64 Billion in 2023 and it is projected to reach USD 9.77 Billion by 2032, registering a compound annual growth rate (CAGR) of 11.6% from 2024 to 2032.
A contemporary diagnostic technology called advanced visualization gives the user access to a visualization platform, which fundamentally produces improved imaging and imaging procedure functionalities. The data produced can be modified to meet the needs of the doctors, which improves the quality of understanding and the efficacy of healthcare products.
The essential component of improved visualization is medical equipment with cutting-edge software that effectively displays a variety of features of living cells, enabling better illness diagnosis. A business intelligence (BI) tool is used in advanced visualization, a new generation of technology that enables users to see improved image quality. It is primarily beneficial to healthcare professionals because it enables a better knowledge of clinical problems, which leads to high-quality healthcare facilities at lower prices.
Advanced Visualization Market Size and Forecast
-
Market Size in 2023: USD 3.64 Billion
-
Market Size by 2032: USD 9.77 Billion
-
CAGR: 11.6% from 2024 to 2032
-
Base Year: 2023
-
Forecast Period: 2024–2032
-
Historical Data: 2020–2023
Get more information on Advanced Visualization Market - Request Sample Report
Advanced Visualization Market Trends
-
Rising adoption of advanced visualization in healthcare is accelerating market growth, with over 65% of large hospitals implementing 3D and 4D imaging tools for diagnostics and surgical planning.
-
Increasing demand for minimally invasive procedures is boosting usage of advanced imaging software, contributing to a projected CAGR of over 8–10% in the coming years.
-
Integration of AI-powered visualization platforms is improving diagnostic accuracy by 20–30%, particularly in oncology and cardiology applications.
-
Expansion of cloud-based visualization solutions is growing rapidly, with more than 55% of new deployments supporting remote access and tele-radiology services.
-
Rising healthcare digitization and PACS integration are strengthening adoption, as over 70% of healthcare facilities now utilize advanced imaging informatics systems.
MARKET DYNAMICS
DRIVERS
-
New AV Software Features, Like the Integration of Pacs & AV Tools
-
Data Interpretation Is Improved by Technological Advances in AV Technology
-
Increased Geriatric Population and Increasing Prevalence of Target Diseases
-
Diagnosis of Disease Must Be Effective and Early
-
Increasing Knowledge of the Advantages AV Tools Offer in Disease Diagnosis
RESTRAINTS
-
Radiology-Based Diagnostic Procedures Have Limited Reimbursement Options Available
-
Limitations of Current AV Analysis Due to Technology
OPPORTUNITIES
-
Utilizing AV Solutions with Mobile Devices
-
Developing nations
CHALLENGES
-
Financial Restraints in Hospitals in Mature Markets
IMPACT OF COVID-19
The COVID-19 period starting in Q2 had a detrimental impact on the market for advanced visualization. It had a profoundly unfavorable effect on the adoption of next-generation navigation and visualization technologies and radically changed the direction of surgical visualization and navigation technology. Additionally, COVID-19 began to spread at the end of 2019 and has had an impact on every area of the economy.
Due to the statewide lockdown, there was a drop in hardware and software services, and there was less of a need for enhanced visualization of chronic conditions. No geriatric or chronic disease patients visited hospitals in the first quarter of 2020. Limited manufacturing innovations in the advanced visualization market due to the COVID-19 investment shift caused by the increase in COVID-19 instances.
But the market growth of advanced visualization has been favorably impacted during the remainder of 2020. Due to the growing demand, research and development efforts on visualization systems have been doubled. The use of cutting-edge technologies for demonstrating a variety of characteristics of Lang cell efficiency has also increased. In pathological laboratories, these systems are frequently employed for a variety of clinical purposes. As a result, the market is anticipated to grow more strongly during the forecast period.
Market Segmentation
By Products & Service
-
Hardware & Software
-
Services
The global market for advanced viewing is divided into two categories: Hardware and software, and services (continuously divided into implementation, after sales and refinement, consultation / performance, and training and learning services). Due to features such as the development of sophisticated technical software, the growing use of AV solutions in hospitals and diagnostic centers to improve operational efficiency, and the growing popularity of AV solutions due to its ease of integration into PACS, hardware and software. the segment is expected to hold the largest share in the market.
By Type of Solution
-
Enterprise-Wide Thin Client-Based Solutions
-
Standalone Workstation-Based Solutions
Broad-based business-oriented and independent workplace solutions form two divisions in the global market for advanced visibility. The market segment that is expected to have the largest share is expected to be business-oriented solutions based on customers and domains only. The critical market share of this category may be due to a number of factors, including the benefits provided by increased data storage capacity, data transfer capacity, multi-user interaction, faster analysis, and mid-term post-processing solutions.
By Clinical Application
-
Radiology/Interventional Radiology
-
Cardiology
-
Orthopedics
-
Oncology
-
Vascular
-
Neurology
With clinical use, it is divided into radiology / interventional radiology, cardiology, orthopedics, cancer, vascular, neurology, and other clinical areas (including obstetrics / gynecology, urology, pulmonary, and gastrointestinal). Due to the growing market popularity of changing processes and the inclusion of digital radiology diagnostics, the growing market acceptance of AV software, and the growing acceptance of AV solutions in the departments of radiology, the radiology / interventional radiology component is expected to hold the largest share.
By Application
-
Magnetic Resonance Imaging (MRI)
-
Computed Tomography (CT)
-
Positron Emission Tomography (PET)
-
Ultrasound
-
Radiotherapy (RT)
By End User
-
Hospitals, and Surgical Centers
-
Imaging Centers
-
Academic and Research Centers
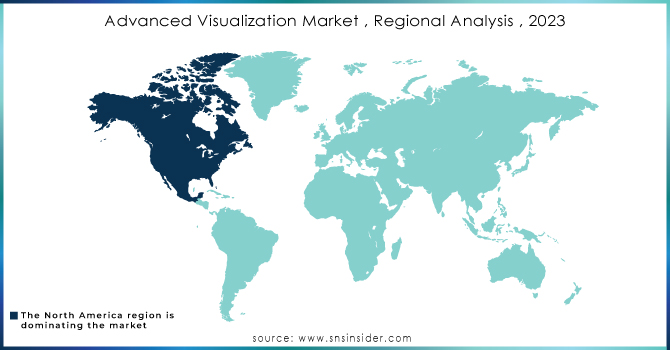
REGIONAL ANALYSIS
The advanced visualization industry is predicted to be dominated by North America. The commercialization of cutting-edge diagnostic goods, the U.S. and Canada's strong R&D infrastructure, and the high prevalence of target diseases are the reasons that are fueling the expansion of the market for advanced visualization products in the area. The fastest CAGR is predicted for the Asia Pacific region due to the region's rapid expansion of healthcare infrastructure, rising public awareness of the advantages of advanced diagnostic techniques in the effective management of disease, and rising market penetration of advanced diagnostic technologies.
Need any customization research on Advanced Visualization Market - Enquiry Now
REGIONAL COVERAGE:
-
North America
-
USA
-
Canada
-
Mexico
-
-
Europe
-
Germany
-
UK
-
France
-
Italy
-
Spain
-
The Netherlands
-
Rest of Europe
-
-
Asia-Pacific
-
Japan
-
south Korea
-
China
-
India
-
Australia
-
Rest of Asia-Pacific
-
-
The Middle East & Africa
-
Israel
-
UAE
-
South Africa
-
Rest of Middle East & Africa
-
-
Latin America
-
Brazil
-
Argentina
-
Rest of Latin America
-
KEY PLAYERS:
The major key players are Agfa HealthCare NV, Carestream Health, Inc., Fujifilm Holdings Corporation, General Electric Company, Koninklijke Philips N.V., Terarecon, Inc., Siemens AG, Visage Imaging, Inc., Qi Imaging, Toshiba Corporation and other players.
| Report Attributes | Details |
|---|---|
| Market Size in 2023 | US$ 3.64 Billion |
| Market Size by 2032 | US$ 9.77 Billion |
| CAGR | CAGR of 11.6% From 2024 to 2032 |
| Base Year | 2023 |
| Forecast Period | 2024-2032 |
| Historical Data | 2020-2022 |
| Report Scope & Coverage | Market Size, Segments Analysis, Competitive Landscape, Regional Analysis, DROC & SWOT Analysis, Forecast Outlook |
| Key Segments | • By Products & Service (Hardware & Software, Services) • By Type of Solution (Enterprise-Wide Thin Client-Based Solutions, Standalone Workstation-Based Solutions) • By Application (Magnetic Resonance Imaging (MRI), Computed Tomography (CT), Positron Emission Tomography (PET), Ultrasound, Radiotherapy (RT), Nuclear Medicine) • By Clinical Application (Radiology/Interventional Radiology, Cardiology, Orthopedics, Oncology, Vascular, Neurology) • By End User (Hospitals, and Surgical Centers, Imaging Centers, Academic and Research Centers) |
| Regional Analysis/Coverage | North America (USA, Canada, Mexico), Europe (Germany, UK, France, Italy, Spain, Netherlands, Rest of Europe), Asia-Pacific (Japan, South Korea, China, India, Australia, Rest of Asia-Pacific), The Middle East & Africa (Israel, UAE, South Africa, Rest of Middle East & Africa), Latin America (Brazil, Argentina, Rest of Latin America) |
| Company Profiles | Agfa HealthCare NV, Carestream Health, Inc., Fujifilm Holdings Corporation, General Electric Company, Koninklijke Philips N.V., Terarecon, Inc., Siemens AG, Visage Imaging, Inc., Qi Imaging, Toshiba Corporation. |
| Key Drivers | • New AV Software Features, Like the Integration of Pacs & AV Tools • Data Interpretation Is Improved by Technological Advances in AV Technology • Increased Geriatric Population and Increasing Prevalence of Target Diseases |
| Restraints | • Radiology-Based Diagnostic Procedures Have Limited Reimbursement Options Available • Limitations of Current AV Analysis Due to Technology |
Frequently Asked Questions
Increased Geriatric Population and Increasing Prevalence of Target Diseases, Diagnosis of Disease Must Be Effective and Early are the key drivers of the Advanced Visualization market.
The advanced visualization industry is predicted to be dominated by North America.
Agfa HealthCare NV, Carestream Health, Inc., Fujifilm Holdings Corporation, General Electric Company, Koninklijke Philips N.V are the key players of Advanced Visualization market
Ans: The Advanced Visualization Market is growing at a CAGR of 11.6% over the forecast period 2024-2032.
Ans: The Advanced Visualization Market Size was valued at USD 3.64 billion in 2023.
Get in Touch
