Business Intelligence Market Report Scope & overview:
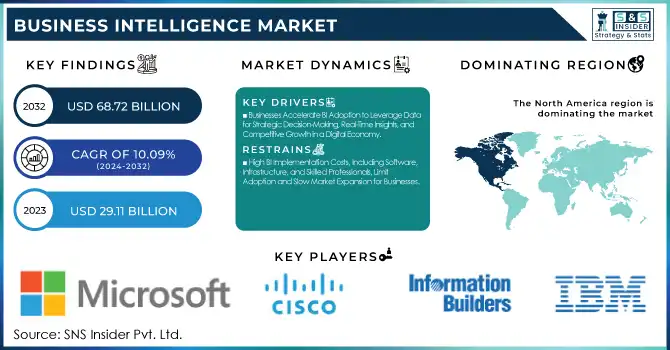
The Business Intelligence Market was valued at USD 29.11 billion in 2023 and is expected to reach USD 68.72 billion by 2032, growing at a CAGR of 10.09% from 2024-2032. This report covers the adoption of emerging technologies, investment trends, user behavior, regional incidence of cybersecurity events, and their impact on decision-making. The growing dependence on data-powered marketing is driving growth, as businesses turn to AI, analytics, and cloud solutions to refine operations. Investments are driven by increasing cybersecurity concerns and maturing user demand, and regional trends affirm differences in technological and maturity levels and risk management practices.
Get More Information on Business Intelligence Market - Request Sample Report
Market Dynamics
Drivers
-
Businesses Accelerate BI Adoption to Leverage Data for Strategic Decision-Making, Real-Time Insights, and Competitive Growth in a Digital Economy
Enterprises are increasingly embracing business intelligence to tap the true potential of data for making strategic decisions. The volume of structured and unstructured data created by a firm puts a need to get meaningful insights. Advanced analytics, powerful visualization, and AI-based BI solutions allow organizations to recognize trends, optimize processes and processes, and improve customers' engagement. Real-time processing of data improves the accuracy of forecasting, risk management, and overall efficiency. Digital transformation and automation across industries would further accelerate the adoption of BI, as companies can make fast data-driven decisions. When data volumes are continuously being created, BI tools have become an absolute necessity for businesses to obtain agility, growth, and sustain long-term success in a data-driven economy.
Restraints
-
High BI Implementation Costs, Including Software, Infrastructure, and Skilled Professionals, Limit Adoption and Slow Market Expansion for Businesses.
One of the biggest challenges in the implementation of Business Intelligence for an organization is the high investment it requires. Advanced software, cloud infrastructure, data storage, and skilled professionals can be too expensive for small and medium-sized enterprises. Besides these costs, maintenance, upgrade, and training expenses of the system also incur continuous expenses. Due to such costs, most businesses cannot afford to adopt BI, and the use of data-driven insights remains unexploited. The cloud-based and self-service BI solutions aim to lower the costs but still are not a result of the initial investment, limiting market growth. Thus, overcoming the barrier calls for cost-effective deployment models and scalable solutions that enhance accessibility in various industries.
Opportunities
-
AI and Machine Learning Enhance BI with Automation, Predictive Analytics, and Real-Time Insights, Driving Innovation and Business Growth.
Business Intelligence is transforming with AI and machine learning integration, offering deeper insights, automation, and predictive analytics. Organizations are now using AI-driven BI tools to process vast amounts of structured and unstructured data, hidden patterns, and enhanced real-time decision-making. The accuracy of forecasts, operations, and personalized business recommendations is optimized by machine learning algorithms. It reduces manual effort, enhances efficiency, and provides a competitive advantage to businesses. Increasing levels of AI have been making various companies across several industries embrace the intelligent BI for innovation, to streamline workflows and maximize profitability. The growing need for AI analytics is unlocking BI market expansion through new opportunities.
Challenges
-
Inconsistent and Unstructured Data Reduces BI Accuracy, Leading to Integration Issues, Poor Analytics, and Flawed Decision-Making for Businesses.
Business Intelligence solutions rely on high-quality, well-integrated data to generate accurate and actionable insights. However, many organizations struggle with inconsistent, incomplete, and unstructured data from multiple sources, leading to inaccurate analytics and flawed decision-making. Integrating data from legacy systems, third-party applications, and diverse formats often results in discrepancies, duplication, and inefficiencies. Poor data governance and a lack of standardization further complicate the process, reducing the reliability of BI outputs. Without robust data cleansing, validation, and integration mechanisms, businesses face difficulties in fully leveraging BI capabilities. Ensuring high data quality and seamless integration is crucial for organizations aiming to maximize the value of their BI investments and drive strategic growth.
Segment Analysis
By Component
The Solution segment dominated the Business Intelligence Market with a 69% revenue share in 2023, driven by the increasing adoption of AI-powered analytics, data visualization tools, and self-service BI platforms. Businesses prioritize BI solutions to enhance decision-making, automate processes, and gain competitive insights.
The Services segment is expected to grow at the fastest CAGR of 11.67% from 2024-2032, due to rising demand for consulting, integration, and managed services. Organizations seek expert support for seamless BI implementation, customization, and optimization, boosting service adoption.
By Deployment Mode
The On-premises segment dominated the Business Intelligence Market with a 52% revenue share in 2023, primarily due to greater data security, compliance requirements, and control over infrastructure. Large enterprises and regulated industries prefer on-premises BI solutions to safeguard sensitive information and ensure seamless system integration.
The Cloud segment is expected to grow at the fastest CAGR of 10.60% from 2024-2032, due to its scalability, cost efficiency, and ease of deployment. The shift toward remote work and real-time data access further accelerates cloud BI adoption.
By Organization Size
The Large Enterprises segment dominated the Business Intelligence (BI) Market with a 64% revenue share in 2023, driven by their extensive data needs, advanced analytics adoption, and substantial IT budgets. Large organizations leverage BI for strategic decision-making, operational efficiency, and competitive advantage.
The Small and Medium-sized Enterprises segment is expected to grow at the fastest CAGR of 11.12% from 2024-2032 due to increasing awareness of data-driven decision-making, cost-effective cloud BI solutions, and the rising adoption of self-service analytics tools.
By End Use
The BFSI segment dominated the Business Intelligence Market with a 25% revenue share in 2023, driven by the industry's need for fraud detection, risk management, regulatory compliance, and customer analytics. Financial institutions leverage BI to optimize operations, enhance security, and improve decision-making.
The Healthcare segment is expected to grow at the fastest CAGR of 12.82% from 2024-2032 due to the rising demand for data-driven patient care, predictive analytics, and operational efficiency. BI adoption in healthcare is accelerating with advancements in AI-driven diagnostics and personalized treatment planning.
By Business Function
The Finance segment dominated the Business Intelligence Market with a 32% revenue share in 2023, driven by the need for financial planning, risk assessment, fraud detection, and regulatory compliance. Organizations rely on BI to analyze financial data, optimize budgeting, and enhance decision-making.
The Human Resource segment is expected to grow at the fastest CAGR of 11.75% from 2024-2032 due to the increasing adoption of BI for workforce analytics, talent management, performance tracking, and employee engagement strategies, improving HR efficiency and decision-making.
Regional Analysis
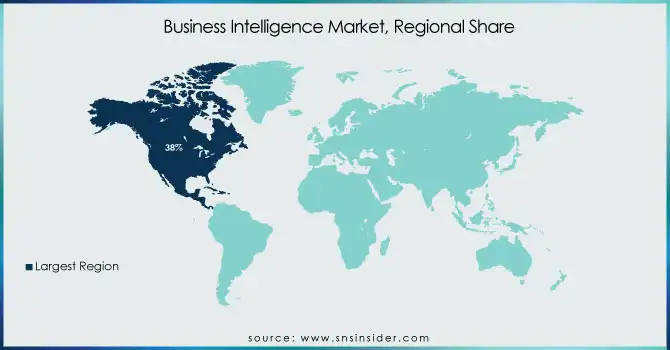
In 2023, North America dominated the Business Intelligence Market with a 38% revenue share, driven by the region’s strong technological infrastructure, early adoption of AI-driven analytics, and the presence of major BI solution providers. Enterprises across industries, particularly in BFSI, healthcare, and retail, leveraged BI tools to enhance decision-making, improve operational efficiency, and gain a competitive edge. Additionally, stringent regulatory requirements and a high focus on data security fueled the demand for advanced BI solutions.
Asia Pacific is expected to grow at the fastest CAGR of 12.57% from 2024 to 2032, propelled by rapid digital transformation, increasing cloud adoption, and rising investments in data analytics. As businesses across emerging economies embrace BI to optimize operations and improve customer insights, the demand for cost-effective and scalable solutions is surging. Government initiatives supporting AI and data-driven innovation further accelerate BI adoption, positioning Asia Pacific as a key growth hub.
Get Customized Report as per Your Business Requirement - Request For Customized Report
Key Players
-
Microsoft (Power BI, Azure Synapse Analytics)
-
Tableau Software (Salesforce) (Tableau Desktop, Tableau Server)
-
IBM (Cognos Analytics, Watson Studio)
-
Qlik (Qlik Sense, QlikView)
-
SAP (SAP BusinessObjects, SAP Analytics Cloud)
-
Oracle (Oracle Analytics Cloud, OBIEE)
-
Redash (Databricks) (Redash, Databricks SQL)
-
Mode Analytics (Mode Studio, Mode Business)
-
Infor (Infor Birst, Infor Coleman AI)
-
SAS (SAS Visual Analytics, SAS Enterprise Guide)
-
Google (Looker, BigQuery BI Engine)
-
AWS (Amazon QuickSight, AWS Glue)
-
Salesforce (Tableau, Einstein Analytics)
-
MicroStrategy (MicroStrategy ONE, HyperIntelligence)
-
Teradata (Vantage, Teradata Data Lab)
-
DOMO (Domo BI, Domo Data Science)
-
TIBCO (TIBCO Spotfire, TIBCO Data Virtualization)
-
Information Builders (WebFOCUS, iWay Data Management)
-
Sisense (Sisense Fusion, Sisense Analytics)
-
Yellowfin (Yellowfin BI, Yellowfin Signals)
-
Board International (Board, Board Marketplace)
-
Dundas (Dundas BI, Dundas Dashboard)
-
Targit (TARGIT Decision Suite, TARGIT InMemoryDB)
-
Zoho (Zoho Analytics, Zoho Creator)
-
Vphrase (Phrazor, Explorazor)
-
dotdata (dotdata Enterprise, dotdata Stream)
-
Amlgo Labs (Amlgo BI, Amlgo AI Insights)
-
Pentation Analytics (Pentation InsurTech, Pentation AI Suite)
-
Hitachi Vantara (Pentaho, Lumada)
-
Outlier (Outlier AI, Outlier Explorer)
-
ConverSight AI (ConverSight Assistant, ConverSight Insights)
-
Element Data (Element AI, Decision Intelligence Platform)
-
Alteryx (Alteryx Designer, Alteryx Intelligence Suite)
-
ThoughtSpot (ThoughtSpot Cloud, ThoughtSpot Everywhere)
Recent Developments:
-
In 2024, Microsoft enhanced Fabric to offer AI-powered development, a unified data estate, and embedded insights in Microsoft 365 apps, encouraging enterprises to adopt the platform.
-
In 2024, Salesforce launched Tableau Einstein, an AI-powered analytics platform that enhances CRM insights with real-time data analysis. It integrates AI-driven predictions and automation to improve decision-making and streamline business workflows.
-
In October 2024, IBM unveiled the next generation of business intelligence (BI) powered by its Granite foundation models. This advancement integrates AI-driven features into IBM Cognos Analytics, offering users enhanced data discovery, automated insights, and predictive analytics through a conversational, natural language interface.
| Report Attributes | Details |
|---|---|
| Market Size in 2023 | USD 29.11 Billion |
| Market Size by 2032 | USD 68.72 Billion |
| CAGR | CAGR of 10.09% From 2024 to 2032 |
| Base Year | 2023 |
| Forecast Period | 2024-2032 |
| Historical Data | 2020-2022 |
| Report Scope & Coverage | Market Size, Segments Analysis, Competitive Landscape, Regional Analysis, DROC & SWOT Analysis, Forecast Outlook |
| Key Segments | • By Component (Solutions, Services) • By Deployment Mode (Cloud, On-premises) • By Organization Size (Large Enterprises, Small and Medium-sized Enterprises) • By Business Function (Human Resource, Finance, Operations, Sales and Marketing) • By End-use Industry (BFSI, IT and Telecommunication, Retail and Consumer Goods, Manufacturing, Healthcare, Others) |
| Regional Analysis/Coverage | North America (US, Canada, Mexico), Europe (Eastern Europe [Poland, Romania, Hungary, Turkey, Rest of Eastern Europe] Western Europe] Germany, France, UK, Italy, Spain, Netherlands, Switzerland, Austria, Rest of Western Europe]), Asia Pacific (China, India, Japan, South Korea, Vietnam, Singapore, Australia, Rest of Asia Pacific), Middle East & Africa (Middle East [UAE, Egypt, Saudi Arabia, Qatar, Rest of Middle East], Africa [Nigeria, South Africa, Rest of Africa], Latin America (Brazil, Argentina, Colombia, Rest of Latin America) |
| Company Profiles | Microsoft, Tableau Software (Salesforce), IBM, Qlik, SAP, Oracle, Redash (Databricks), Mode Analytics, Infor, SAS, Google, AWS, Salesforce, MicroStrategy, Teradata, DOMO, TIBCO, Information Builders, Sisense, Yellowfin, Board International, Dundas, Targit, Zoho, Vphrase, dotdata, Amlgo Labs, Pentation Analytics, Hitachi Vantara, Outlier, ConverSight AI, Element Data, Alteryx, ThoughtSpot |
Frequently Asked Questions
Ans: The BFSI sector led with a 25% revenue share, leveraging BI for fraud detection, risk management, regulatory compliance, and enhanced customer analytics.
Ans: The Finance segment held a 32% market share in 2023, as BI helps organizations with financial planning, risk assessment, fraud detection.
Ans: Asia Pacific is projected to grow at a CAGR of 12.57% from 2024-2032, fueled by rapid digital transformation.
Ans. The Solution segment led the market with a 69% revenue share.
Ans. Business Intelligence Market was valued at USD 29.11 billion in 2023 and is expected to reach USD 68.72 billion by 2032, growing at a CAGR of 10.09% from 2024-2032
Get in Touch
