Agent Performance Optimization Market Report Scope & Overview:

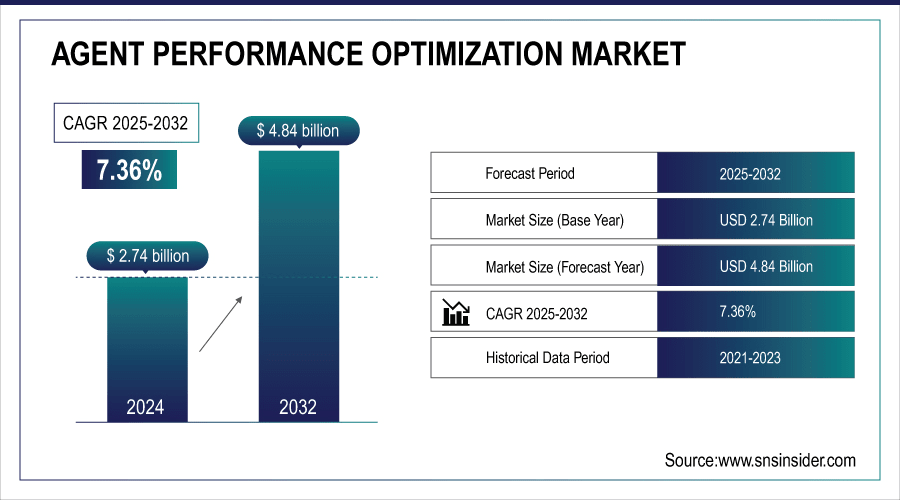
The Agent Performance Optimization Market Size was valued at USD 2.74 billion in 2024 and is expected to reach USD 4.84 billion by 2032 and grow at a CAGR of 7.36% over the forecast period 2025-2032.

The Agent Performance Optimization (APO) Market focuses on technologies and solutions designed to enhance the efficiency, productivity, and service quality of contact center agents. The market is driven by the growing need for superior customer experiences, operational efficiency, and cost reduction across industries such as BFSI, healthcare, retail, and telecom. APO solutions help optimize workflows, improve response times, and ensure consistent service quality, making them critical for modern customer engagement strategies.

Key Agent Performance Optimization (APO) Market Trends:

  • Increasing adoption of AI and machine learning technologies is enhancing real-time agent performance monitoring.

  • Cloud-based APO solutions are gaining popularity for scalability, flexibility, and lower deployment costs.

  • Integration of speech and text analytics is improving interaction quality and customer satisfaction.

  • Workforce optimization tools are driving efficiency by providing data-driven insights and personalized coaching for agents.

  • Growing demand for superior customer experiences across BFSI, healthcare, retail, and telecom is fueling APO adoption.

  • Automation of repetitive tasks and AI-assisted decision-making is reducing operational costs and improving response times.

The U.S. Agent Performance Optimization Market size was USD 0.48 billion in 2024 and is expected to reach USD 0.77 billion by 2032, growing at a CAGR of 6.12% over the forecast period of 2024-2032. The growth is driven by rising adoption of AI-powered analytics, real-time performance monitoring, and cloud-based solutions, enabling organizations to improve agent productivity, enhance customer experiences, optimize workflows, and reduce operational costs across sectors such as BFSI, healthcare, retail, and telecom.

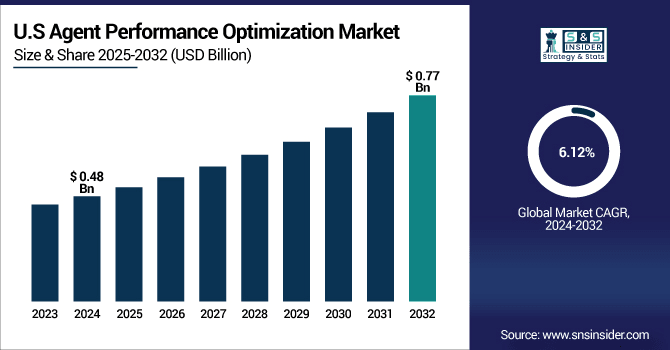
The U.S. market is witnessing significant growth driven by the increasing adoption of AI and machine learning technologies to enhance agent productivity and customer experience. Cloud-based APO solutions are becoming more popular due to their scalability, flexibility, and cost-efficiency. Integration of speech and text analytics is improving interaction quality and enabling real-time coaching for agents. Organizations across BFSI, healthcare, retail, and telecom are leveraging APO tools to optimize workflows, reduce response times, and ensure consistent service quality. Automation of routine tasks further boosts efficiency, making APO solutions critical for modern contact center operations.

Agent Performance Optimization Market Growth Drivers:

• Growing Adoption of AI and Machine Learning Technologies Drives U.S. Agent Performance Optimization Market Expansion

The market is driven by rising adoption of AI and machine learning technologies to enhance agent efficiency, productivity, and service quality. AI-powered analytics and real-time performance monitoring allow organizations to identify performance gaps, provide personalized coaching, and optimize workflows. This cause, increasing reliance on advanced technologies, effects improved customer satisfaction, faster response times, and operational efficiency. Contact centers using AI-driven APO tools report 15% higher agent productivity and a significant reduction in handling time. Companies are integrating speech and text analytics, automating repetitive tasks, and using predictive insights to boost service quality.

In August 2025, a leading APO solution provider launched an AI-powered performance analytics module that enables real-time agent coaching, directly improving customer satisfaction and operational efficiency.

Agent Performance Optimization Market Growth Restraints:

• High Implementation Costs and Complex Integration Processes Restrain U.S. Agent Performance Optimization Market Growth

The market faces restraints from high implementation costs and integration complexities associated with APO solutions. Enterprises often need to invest heavily in hardware, software, and training while ensuring compatibility with existing systems. This cause, elevated deployment costs and technical challenges, effects slower adoption among small and medium enterprises and limits overall market expansion. Additionally, the need for skilled personnel to manage advanced systems increases operational overhead. The complexity of migrating legacy systems to modern cloud-based APO platforms further delays deployment and reduces the speed of realizing benefits.

In March 2024, a mid-sized financial services company postponed its APO deployment due to integration challenges with legacy CRM systems, illustrating cost and complexity as significant barriers.

Agent Performance Optimization Market Growth Opportunities:

• Expansion of APO Solutions in Emerging Markets Provides Significant Growth Opportunities

The growing adoption of APO solutions in emerging markets offers lucrative opportunities for market expansion. As enterprises in these regions increasingly prioritize customer service efficiency, AI-driven and cloud-based APO solutions are gaining traction. This cause, rising demand for operational optimization and enhanced customer experience, effects higher market penetration and adoption of innovative APO tools. Organizations are investing in predictive analytics, automated coaching, and performance dashboards to streamline contact center operations, reduce errors, and improve response times.

In June 2025, a telecom provider in India implemented a cloud-based APO system, increasing agent productivity by 18% and reducing average call handling time, highlighting market potential in emerging economies.

Key Agent Performance Optimization Market Segment Highlights:

  • By Application, Contact Center Optimization led with ~46% share in 2024; Sales Performance Improvement fastest growing (CAGR 9.53%).

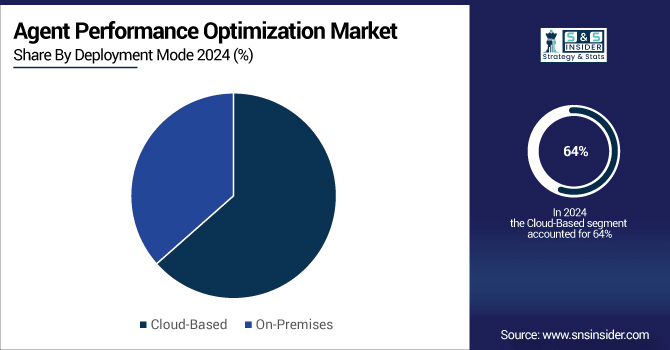
  • By Deployment Mode, Cloud-Based dominated ~64% in 2024; On-Premises fastest growing (CAGR 7.99%).

  • By Component, Software led with ~60% share in 2024; Services fastest growing (CAGR 8.11%).

  • By End User, BFSI dominated ~33% in 2024; Healthcare fastest growing (CAGR 12.77%).

Key Agent Performance Optimization Market Segment Analysis:

  • By Application, Contact Center Optimization Leads Market While Sales Performance Improvement Registers Fastest Growth

The Contact Center Optimization segment dominates the APO market, driven by increasing demand for efficient customer interactions, reduced call handling times, and enhanced agent productivity. Integration of AI-driven monitoring, real-time analytics, and omnichannel performance dashboards enables managers to optimize workflows, track agent efficiency, and improve customer satisfaction. The Sales Performance Improvement segment is expected to grow fastest, as companies adopt predictive analytics and performance scoring tools to monitor agent performance, identify skill gaps, optimize coaching, and boost sales effectiveness, thereby enhancing revenue generation and overall operational efficiency.

  • By Deployment Mode, Cloud-Based Leads Market While On-Premises Registers Fastest Growth

The Cloud-Based deployment segment holds a dominant position in the APO market due to its scalability, flexibility, and ease of remote management. Cloud-native APO platforms with AI-powered analytics and real-time monitoring enhance agent performance and streamline operations across industries. The On-Premises segment is expected to grow fastest, driven by rising concerns over data security, privacy, and regulatory compliance. Advanced on-premises solutions with hybrid deployment options and customized performance monitoring modules allow organizations to maintain control over sensitive data while optimizing agent productivity and operational efficiency.

  • By Component, Software Leads Market While Services Registers Fastest Growth

The Software component dominates the APO market, fueled by widespread adoption of AI-powered dashboards, predictive insights, and automated coaching tools. These solutions enhance agent efficiency, reduce errors, and improve customer service quality across contact centers. The Services segment is projected to grow fastest as organizations increasingly require consulting, training, implementation, and maintenance support. Professional services help enterprises maximize the benefits of APO systems, ensuring seamless deployment, continuous agent performance optimization, and improved overall operational effectiveness.

  • By End User, BFSI Leads Market While Healthcare Registers Fastest Growth

The BFSI segment dominates the APO market, driven by the need for efficient customer support, fraud detection, and compliance management in banking, insurance, and financial services. APO solutions help monitor agent performance, automate routine tasks, and provide analytics-driven coaching, enhancing operational efficiency and customer satisfaction. The Healthcare segment is expected to grow fastest, fueled by telemedicine adoption and increased patient engagement initiatives. Healthcare-specific APO tools optimize workflows, track agent interactions, and ensure timely responses, improving service quality and enabling efficient patient support operations.

Agent Performance Optimization Market Regional Analysis:

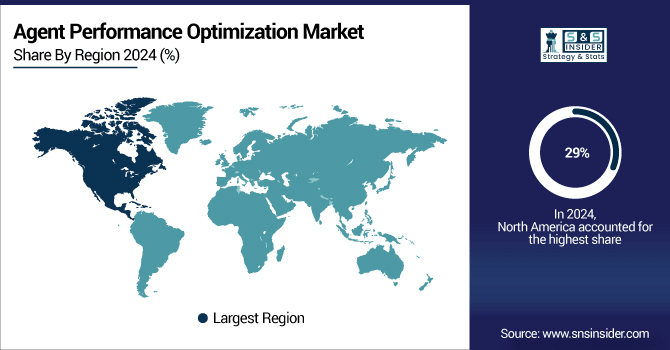
  • North America Agent Performance Optimization Market Insights

In 2024, North America dominates the APO market share is 29%, driven by widespread adoption of AI-powered contact center solutions, cloud-based deployments, and a strong focus on customer experience. The region benefits from mature contact center infrastructure, advanced technology integration, and high demand for operational efficiency, supporting extensive deployment of APO tools that enhance agent productivity, reduce response times, and improve customer satisfaction.

  • U.S. Leads Agent Performance Optimization Market in North America

The U.S. dominates with the largest market share, supported by advanced BPO and contact center industries, robust technological capabilities, and focus on AI-driven monitoring. Continuous investment in real-time analytics, workforce optimization, and predictive coaching strengthens agent performance, operational efficiency, and customer engagement, securing its leadership position within North America.

  • Asia Pacific Agent Performance Optimization Market Insights

Asia Pacific is the fastest-growing region with a CAGR of 9.72% in the APO market, supported by rapid digital transformation, expanding IT and BPO sectors, and rising telecommunication and service industry investments. Businesses increasingly adopt AI-powered, cloud-based APO solutions to optimize workflows, monitor agent performance, and enhance customer experience, driving widespread market penetration.

  • India Leads Agent Performance Optimization Market Growth in Asia Pacific

India leads the regional market due to its large outsourcing and IT services industry, growing contact center operations, and government support for digital adoption. Integration of predictive analytics, real-time monitoring, and AI-assisted coaching improves agent productivity, reduces response times, and positions India as a key driver of APO market growth in Asia Pacific.

  • Europe Agent Performance Optimization Market Insights

In 2024, Europe holds a significant share in the APO market, driven by strong investments in digital transformation, AI-based contact center solutions, and regulatory compliance requirements. Enterprises increasingly adopt APO tools to enhance agent efficiency, optimize workflows, and deliver superior customer service, supporting steady regional growth.

  • Germany Dominates Europe’s Agent Performance Optimization Market

Germany leads the European market with its advanced financial, healthcare, and industrial sectors, strong technological ecosystem, and continuous AI-driven innovation. Adoption of cloud-based and analytics-enabled APO solutions improves agent performance, operational efficiency, and customer satisfaction, reinforcing Germany’s leadership position within Europe.

  • Latin America and Middle East & Africa Agent Performance Optimization Market Insights

The APO market in Latin America and MEA is witnessing steady growth, driven by expanding BPO and telecom sectors, increasing digital adoption, and growing demand for enhanced customer support. Rising investment in AI-powered monitoring, workflow optimization, and cloud-based APO platforms supports operational efficiency and improved agent performance across enterprises in these regions.

  • Regional Leaders in Latin America and MEA

Brazil leads Latin America due to its growing contact center industry and digital transformation initiatives, while the UAE dominates MEA, driven by smart city projects, advanced IT infrastructure, and adoption of cloud-based APO solutions enhancing agent productivity and service quality.

Competitive Landscape for the Agent Performance Optimization Market:

NICE Ltd., headquartered in Israel, is a global leader in AI-driven software solutions for customer engagement, financial crime prevention, and operational efficiency. Founded in 1986, it offers cloud and on-premises platforms that integrate analytics, workforce management, and robotic process automation to enhance productivity and customer experience. In the Agent Performance Optimization market, NICE provides tools that monitor agent performance in real time, analyze interaction quality, and deliver actionable insights for coaching. By enabling managers to optimize workflows, reduce response times, and improve service quality, NICE helps organizations enhance both agent efficiency and overall customer satisfaction.

  • August 7, 2025, NICE Ltd. was recognized as a leader in the 2025 ISG Buyers Guide for Customer Experience Management and Conversational AI for CX. This dual recognition highlights NICE's strong performance in both product innovation and customer experience delivery, solidifying its position as a market leader in AI-powered customer experience solutions.

Verint Systems, based in New York and founded in 1994, specializes in customer engagement solutions, security intelligence, and workforce optimization software. Its AI-powered analytics, speech and text analytics, and workforce management tools support enterprises in banking, retail, healthcare, and government sectors. Verint’s solutions focus on transforming customer interactions into actionable intelligence while boosting operational efficiency. In the Agent Performance Optimization market, Verint helps track agent productivity, evaluate conversation quality, and provide automated coaching insights. By enabling data-driven decision-making, Verint ensures agents deliver high-quality service consistently, enhancing customer experience and overall contact center performance.

  • June 28, 2024, Verint secured a $6.5 million contract from a top 10 U.S. public utility company to deploy multiple AI-powered bots. This initiative aims to enhance operational efficiency and customer service capabilities, reflecting the increasing adoption of artificial intelligence within essential services sectors to improve performance and user experiences.

Genesys Cloud Services, part of Genesys Inc. in California, provides cloud-based contact center solutions that integrate AI, omnichannel engagement, and workforce optimization. Founded in 1990, Genesys helps organizations manage interactions via voice, chat, email, and social media in a unified platform. Its solutions leverage AI to deliver real-time insights and automation that improve operational efficiency and customer satisfaction. In the Agent Performance Optimization market, Genesys tracks agent performance, identifies coaching needs, and optimizes scheduling. By providing actionable analytics and tools for workflow improvement, Genesys empowers managers to enhance agent productivity, service quality, and overall customer experience across channels.

  • December 12, 2024, Genesys Cloud AI represented more than 10% of the platform's new business during the first nine months of fiscal year 2025. This growth underscores the increasing demand for AI-driven solutions to enhance customer and employee experiences.

Cisco Systems, founded in 1984 and headquartered in San Jose, California, is a global leader in networking, cybersecurity, collaboration, and cloud solutions. Its products and services support enterprises, service providers, and government organizations in achieving digital transformation, secure networking, and operational efficiency. Cisco integrates AI and automation into its contact center and collaboration solutions to enhance communication, productivity, and customer experience. In the Agent Performance Optimization market, Cisco monitors agent productivity, evaluates service quality, and provides AI-driven coaching insights. This ensures consistent performance, faster response times, and higher customer satisfaction, helping organizations optimize operations and maximize the effectiveness of their contact center teams.

  • February 12, 2025, Cisco Systems raised its annual revenue forecast, expecting increased demand for its cloud networking gear amid the artificial intelligence boom. Corporate customers are heavily investing in AI infrastructure, boosting demand for data centers and Cisco's products such as Ethernet switches and routers. This shift is positively impacting Cisco's sales and market position.

Agent Performance Optimization Market Key Players:

Some of the Agent Performance Optimization Market Companies

  • NICE Ltd.

  • Verint Systems Inc.

  • Genesys Cloud Services

  • Cisco Systems Inc.

  • Avaya Holdings Corp.

  • Calabrio Inc.

  • Five9 Inc.

  • Talkdesk Inc.

  • 8x8 Inc.

  • Oracle Corporation

  • RingCentral Inc.

  • Zendesk Inc.

  • Salesforce.com Inc.

  • Mitel Networks Corporation

  • Aspect Software Inc.

  • SAP SE

  • Alcatel-Lucent Enterprise

  • Vonage Holdings Corp.

  • IBM Corporation

  • Amazon Connect

Agent Performance Optimization Market Report Scope:

Report Attributes Details
Market Size in 2024 USD 2.74 Billion 
Market Size by 2032 USD 4.84 Billion 
CAGR CAGR of 7.36% from 2025 to 2032
Base Year 2024
Forecast Period 2025-2032
Historical Data 2021-2023
Report Scope & Coverage Market Size, Segments Analysis, Competitive Landscape, Regional Analysis, DROC & SWOT Analysis, Forecast Outlook
Key Segments • By Application (Contact Center Optimization, Sales Performance Improvement, Customer Engagement Enhancement)
• By Deployment Mode (Cloud-Based, On-Premises)
• By Component (Software, Services, Consulting)
• By End User (BFSI, Healthcare, Retail, Telecommunication)
Regional Analysis/Coverage North America (US, Canada), Europe (Germany, UK, France, Italy, Spain, Russia, Poland, Rest of Europe), Asia Pacific (China, India, Japan, South Korea, Australia, ASEAN Countries, Rest of Asia Pacific), Middle East & Africa (UAE, Saudi Arabia, Qatar, South Africa, Rest of Middle East & Africa), Latin America (Brazil, Argentina, Mexico, Colombia, Rest of Latin America).
Company Profiles NICE Ltd., Verint Systems Inc., Genesys Cloud Services, Cisco Systems Inc., Avaya Holdings Corp., Calabrio Inc., Five9 Inc., Talkdesk Inc., 8x8 Inc., Oracle Corporation, RingCentral Inc., Zendesk Inc., Salesforce.com Inc., Mitel Networks Corporation, Aspect Software Inc., SAP SE, Alcatel-Lucent Enterprise, Vonage Holdings Corp., IBM Corporation, Amazon Connect.

Table Of Contents

1. Introduction

1.1 Market Definition & Scope

 1.2 Research Assumptions & Abbreviations

 1.3 Research Methodology

2. Executive Summary

2.1 Market Snapshot

 2.2 Market Absolute $ Opportunity Assessment & Y-o-Y Analysis, 2021–2032

 2.3 Market Size & Forecast, By Segmentation, 2021–2032

  2.3.1 Market Size By End-User

  2.3.2 Market Size By Application

         2.3.2 Market Size By Component

         2.3.2 Market Size By Deployment Mode

 2.4 Market Share & BPS Analysis By Region, 2024

 2.5 Industry Growth Scenarios – Conservative, Likely & Optimistic

 2.6 Industry CxO’s Perspective

3. Market Overview

3.1 Market Dynamics

  3.1.1 Drivers

  3.1.2 Restraints

  3.1.3 Opportunities

  3.1.4 Key Market Trends

 3.2 Industry PESTLE Analysis

 3.3 Key Industry Forces (Porter’s) Impacting Market Growth

 3.4 Industry Supply Chain Analysis

  3.4.1 Raw Material Suppliers

  3.4.2 Manufacturers

  3.4.3 Distributors/Suppliers

  3.4.4 Customers/End-Users

 3.5 Industry Life Cycle Assessment

 3.6 Parent Market Overview

 3.7 Market Risk Assessment

4. Statistical Insights & Trends Reporting

     4.1 Agent Productivity & Efficiency Metrics

4.1.1 Average handle time (AHT) reduction (%) after optimization tool implementation

4.1.2 Increase in first-call resolution (FCR) rate (%)

4.1.3 Percentage improvement in agent occupancy and utilization rates

     4.2 Adoption & Deployment Statistics

4.2.1 Share of enterprises using AI-powered vs. traditional performance optimization solutions

4.2.2 Deployment rate by industry vertical (BFSI, telecom, healthcare, retail, etc.)

4.2.3 Percentage of agents actively using performance dashboards and analytics tools

     4.3 Training & Skill Enhancement Metrics

4.3.1 Average reduction in training hours per agent with optimization software

4.3.2 Improvement (%) in agent knowledge retention and skill competency

4.3.3 Share of automated coaching interventions versus manual supervision

     4.4 ROI & Business Impact Indicators

4.4.1 Increase in customer satisfaction (CSAT) scores post-optimization

4.4.2 Percentage reduction in operational costs per agent

4.4.3 Average revenue uplift per optimized agent or team

5. Agent Performance Optimization Market Segmental Analysis & Forecast, By End-User, 2021 – 2032, Value (USD Billion)

5.1 Introduction

 5.2 BFSI

  5.2.1 Key Trends

  5.2.2 Market Size & Forecast, 2021 – 2032

 5.3 Healthcare

  5.3.1 Key Trends

  5.3.2 Market Size & Forecast, 2021 – 2032

 5.4 Retail

  5.4.1 Key Trends

  5.4.2 Market Size & Forecast, 2021 – 2032

     5.5 Telecommunication

  5.5.1 Key Trends

  5.5.2 Market Size & Forecast, 2021 – 2032

6. Agent Performance Optimization Market Segmental Analysis & Forecast, By Application, 2021 – 2032, Value (USD Billion)

    6.1 Introduction

 6.2 Contact Center Optimization

  6.2.1 Key Trends

  6.2.2 Market Size & Forecast, 2021 – 2032

 6.3 Sales Performance Improvement

  6.3.1 Key Trends

  6.3.2 Market Size & Forecast, 2021 – 2032

 6.4 Customer Engagement Enhancement

  6.4.1 Key Trends

  6.4.2 Market Size & Forecast, 2021 – 2032

7. Agent Performance Optimization Market Segmental Analysis & Forecast, By Deployment Mode, 2021 – 2032, Value (USD Billion)

    7.1 Introduction

 7.2 Cloud-Based

  7.2.1 Key Trends

  7.2.2 Market Size & Forecast, 2021 – 2032

 7.3 On-Premise

  7.3.1 Key Trends

  7.3.2 Market Size & Forecast, 2021 – 2032

8. Agent Performance Optimization Market Segmental Analysis & Forecast, By Component, 2021 – 2032, Value (USD Billion)

    8.1 Introduction

 8.2 Software

  8.2.1 Key Trends

  8.2.2 Market Size & Forecast, 2021 – 2032

 8.3 Services

  8.3.1 Key Trends

  8.3.2 Market Size & Forecast, 2021 – 2032

 8.4 Consulting

  8.4.1 Key Trends

  8.4.2 Market Size & Forecast, 2021 – 2032

9. Agent Performance Optimization Market Segmental Analysis & Forecast By Region, 2021 – 2025, Value (USD Billion)

9.1 Introduction

9.2 North America

 9.2.1 Key Trends

 9.2.2 Agent Performance Optimization Market Size & Forecast, By End-User, 2021 – 2032

 9.2.3 Agent Performance Optimization Market Size & Forecast, By Application, 2021 – 2032

 9.2.4 Agent Performance Optimization Market Size & Forecast, By Deployment Mode, 2021 – 2032

 9.2.5 Agent Performance Optimization Market Size & Forecast, By Component, 2021 – 2032

 9.2.6 Agent Performance Optimization Market Size & Forecast, By Country, 2021 – 2032

  9.2.6.1 USA

   9.2.6.1.1 Agent Performance Optimization Market Size & Forecast, By End-User, 2021 – 2032

   9.2.6.1.2 Agent Performance Optimization Market Size & Forecast, By Application, 2021 – 2032

   9.2.6.1.3 Agent Performance Optimization Market Size & Forecast, By Deployment Mode, 2021 – 2032

   9.2.6.1.4 Agent Performance Optimization Market Size & Forecast, By Component, 2021 – 2032

  9.2.6.2 Canada

   9.2.6.2.1 Agent Performance Optimization Market Size & Forecast, By End-User, 2021 – 2032

   9.2.6.2.2 Agent Performance Optimization Market Size & Forecast, By Application, 2021 – 2032

   9.2.6.2.3 Agent Performance Optimization Market Size & Forecast, By Deployment Mode, 2021 – 2032

   9.2.6.2.4 Agent Performance Optimization Market Size & Forecast, By Component, 2021 – 2032

9.3 Europe

 9.3.1 Key Trends

 9.3.2 Agent Performance Optimization Market Size & Forecast, By End-User, 2021 – 2032

 9.3.3 Agent Performance Optimization Market Size & Forecast, By Application, 2021 – 2032

 9.3.4 Agent Performance Optimization Market Size & Forecast, By Deployment Mode, 2021 – 2032

 9.3.5 Agent Performance Optimization Market Size & Forecast, By Component, 2021 – 2032

 9.3.6 Agent Performance Optimization Market Size & Forecast, By Country, 2021 – 2032

  9.3.6.1 Germany

   9.3.6.1.1 Agent Performance Optimization Market Size & Forecast, By End-User, 2021 – 2032

   9.3.6.1.2 Agent Performance Optimization Market Size & Forecast, By Application, 2021 – 2032

   9.3.6.1.3 Agent Performance Optimization Market Size & Forecast, By Deployment Mode, 2021 – 2032

   9.3.6.1.4 Agent Performance Optimization Market Size & Forecast, By Component, 2021 – 2032

  9.3.6.2 UK

   9.3.6.2.1 Agent Performance Optimization Market Size & Forecast, By End-User, 2021 – 2032

   9.3.6.2.2 Agent Performance Optimization Market Size & Forecast, By Application, 2021 – 2032

   9.3.6.2.3 Agent Performance Optimization Market Size & Forecast, By Deployment Mode, 2021 – 2032

   9.3.6.2.4 Agent Performance Optimization Market Size & Forecast, By Component, 2021 – 2032

  9.3.6.3 France

   9.3.6.3.1 Agent Performance Optimization Market Size & Forecast, By End-User, 2021 – 2032

   9.3.6.3.2 Agent Performance Optimization Market Size & Forecast, By Application, 2021 – 2032

   9.3.6.3.3 Agent Performance Optimization Market Size & Forecast, By Deployment Mode, 2021 – 2032

   9.3.6.3.4 Agent Performance Optimization Market Size & Forecast, By Component, 2021 – 2032

  9.3.6.4 Italy

   9.3.6.4.1 Agent Performance Optimization Market Size & Forecast, By End-User, 2021 – 2032

   9.3.6.4.2 Agent Performance Optimization Market Size & Forecast, By Application, 2021 – 2032

   9.3.6.4.3 Agent Performance Optimization Market Size & Forecast, By Deployment Mode, 2021 – 2032

   9.3.6.4.4 Agent Performance Optimization Market Size & Forecast, By Component, 2021 – 2032

  9.3.6.5 Spain

   9.3.6.5.1 Agent Performance Optimization Market Size & Forecast, By End-User, 2021 – 2032

   9.3.6.5.2 Agent Performance Optimization Market Size & Forecast, By Application, 2021 – 2032

   9.3.6.5.3 Agent Performance Optimization Market Size & Forecast, By Deployment Mode, 2021 – 2032

   9.3.6.5.4 Agent Performance Optimization Market Size & Forecast, By Component, 2021 – 2032

  9.3.6.6 Russia

   9.3.6.6.1 Agent Performance Optimization Market Size & Forecast, By End-User, 2021 – 2032

   9.3.6.6.2 Agent Performance Optimization Market Size & Forecast, By Application, 2021 – 2032

   9.3.6.6.3 Agent Performance Optimization Market Size & Forecast, By Deployment Mode, 2021 – 2032

   9.3.6.6.4 Agent Performance Optimization Market Size & Forecast, By Component, 2021 – 2032

  9.3.6.7 Poland

   9.3.6.7.1 Agent Performance Optimization Market Size & Forecast, By End-User, 2021 – 2032

   9.3.6.7.2 Agent Performance Optimization Market Size & Forecast, By Application, 2021 – 2032

   9.3.6.7.3 Agent Performance Optimization Market Size & Forecast, By Deployment Mode, 2021 – 2032

   9.3.6.7.4 Agent Performance Optimization Market Size & Forecast, By Component, 2021 – 2032

  9.3.6.8 Rest of Europe

   9.3.6.8.1 Agent Performance Optimization Market Size & Forecast, By End-User, 2021 – 2032

   9.3.6.8.2 Agent Performance Optimization Market Size & Forecast, By Application, 2021 – 2032

   9.3.6.8.3 Agent Performance Optimization Market Size & Forecast, By Deployment Mode, 2021 – 2032

   9.3.6.8.4 Agent Performance Optimization Market Size & Forecast, By Component, 2021 – 2032   

9.4 Asia-Pacific

 9.4.1 Key Trends

 9.4.2 Agent Performance Optimization Market Size & Forecast, By End-User, 2021 – 2032

 9.4.3 Agent Performance Optimization Market Size & Forecast, By Application, 2021 – 2032

 9.4.4 Agent Performance Optimization Market Size & Forecast, By Deployment Mode, 2021 – 2032

 9.4.5 Agent Performance Optimization Market Size & Forecast, By Component, 2021 – 2032

 9.4.6 Agent Performance Optimization Market Size & Forecast, By Country, 2021 – 2032

  9.4.6.1 China

   9.4.6.1.1 Agent Performance Optimization Market Size & Forecast, By End-User, 2021 – 2032

   9.4.6.1.2 Agent Performance Optimization Market Size & Forecast, By Application, 2021 – 2032

   9.4.6.1.3 Agent Performance Optimization Market Size & Forecast, By Deployment Mode, 2021 – 2032

   9.4.6.1.4 Agent Performance Optimization Market Size & Forecast, By Component, 2021 – 2032

  9.4.6.2 India

   9.4.6.2.1 Agent Performance Optimization Market Size & Forecast, By End-User, 2021 – 2032

   9.4.6.2.2 Agent Performance Optimization Market Size & Forecast, By Application, 2021 – 2032

   9.4.6.2.3 Agent Performance Optimization Market Size & Forecast, By Deployment Mode, 2021 – 2032

   9.4.6.2.4 Agent Performance Optimization Market Size & Forecast, By Component, 2021 – 2032

  9.4.6.3 Japan

   9.4.6.3.1 Agent Performance Optimization Market Size & Forecast, By End-User, 2021 – 2032

   9.4.6.3.2 Agent Performance Optimization Market Size & Forecast, By Application, 2021 – 2032

   9.4.6.3.3 Agent Performance Optimization Market Size & Forecast, By Deployment Mode, 2021 – 2032

   9.4.6.3.4 Agent Performance Optimization Market Size & Forecast, By Component, 2021 – 2032

  9.4.6.4 South Korea

   9.4.6.4.1 Agent Performance Optimization Market Size & Forecast, By End-User, 2021 – 2032

   9.4.6.4.2 Agent Performance Optimization Market Size & Forecast, By Application, 2021 – 2032

   9.4.6.4.3 Agent Performance Optimization Market Size & Forecast, By Deployment Mode, 2021 – 2032

   9.4.6.4.4 Agent Performance Optimization Market Size & Forecast, By Component, 2021 – 2032

  9.4.6.5 Australia

   9.4.6.5.1 Agent Performance Optimization Market Size & Forecast, By End-User, 2021 – 2032

   9.4.6.5.2 Agent Performance Optimization Market Size & Forecast, By Application, 2021 – 2032

   9.4.6.5.3 Agent Performance Optimization Market Size & Forecast, By Deployment Mode, 2021 – 2032

   9.4.6.5.4 Agent Performance Optimization Market Size & Forecast, By Component, 2021 – 2032

  9.4.6.6 ASEAN Countries

   9.4.6.6.1 Agent Performance Optimization Market Size & Forecast, By End-User, 2021 – 2032

   9.4.6.6.2 Agent Performance Optimization Market Size & Forecast, By Application, 2021 – 2032

   9.4.6.6.3 Agent Performance Optimization Market Size & Forecast, By Deployment Mode, 2021 – 2032

   9.4.6.6.4 Agent Performance Optimization Market Size & Forecast, By Component, 2021 – 2032

  9.4.6.7 Rest of Asia-Pacific

   9.4.6.7.1 Agent Performance Optimization Market Size & Forecast, By End-User, 2021 – 2032

   9.4.6.7.2 Agent Performance Optimization Market Size & Forecast, By Application, 2021 – 2032

   9.4.6.7.3 Agent Performance Optimization Market Size & Forecast, By Deployment Mode, 2021 – 2032

   9.4.6.7.4 Agent Performance Optimization Market Size & Forecast, By Component, 2021 – 2032

9.5 Latin America

 9.5.1 Key Trends

 9.5.2 Agent Performance Optimization Market Size & Forecast, By End-User, 2021 – 2032

 9.5.3 Agent Performance Optimization Market Size & Forecast, By Application, 2021 – 2032

 9.5.4 Agent Performance Optimization Market Size & Forecast, By Deployment Mode, 2021 – 2032

 9.5.5 Agent Performance Optimization Market Size & Forecast, By Component, 2021 – 2032

 9.5.6 Agent Performance Optimization Market Size & Forecast, By Country, 2021 – 2032

  9.5.6.1 Brazil

   9.5.6.1.1 Agent Performance Optimization Market Size & Forecast, By End-User, 2021 – 2032

   9.5.6.1.2 Agent Performance Optimization Market Size & Forecast, By Application, 2021 – 2032

   9.5.6.1.3 Agent Performance Optimization Market Size & Forecast, By Deployment Mode, 2021 – 2032

   9.5.6.1.4 Agent Performance Optimization Market Size & Forecast, By Component, 2021 – 2032

  9.5.6.2 Argentina

   9.5.6.2.1 Agent Performance Optimization Market Size & Forecast, By End-User, 2021 – 2032

   9.5.6.2.2 Agent Performance Optimization Market Size & Forecast, By Application, 2021 – 2032

   9.5.6.2.3 Agent Performance Optimization Market Size & Forecast, By Deployment Mode, 2021 – 2032

   9.5.6.2.4 Agent Performance Optimization Market Size & Forecast, By Component, 2021 – 2032

  9.5.6.3 Mexico

   9.5.6.3.1 Agent Performance Optimization Market Size & Forecast, By End-User, 2021 – 2032

   9.5.6.3.2 Agent Performance Optimization Market Size & Forecast, By Application, 2021 – 2032

   9.5.6.3.3 Agent Performance Optimization Market Size & Forecast, By Deployment Mode, 2021 – 2032

   9.5.6.3.4 Agent Performance Optimization Market Size & Forecast, By Component, 2021 – 2032

  9.5.6.4 Colombia

   9.5.6.4.1 Agent Performance Optimization Market Size & Forecast, By End-User, 2021 – 2032

   9.5.6.4.2 Agent Performance Optimization Market Size & Forecast, By Application, 2021 – 2032

   9.5.6.4.3 Agent Performance Optimization Market Size & Forecast, By Deployment Mode, 2021 – 2032

   9.5.6.4.4 Agent Performance Optimization Market Size & Forecast, By Component, 2021 – 2032

  9.5.6.5 Rest of Latin America

   9.5.6.5.1 Agent Performance Optimization Market Size & Forecast, By End-User, 2021 – 2032

   9.5.6.5.2 Agent Performance Optimization Market Size & Forecast, By Application, 2021 – 2032

   9.5.6.5.3 Agent Performance Optimization Market Size & Forecast, By Deployment Mode, 2021 – 2032

   9.5.6.5.4 Agent Performance Optimization Market Size & Forecast, By Component, 2021 – 2032

9.6 Middle East & Africa

 9.6.1 Key Trends

 9.6.2 Agent Performance Optimization Market Size & Forecast, By End-User, 2021 – 2032

 9.6.3 Agent Performance Optimization Market Size & Forecast, By Application, 2021 – 2032

 9.6.4 Agent Performance Optimization Market Size & Forecast, By Deployment Mode, 2021 – 2032

 9.6.5 Agent Performance Optimization Market Size & Forecast, By Component, 2021 – 2032

 9.6.6 Agent Performance Optimization Market Size & Forecast, By Country, 2021 – 2032

  9.6.6.1 UAE

   9.6.6.1.1 Agent Performance Optimization Market Size & Forecast, By End-User, 2021 – 2032

   9.6.6.1.2 Agent Performance Optimization Market Size & Forecast, By Application, 2021 – 2032

   9.6.6.1.3 Agent Performance Optimization Market Size & Forecast, By Deployment Mode, 2021 – 2032

   9.6.6.1.4 Agent Performance Optimization Market Size & Forecast, By Component, 2021 – 2032

  9.6.6.2 Saudi Arabia

   9.6.6.2.1 Agent Performance Optimization Market Size & Forecast, By End-User, 2021 – 2032

   9.6.6.2.2 Agent Performance Optimization Market Size & Forecast, By Application, 2021 – 2032

   9.6.6.2.3 Agent Performance Optimization Market Size & Forecast, By Deployment Mode, 2021 – 2032

   9.6.6.2.4 Agent Performance Optimization Market Size & Forecast, By Component, 2021 – 2032

  9.6.6.3 Qatar

   9.6.6.3.1 Agent Performance Optimization Market Size & Forecast, By End-User, 2021 – 2032

   9.6.6.3.2 Agent Performance Optimization Market Size & Forecast, By Application, 2021 – 2032

   9.6.6.3.3 Agent Performance Optimization Market Size & Forecast, By Deployment Mode, 2021 – 2032

   9.6.6.3.4 Agent Performance Optimization Market Size & Forecast, By Component, 2021 – 2032

  9.6.6.4 Egypt

   9.6.6.4.1 Agent Performance Optimization Market Size & Forecast, By End-User, 2021 – 2032

   9.6.6.4.2 Agent Performance Optimization Market Size & Forecast, By Application, 2021 – 2032

   9.6.6.4.3 Agent Performance Optimization Market Size & Forecast, By Deployment Mode, 2021 – 2032

   9.6.6.4.4 Agent Performance Optimization Market Size & Forecast, By Component, 2021 – 2032

  9.6.6.5 South Africa

   9.6.6.5.1 Agent Performance Optimization Market Size & Forecast, By End-User, 2021 – 2032

   9.6.6.5.2 Agent Performance Optimization Market Size & Forecast, By Application, 2021 – 2032

   9.6.6.5.3 Agent Performance Optimization Market Size & Forecast, By Deployment Mode, 2021 – 2032

   9.6.6.5.4 Agent Performance Optimization Market Size & Forecast, By Component, 2021 – 2032

  9.6.6.6 Rest of Middle East & Africa

   9.6.6.6.1 Agent Performance Optimization Market Size & Forecast, By End-User, 2021 – 2032

   9.6.6.6.2 Agent Performance Optimization Market Size & Forecast, By Application, 2021 – 2032

   9.6.6.6.3 Agent Performance Optimization Market Size & Forecast, By Deployment Mode, 2021 – 2032

   9.6.6.6.4 Agent Performance Optimization Market Size & Forecast, By Component, 2021 – 2032

10. Competitive Landscape

 10.1 Key Players' Positioning

 10.2 Competitive Developments

  10.2.1 Key Strategies Adopted (%), By Key Players, 2024

  10.2.2 Year-Wise Strategies & Development, 2021 – 2025

  10.2.3 Number of Strategies Adopted by Key Players, 2024

 10.3 Market Share Analysis, 2024

 10.4 Product/Service & Application Benchmarking

  10.4.1 Product/Service Specifications & Features By Key Players

  10.4.2 Product/Service Heatmap By Key Players

  10.4.3 Application Heatmap By Key Players

 10.5 Industry Start-Up & Innovation Landscape

 10.6 Key Company Profiles

10.6 Key Company Profiles

 10.6.1 NICE Ltd.

  10.6.1.1 Company Overview & Snapshot

  10.6.1.2 Product/Service Portfolio

  10.6.1.3 Key Company Financials

  10.6.1.4 SWOT Analysis

 10.6.2 Verint Systems Inc.

  10.6.2.1 Company Overview & Snapshot

  10.6.2.2 Product/Service Portfolio

  10.6.2.3 Key Company Financials

  10.6.2.4 SWOT Analysis

 10.6.3 Genesys Cloud Services

  10.6.3.1 Company Overview & Snapshot

  10.6.3.2 Product/Service Portfolio

  10.6.3.3 Key Company Financials

  10.6.3.4 SWOT Analysis

 10.6.4 Cisco Systems Inc.

  10.6.4.1 Company Overview & Snapshot

  10.6.4.2 Product/Service Portfolio

  10.6.4.3 Key Company Financials

  10.6.4.4 SWOT Analysis

 10.6.5 Avaya Holdings Corp.

  10.6.5.1 Company Overview & Snapshot

  10.6.5.2 Product/Service Portfolio

  10.6.5.3 Key Company Financials

  10.6.5.4 SWOT Analysis

 10.6.6 Calabrio Inc.

  10.6.6.1 Company Overview & Snapshot

  10.6.6.2 Product/Service Portfolio

  10.6.6.3 Key Company Financials

  10.6.6.4 SWOT Analysis

 10.6.7 Five9 Inc.

  10.6.7.1 Company Overview & Snapshot

  10.6.7.2 Product/Service Portfolio

  10.6.7.3 Key Company Financials

  10.6.7.4 SWOT Analysis

 10.6.8 Talkdesk Inc.

  10.6.8.1 Company Overview & Snapshot

  10.6.8.2 Product/Service Portfolio

  10.6.8.3 Key Company Financials

  10.6.8.4 SWOT Analysis

 10.6.9 8x8 Inc.

  10.6.9.1 Company Overview & Snapshot

  10.6.9.2 Product/Service Portfolio

  10.6.9.3 Key Company Financials

  10.6.9.4 SWOT Analysis

 10.6.10 Oracle Corporation

  10.6.10.1 Company Overview & Snapshot

  10.6.10.2 Product/Service Portfolio

  10.6.10.3 Key Company Financials

  10.6.10.4 SWOT Analysis

 10.6.11 RingCentral Inc.

  10.6.11.1 Company Overview & Snapshot

  10.6.11.2 Product/Service Portfolio

  10.6.11.3 Key Company Financials

  10.6.11.4 SWOT Analysis

 10.6.12 Zendesk Inc.

  10.6.12.1 Company Overview & Snapshot

  10.6.12.2 Product/Service Portfolio

  10.6.12.3 Key Company Financials

  10.6.12.4 SWOT Analysis

 10.6.13 Salesforce.com Inc.

  10.6.13.1 Company Overview & Snapshot

  10.6.13.2 Product/Service Portfolio

  10.6.13.3 Key Company Financials

  10.6.13.4 SWOT Analysis

 10.6.14 Mitel Networks Corporation

  10.6.14.1 Company Overview & Snapshot

  10.6.14.2 Product/Service Portfolio

  10.6.14.3 Key Company Financials

  10.6.14.4 SWOT Analysis

 10.6.15 Aspect Software Inc.

  10.6.15.1 Company Overview & Snapshot

  10.6.15.2 Product/Service Portfolio

  10.6.15.3 Key Company Financials

  10.6.15.4 SWOT Analysis

 10.6.16 SAP SE

  10.6.16.1 Company Overview & Snapshot

  10.6.16.2 Product/Service Portfolio

  10.6.16.3 Key Company Financials

  10.6.16.4 SWOT Analysis

 10.6.17 Alcatel-Lucent Enterprise

  10.6.17.1 Company Overview & Snapshot

  10.6.17.2 Product/Service Portfolio

  10.6.17.3 Key Company Financials

  10.6.17.4 SWOT Analysis

 10.6.18 Vonage Holdings Corp.

  10.6.18.1 Company Overview & Snapshot

  10.6.18.2 Product/Service Portfolio

  10.6.18.3 Key Company Financials

  10.6.18.4 SWOT Analysis

 10.6.19 IBM Corporation

  10.6.19.1 Company Overview & Snapshot

  10.6.19.2 Product/Service Portfolio

  10.6.19.3 Key Company Financials

  10.6.19.4 SWOT Analysis

 10.6.20 Amazon Connect

  10.6.20.1 Company Overview & Snapshot

  10.6.20.2 Product/Service Portfolio

  10.6.20.3 Key Company Financials

  10.6.20.4 SWOT Analysis

11. Analyst Recommendations

 11.1 SNS Insider Opportunity Map

 11.2 Industry Low-Hanging Fruit Assessment

 11.3 Market Entry & Growth Strategy

 11.4 Analyst Viewpoint & Suggestions On Market Growth

12. Assumptions

13. Disclaimer

14. Appendix

 14.1 List Of Tables

 14.2 List Of Figures

Key Segments: 

By Application

  • Contact Center Optimization

  • Sales Performance Improvement

  • Customer Engagement Enhancement

By Deployment Mode

  • Cloud-Based

  • On-Premises

By Component

  • Software

  • Services

  • Consulting

By End User

  • BFSI

  • Healthcare

  • Retail

  • Telecommunication

Request for Segment Customization as per your Business Requirement: Segment Customization Request

Regional Coverage: 

North America

  • US

  • Canada

Europe

  • Germany

  • France

  • UK

  • Italy

  • Spain

  • Poland

  • Russia

  • Rest of Europe

Asia Pacific

  • China

  • India

  • Japan

  • South Korea

  • Australia

  • ASEAN Countries

  • Rest of Asia Pacific

Middle East & Africa

  • UAE

  • Saudi Arabia

  • Qatar

  • South Africa

  • Rest of Middle East & Africa

Latin America

  • Brazil

  • Argentina

  • Mexico

  • Colombia

  • Rest of Latin America

Request for Country Level Research Report: Country Level Customization Request

Available Customization 

With the given market data, SNS Insider offers customization as per the company’s specific needs. The following customization options are available for the report: 

  • Detailed Volume Analysis 

  • Criss-Cross segment analysis (e.g. Product X Application) 

  • Competitive Product Benchmarking 

  • Geographic Analysis 

  • Additional countries in any of the regions 

  • Customized Data Representation 

  • Detailed analysis and profiling of additional market players

An accurate research report requires proper strategizing as well as implementation. There are multiple factors involved in the completion of good and accurate research report and selecting the best methodology to compete the research is the toughest part. Since the research reports we provide play a crucial role in any company’s decision-making process, therefore we at SNS Insider always believe that we should choose the best method which gives us results closer to reality. This allows us to reach at a stage wherein we can provide our clients best and accurate investment to output ratio.

Each report that we prepare takes a timeframe of 350-400 business hours for production. Starting from the selection of titles through a couple of in-depth brain storming session to the final QC process before uploading our titles on our website we dedicate around 350 working hours. The titles are selected based on their current market cap and the foreseen CAGR and growth.


The 5 steps process:

Step 1: Secondary Research:

Secondary Research or Desk Research is as the name suggests is a research process wherein, we collect data through the readily available information. In this process we use various paid and unpaid databases which our team has access to and gather data through the same. This includes examining of listed companies’ annual reports, Journals, SEC filling etc. Apart from this our team has access to various associations across the globe across different industries. Lastly, we have exchange relationships with various university as well as individual libraries.

Secondary Research

Step 2: Primary Research

When we talk about primary research, it is a type of study in which the researchers collect relevant data samples directly, rather than relying on previously collected data.  This type of research is focused on gaining content specific facts that can be sued to solve specific problems. Since the collected data is fresh and first hand therefore it makes the study more accurate and genuine.

We at SNS Insider have divided Primary Research into 2 parts.

Part 1 wherein we interview the KOLs of major players as well as the upcoming ones across various geographic regions. This allows us to have their view over the market scenario and acts as an important tool to come closer to the accurate market numbers. As many as 45 paid and unpaid primary interviews are taken from both the demand and supply side of the industry to make sure we land at an accurate judgement and analysis of the market.

This step involves the triangulation of data wherein our team analyses the interview transcripts, online survey responses and observation of on filed participants. The below mentioned chart should give a better understanding of the part 1 of the primary interview.

Primary Research

Part 2: In this part of primary research the data collected via secondary research and the part 1 of the primary research is validated with the interviews from individual consultants and subject matter experts.

Consultants are those set of people who have at least 12 years of experience and expertise within the industry whereas Subject Matter Experts are those with at least 15 years of experience behind their back within the same space. The data with the help of two main processes i.e., FGDs (Focused Group Discussions) and IDs (Individual Discussions). This gives us a 3rd party nonbiased primary view of the market scenario making it a more dependable one while collation of the data pointers.

Step 3: Data Bank Validation

Once all the information is collected via primary and secondary sources, we run that information for data validation. At our intelligence centre our research heads track a lot of information related to the market which includes the quarterly reports, the daily stock prices, and other relevant information. Our data bank server gets updated every fortnight and that is how the information which we collected using our primary and secondary information is revalidated in real time.

Data Bank Validation

Step 4: QA/QC Process

After all the data collection and validation our team does a final level of quality check and quality assurance to get rid of any unwanted or undesired mistakes. This might include but not limited to getting rid of the any typos, duplication of numbers or missing of any important information. The people involved in this process include technical content writers, research heads and graphics people. Once this process is completed the title gets uploader on our platform for our clients to read it.

Step 5: Final QC/QA Process:

This is the last process and comes when the client has ordered the study. In this process a final QA/QC is done before the study is emailed to the client. Since we believe in giving our clients a good experience of our research studies, therefore, to make sure that we do not lack at our end in any way humanly possible we do a final round of quality check and then dispatch the study to the client.