Print On Demand Market was valued at USD 9.34 billion in 2024 and is expected to reach USD 54.73 billion by 2032, growing at a CAGR of 24.85% from 2025-2032.
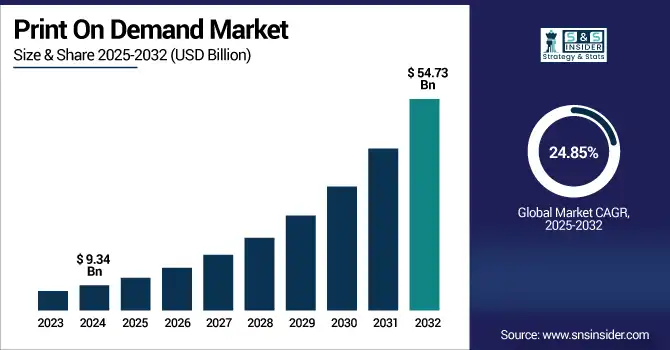
The Print On Demand (PoD) market is growing rapidly due to increasing demand for personalized and customized products across categories like apparel, home décor, and accessories.
Shopify reports that 49% of consumers want personalized products and are willing to pay more for them. Its low startup costs, zero-inventory model, and integration with platforms like Shopify, Etsy, and Amazon make it attractive to entrepreneurs and creators.
In 2023, Etsy had over 95 million active buyers many of whom purchased custom, handmade, or PoD items via integrated seller platforms. Amazon's KDP Print allows creators to publish books on demand with no upfront investment and offers royalties of up to 60% on the list price, making it appealing to independent authors.
Advances in digital printing technologies have improved design flexibility, production efficiency, and turnaround time. The rise of social media and creator-driven commerce enables influencers and artists to easily launch branded merchandise.
Additionally, Printify states that on-demand production helps reduce waste by only producing when there is demand minimizing overproduction by 30–40% compared to traditional retail.
U.S. Print On Demand Market was valued at USD 2.50 billion in 2024 and is expected to reach USD 14.37 billion by 2032, growing at a CAGR of 24.43% from 2025-2032.
Growth in the U.S. Print On Demand market is driven by high consumer demand for customized products, strong e-commerce infrastructure, widespread use of digital printing technologies, and a surge in independent creators leveraging platforms like Shopify and Etsy for merchandise sales.
Drivers
Rising e-commerce penetration and demand for customized products are fueling growth in the global Print On Demand market ecosystem
Rapid expansion of e-commerce platforms globally is significantly boosting the Print On Demand market. Consumers increasingly prefer personalized products like apparel, accessories, and books tailored to their preferences. Print On Demand enables small businesses and individual creators to design and sell without holding inventory, aligning well with this customization trend. With low entry barriers, creative entrepreneurs leverage digital storefronts and POD partners to monetize designs. The convenience and scalability of the model attract both buyers and sellers, driving demand. As online shopping surges and personalization becomes a norm, Print On Demand continues to scale in reach and volume.
UNCTAD reports that business e‑commerce sales across 43 developed and developing economies accounting for about 75% of global GDP reached US $27 trillion in 2022, up nearly 10% from 2021; between 2016 and 2022, the increase was around 60%.
Restraints
Limited control over product quality and fulfillment timelines often impacts customer satisfaction and brand credibility
Print On Demand businesses frequently rely on third-party service providers for printing, packaging, and shipping, resulting in limited oversight. Delays in delivery or inconsistencies in print quality can tarnish customer experience and lead to negative reviews or returns. Brands have little control over order errors, packaging standards, or shipping issues, which can reduce customer loyalty. In a highly competitive market, maintaining consistent quality is essential to differentiation. As a result, reliance on external fulfillment chains becomes a strategic risk, especially for emerging brands striving to build trust and retain customers in a fast-moving digital environment.
Opportunities
Integration of AI and automation tools can personalize offerings and streamline Print On Demand operations at scale
Emerging technologies such as AI-driven design generation, predictive analytics, and automated order management are creating new efficiencies in the POD market. These tools allow businesses to forecast demand, customize products based on user data, and automate customer interactions. Personalized marketing and product recommendations improve conversion rates, while automated printing and shipping reduce human error. By embracing these innovations, sellers can offer highly tailored experiences with lower operational effort. This technological transformation is enabling mass customization at scale, opening new revenue streams and improving responsiveness to market trends, thus expanding the potential and appeal of Print On Demand services.
According to Shopify (2024): 57% of marketers now use AI-generated images, and 56% use AI to auto-generate text such as product descriptions. 25% of marketers leverage AI specifically for product copy, essential for POD.
Businesses using AI automation save an average of 2.5 hours per day, and AI-driven demand forecasting can reduce inventory levels by 20–30% without impacting service, freeing up capital for POD sellers.
Challenges
Dependence on third-party platforms and service providers reduces control and limits strategic differentiation for Print On Demand brands
Many POD sellers operate through marketplaces like Etsy, Amazon, or Shopify-integrated platforms, which restrict control over branding, customer data, and fulfillment. These dependencies constrain customization of the buyer experience and expose sellers to policy changes or platform outages. Additionally, reliance on external printers and logistics providers means operational disruptions can arise without notice. This lack of vertical integration can impede long-term brand development and make businesses vulnerable to third-party risks. As the market evolves, building proprietary capabilities becomes necessary for differentiation, but doing so requires resources most small players lack posing a significant structural challenge.
By Platform
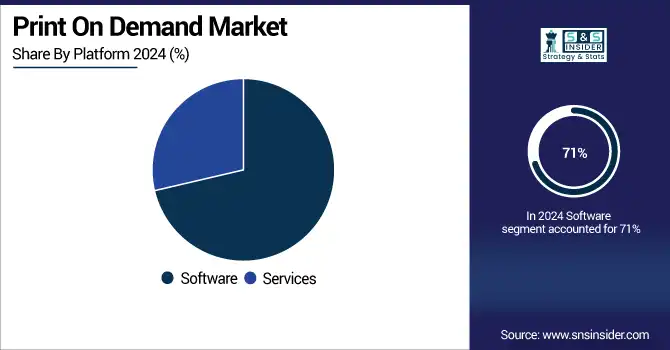
Software segment dominated the Print On Demand Market with the highest revenue share of about 71% in 2024 due to its central role in enabling customization, automation, and seamless integration across platforms. These software solutions streamline workflows, simplify design creation, and manage inventory-free order processing. Their versatility supports a wide range of users from entrepreneurs to enterprises—making software indispensable for scaling and managing Print On Demand operations efficiently.
Services segment is expected to grow at the fastest CAGR of about 26.24% from 2025–2032, driven by increasing demand for value-added offerings like design assistance, branding support, and end-to-end fulfillment. As competition rises, sellers seek differentiation through professional services that improve customer experience and reduce operational burdens. This growing reliance on outsourced expertise to scale businesses fuels rapid growth in the services segment across the Print On Demand landscape.
By End User
Fashion & Apparel segment dominated the Print On Demand Market with the highest revenue share of about 42% in 2024, largely due to high consumer demand for personalized clothing, quick trend adaptation, and visual creativity. Apparel is the most accessible entry point for creators and brands, supported by mature manufacturing infrastructure and high repeat purchase potential. The emotional appeal of wearable identity continues to drive consistent market dominance in this category.
Art & Creative segment is expected to grow at the fastest CAGR of about 28.98% from 2025–2032, fueled by a surge in independent artists using POD platforms to monetize illustrations, digital prints, and graphic content. The rise of creator economies and online art communities has broadened access to global audiences. Low upfront costs and flexible formats make Print On Demand ideal for distributing creative content across multiple mediums.
By Product
Apparel segment dominated the Print On Demand Market with the highest revenue share of about 44% in 2024 because of its massive consumer base, wide product variety, and continuous demand for personalized fashion. Clothing items like t-shirts and hoodies are inexpensive to produce, widely worn, and frequently purchased, making them ideal for customization. Their strong emotional and identity appeal sustains high volumes and profitability in the Print On Demand space.
Home Décor segment is expected to grow at the fastest CAGR of about 28.05% from 2025–2032, driven by increasing consumer interest in personalized interiors and unique decorative pieces. Print On Demand enables affordable customization of items like wall art, cushions, and posters tailored to individual tastes. As home aesthetics gain prominence through social media and lifestyle trends, the demand for personalized décor is accelerating rapidly across diverse consumer segments.
By Technology
Digital Printing segment dominated the Print On Demand Market with the highest revenue share of about 59% in 2024 and is expected to grow at the fastest CAGR of about 43.61% from 2025–2032 due to its ability to deliver high-quality, on-demand prints with minimal setup costs and rapid turnaround. It supports mass customization and short-run production, which are core to the Print On Demand model. Its compatibility with a wide range of substrates, vibrant color output, and eco-friendliness make it the preferred choice for creators and businesses seeking speed, flexibility, and cost-efficiency in personalized product manufacturing.
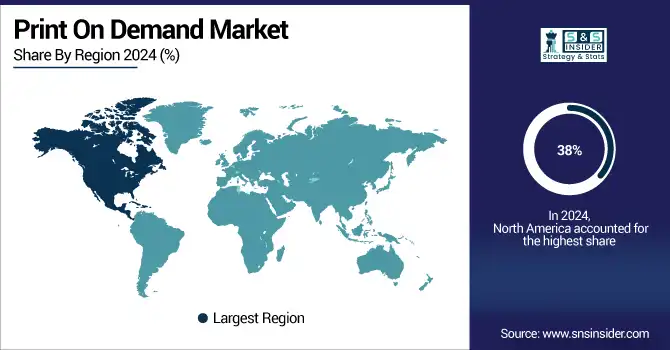
North America dominated the Print On Demand Market with the highest revenue share of about 38% in 2024 due to strong e-commerce infrastructure, high consumer spending on personalized goods, and the presence of major POD platforms. The region’s mature digital ecosystem, advanced logistics networks, and early adoption of customization trends have fueled sustained demand, making it the central hub for innovation and revenue generation in the Print On Demand industry.
The United States is dominating the Print On Demand market due to its advanced e-commerce ecosystem, strong consumer demand, and presence of major POD platforms.
Asia Pacific is expected to grow at the fastest CAGR of about 26.80% from 2025–2032, driven by expanding internet access, rapid e-commerce growth, and a rising middle-class population. Increasing digital literacy, growing youth demographics, and greater smartphone penetration are encouraging small businesses and individuals to adopt Print On Demand solutions. Localized content, low manufacturing costs, and regional startup activity further amplify the region’s growth potential in the POD space.
China is dominating the Print On Demand market in the Asia Pacific region due to its massive manufacturing capacity, e-commerce leadership, and rapid digital adoption.
Europe holds a strong position in the Print On Demand market due to its mature e-commerce landscape, growing consumer preference for personalized products, and increasing emphasis on sustainable, on-demand production methods supported by advanced digital infrastructure.
The United Kingdom is dominating the Print On Demand market in Europe due to high online retail adoption, creative industries, and strong customization demand.
Middle East & Africa and Latin America are emerging regions in the Print On Demand market, supported by increasing internet access, expanding e-commerce penetration, growing youth populations, and rising entrepreneurial activity leveraging digital platforms for customized product offerings.
Print On Demand Market companies are Spreadshirt (SPOD - Spreadshirt Print-On-Demand), TeeSpring (Spring), Society6, Printify, Inc., Printful Inc., Canva, VistaPrint (Cimpress), CustomCat, Gelato, Gooten, Printed Mint, Teelaunch, Zazzle, Inc., Redbubble Group, T-Pop, Apliiq, Amplifier, Printsome, Prodigi Group, JetPrint Fulfillment.
2025: Printful unveiled 86 new Kornit Digital Atlas MAX direct‑to‑garment printers across its fulfillment network, boosting print quality and color consistency, as confirmed at Impressions Expo.
2024: Printful and Printify announced a merger as equal partners to enhance product selection, global reach, and fulfillment capabilities; both brands continue operating independently.
2023: Redbubble partnered with ecommerce tech firm Rokt to integrate AI‑powered offers at checkout across eight marketplaces, aiming to increase transaction‑moment revenue.
Report Attributes | Details |
---|---|
Market Size in 2024 | USD 9.34 Billion |
Market Size by 2032 | USD 54.73 Billion |
CAGR | CAGR of 24.85% From 2025 to 2032 |
Base Year | 2024 |
Forecast Period | 2025-2032 |
Historical Data | 2021-2023 |
Report Scope & Coverage | Market Size, Segments Analysis, Competitive Landscape, Regional Analysis, DROC & SWOT Analysis, Forecast Outlook |
Key Segments | • By Platform (Software, Services) • By Product (Apparel, Home Decor, Drinkware, Accessories, Others) • By Technology (Digital Printing, Offset Printing, Flexographic Printing, Screen Printing) • By End User (Fashion & Apparel, Furnishing, Publishing, Art & Creative, Corporate, Education, Others) |
Regional Analysis/Coverage | North America (US, Canada), Europe (Germany, UK, France, Italy, Spain, Russia, Poland, Rest of Europe), Asia Pacific (China, India, Japan, South Korea, Australia, ASEAN Countries, Rest of Asia Pacific), Middle East & Africa (UAE, Saudi Arabia, Qatar, South Africa, Rest of Middle East & Africa), Latin America (Brazil, Argentina, Mexico, Colombia, Rest of Latin America). |
Company Profiles | Spreadshirt (SPOD - Spreadshirt Print-On-Demand), TeeSpring (Spring), Society6, Printify, Inc., Printful Inc., Canva, VistaPrint (Cimpress), CustomCat, Gelato, Gooten, Printed Mint, Teelaunch, Zazzle, Inc., Redbubble Group, T-Pop, Apliiq, Amplifier, Printsome, Prodigi Group, JetPrint Fulfillment |
Ans: The market is projected to grow at a CAGR of 24.85% from 2025 to 2032, driven by personalization and digital commerce trends.
Ans: In 2024, the Print On Demand Market was valued at USD 9.34 billion, supported by strong e-commerce demand and customization preferences.
Ans: Rising demand for personalized products, low startup costs, and seamless e-commerce integration are key drivers of Print On Demand growth.
Ans: The Software segment dominated with 71% share in 2024, enabling automation, customization, and efficient integration across digital selling platforms.
Ans: North America led with 38% market share in 2024 due to strong infrastructure, consumer demand, and presence of major POD platforms.
Table Of Contents
1. Introduction
1.1 Market Definition & Scope
1.2 Research Assumptions & Abbreviations
1.3 Research Methodology
2. Executive Summary
2.1 Market Snapshot
2.2 Market Absolute $ Opportunity Assessment & Y-o-Y Analysis, 2021–2032
2.3 Market Size & Forecast, By Segmentation, 2021–2032
2.3.1 Market Size By Product
2.3.2 Market Size By Technology
2.3.1 Market Size By Platform
2.3.2 Market Size By End User
2.4 Market Share & Bps Analysis By Region, 2024
2.5 Industry Growth Scenarios – Conservative, Likely & Optimistic
2.6 Industry CxO’s Perspective
3. Market Overview
3.1 Market Dynamics
3.1.1 Drivers
3.1.2 Restraints
3.1.3 Opportunities
3.1.4 Key Market Trends
3.2 Industry PESTLE Analysis
3.3 Key Industry Forces (Porter’s) Impacting Market Growth
3.4 Industry Supply Chain Analysis
3.4.1 Raw Material Suppliers
3.4.2 Manufacturers
3.4.3 Distributors/Suppliers
3.4.4 Customers/End-Users
3.5 Industry Life Cycle Assessment
3.6 Parent Market Overview
3.7 Market Risk Assessment
4. Statistical Insights & Trends Reporting
4.1 Platform Usage Statistics
4.1.1 Overview
4.1.2 Market Share by Platform Type (e.g., Etsy, Shopify, Amazon, Redbubble)
4.1.3 Web vs. Mobile Purchase Split
4.1.4 Conversion Rate (%) of PoD Storefronts
4.1.5 Traffic Sources (Organic, Paid, Social, etc.)
4.2 Fulfillment and Logistics Metrics
4.2.1 Overview
4.2.2 Average Production Time (in Days) per Product Category
4.2.3 Average Shipping Time by Region
4.2.4 Return Rate (%) for PoD Items
4.2.5 Sustainability Metrics (e.g., % Using Eco-Friendly Packaging)
4.3 Technology Adoption
4.3.1 Overview
4.3.2 AI/ML Usage Rate in Design Recommendations or Inventory Planning
4.3.3 3D Printing Adoption Rate in PoD (for Apparel, Accessories, etc.)
4.3.4 Percentage of Cloud-Based PoD Platforms
4.3.5 API Integrations per Store (Average) (e.g., with Inventory, CRM, or ERP)
4.4 Seller Statistics
4.4.1 Overview
4.4.2 Number of Active PoD Sellers Globally/Regionally
4.4.3 Annual Revenue Distribution per Seller Tier (Small, Mid, Large)
4.4.4 Top Countries by Seller Concentration
4.4.5 Growth Rate of New Store Setups per Year
5. Print On Demand Market Segmental Analysis & Forecast, By Product, 2021 – 2032, Value (Usd Billion) & Volume (Order Volume)
5.1 Introduction
5.2 Apparel
5.2.1 Key Trends
5.2.2 Market Size & Forecast, 2021 – 2032
5.3 Home Decor
5.3.1 Key Trends
5.3.2 Market Size & Forecast, 2021 – 2032
5.4 Drinkware
5.4.1 Key Trends
5.4.2 Market Size & Forecast, 2021 – 2032
5.5 Accessories
5.5.1 Key Trends
5.5.2 Market Size & Forecast, 2021 – 2032
5.6 Others
5.6.1 Key Trends
5.6.2 Market Size & Forecast, 2021 – 2032
6. Print On Demand Market Segmental Analysis & Forecast, By Technology, 2021 – 2032, Value (Usd Billion) & Volume (Order Volume)
6.1 Introduction
6.2 Digital Printing
6.2.1 Key Trends
6.2.2 Market Size & Forecast, 2021 – 2032
6.3 Offset Printing
6.3.1 Key Trends
6.3.2 Market Size & Forecast, 2021 – 2032
6.4 Flexographic Printing
6.4.1 Key Trends
6.4.2 Market Size & Forecast, 2021 – 2032
6.5 Screen Printing
6.5.1 Key Trends
6.5.2 Market Size & Forecast, 2021 – 2032
7. Print On Demand Market Segmental Analysis & Forecast, By Platform, 2021 – 2032, Value (Usd Billion) & Volume (Order Volume)
7.1 Introduction
7.2 Software
7.2.1 Key Trends
7.2.2 Market Size & Forecast, 2021 – 2032
7.3 Services
7.3.1 Key Trends
7.3.2 Market Size & Forecast, 2021 – 2032
8. Print On Demand Market Segmental Analysis & Forecast, By End User, 2021 – 2032, Value (Usd Billion) & Volume (Order Volume)
8.1 Introduction
8.2 Fashion & Apparel
8.2.1 Key Trends
8.2.2 Market Size & Forecast, 2021 – 2032
8.3 Furnishing
8.3.1 Key Trends
8.3.2 Market Size & Forecast, 2021 – 2032
8.4 Publishing
8.4.1 Key Trends
8.4.2 Market Size & Forecast, 2021 – 2032
8.5 Art & Creative
8.5.1 Key Trends
8.5.2 Market Size & Forecast, 2021 – 2032
8.6 Corporate
8.6.1 Key Trends
8.6.2 Market Size & Forecast, 2021 – 2032
8.7 Education
8.7.1 Key Trends
8.7.2 Market Size & Forecast, 2021 – 2032
8.8 Others
8.8.1 Key Trends
8.8.2 Market Size & Forecast, 2021 – 2032
9. Print On Demand Market Segmental Analysis & Forecast By Region, 2021 – 2025, Value (Usd Billion) & Volume (Order Volume)
9.1 Introduction
9.2 North America
9.2.1 Key Trends
9.2.2 Print On Demand Market Size & Forecast, By Product, 2021 – 2032
9.2.3 Print On Demand Market Size & Forecast, By Technology, 2021 – 2032
9.2.4 Print On Demand Market Size & Forecast, By Platform, 2021 – 2032
9.2.5 Print On Demand Market Size & Forecast, By End User, 2021 – 2032
9.2.6 Print On Demand Market Size & Forecast, By Country, 2021 – 2032
9.2.6.1 USA
9.2.6.1.1 Print On Demand Market Size & Forecast, By Product, 2021 – 2032
9.2.6.1.2 Print On Demand Market Size & Forecast, By Technology, 2021 – 2032
9.2.6.1.3 Print On Demand Market Size & Forecast, By Platform, 2021 – 2032
9.2.6.1.4 Print On Demand Market Size & Forecast, By End User, 2021 – 2032
9.2.6.2 Canada
9.2.6.2.1 Print On Demand Market Size & Forecast, By Product, 2021 – 2032
9.2.6.2.2 Print On Demand Market Size & Forecast, By Technology, 2021 – 2032
9.2.6.2.3 Print On Demand Market Size & Forecast, By Platform, 2021 – 2032
9.2.6.2.4 Print On Demand Market Size & Forecast, By End User, 2021 – 2032
9.3 Europe
9.3.1 Key Trends
9.3.2 Print On Demand Market Size & Forecast, By Product, 2021 – 2032
9.3.3 Print On Demand Market Size & Forecast, By Technology, 2021 – 2032
9.3.4 Print On Demand Market Size & Forecast, By Platform, 2021 – 2032
9.3.5 Print On Demand Market Size & Forecast, By End User, 2021 – 2032
9.3.6 Print On Demand Market Size & Forecast, By Country, 2021 – 2032
9.3.6.1 Germany
9.3.6.1.1 Print On Demand Market Size & Forecast, By Product, 2021 – 2032
9.3.6.1.2 Print On Demand Market Size & Forecast, By Technology, 2021 – 2032
9.3.6.1.3 Print On Demand Market Size & Forecast, By Platform, 2021 – 2032
9.3.6.1.4 Print On Demand Market Size & Forecast, By End User, 2021 – 2032
9.3.6.2 UK
9.3.6.2.1 Print On Demand Market Size & Forecast, By Product, 2021 – 2032
9.3.6.2.2 Print On Demand Market Size & Forecast, By Technology, 2021 – 2032
9.3.6.2.3 Print On Demand Market Size & Forecast, By Platform, 2021 – 2032
9.3.6.2.4 Print On Demand Market Size & Forecast, By End User, 2021 – 2032
9.3.6.3 France
9.3.6.3.1 Print On Demand Market Size & Forecast, By Product, 2021 – 2032
9.3.6.3.2 Print On Demand Market Size & Forecast, By Technology, 2021 – 2032
9.3.6.3.3 Print On Demand Market Size & Forecast, By Platform, 2021 – 2032
9.3.6.3.4 Print On Demand Market Size & Forecast, By End User, 2021 – 2032
9.3.6.4 Italy
9.3.6.4.1 Print On Demand Market Size & Forecast, By Product, 2021 – 2032
9.3.6.4.2 Print On Demand Market Size & Forecast, By Technology, 2021 – 2032
9.3.6.4.3 Print On Demand Market Size & Forecast, By Platform, 2021 – 2032
9.3.6.4.4 Print On Demand Market Size & Forecast, By End User, 2021 – 2032
9.3.6.5 Spain
9.3.6.5.1 Print On Demand Market Size & Forecast, By Product, 2021 – 2032
9.3.6.5.2 Print On Demand Market Size & Forecast, By Technology, 2021 – 2032
9.3.6.5.3 Print On Demand Market Size & Forecast, By Platform, 2021 – 2032
9.3.6.5.4 Print On Demand Market Size & Forecast, By End User, 2021 – 2032
9.3.6.6 Russia
9.3.6.6.1 Print On Demand Market Size & Forecast, By Product, 2021 – 2032
9.3.6.6.2 Print On Demand Market Size & Forecast, By Technology, 2021 – 2032
9.3.6.6.3 Print On Demand Market Size & Forecast, By Platform, 2021 – 2032
9.3.6.6.4 Print On Demand Market Size & Forecast, By End User, 2021 – 2032
9.3.6.7 Poland
9.3.6.7.1 Print On Demand Market Size & Forecast, By Product, 2021 – 2032
9.3.6.7.2 Print On Demand Market Size & Forecast, By Technology, 2021 – 2032
9.3.6.7.3 Print On Demand Market Size & Forecast, By Platform, 2021 – 2032
9.3.6.7.4 Print On Demand Market Size & Forecast, By End User, 2021 – 2032
9.3.6.8 Rest of Europe
9.3.6.8.1 Print On Demand Market Size & Forecast, By Product, 2021 – 2032
9.3.6.8.2 Print On Demand Market Size & Forecast, By Technology, 2021 – 2032
9.3.6.8.3 Print On Demand Market Size & Forecast, By Platform, 2021 – 2032
9.3.6.8.4 Print On Demand Market Size & Forecast, By End User, 2021 – 2032
9.4 Asia-Pacific
9.4.1 Key Trends
9.4.2 Print On Demand Market Size & Forecast, By Product, 2021 – 2032
9.4.3 Print On Demand Market Size & Forecast, By Technology, 2021 – 2032
9.4.4 Print On Demand Market Size & Forecast, By Platform, 2021 – 2032
9.4.5 Print On Demand Market Size & Forecast, By End User, 2021 – 2032
9.4.6 Print On Demand Market Size & Forecast, By Country, 2021 – 2032
9.4.6.1 China
9.4.6.1.1 Print On Demand Market Size & Forecast, By Product, 2021 – 2032
9.4.6.1.2 Print On Demand Market Size & Forecast, By Technology, 2021 – 2032
9.4.6.1.3 Print On Demand Market Size & Forecast, By Platform, 2021 – 2032
9.4.6.1.4 Print On Demand Market Size & Forecast, By End User, 2021 – 2032
9.4.6.2 India
9.4.6.2.1 Print On Demand Market Size & Forecast, By Product, 2021 – 2032
9.4.6.2.2 Print On Demand Market Size & Forecast, By Technology, 2021 – 2032
9.4.6.2.3 Print On Demand Market Size & Forecast, By Platform, 2021 – 2032
9.4.6.2.4 Print On Demand Market Size & Forecast, By End User, 2021 – 2032
9.4.6.3 Japan
9.4.6.3.1 Print On Demand Market Size & Forecast, By Product, 2021 – 2032
9.4.6.3.2 Print On Demand Market Size & Forecast, By Technology, 2021 – 2032
9.4.6.3.3 Print On Demand Market Size & Forecast, By Platform, 2021 – 2032
9.4.6.3.4 Print On Demand Market Size & Forecast, By End User, 2021 – 2032
9.4.6.4 South Korea
9.4.6.4.1 Print On Demand Market Size & Forecast, By Product, 2021 – 2032
9.4.6.4.2 Print On Demand Market Size & Forecast, By Technology, 2021 – 2032
9.4.6.4.3 Print On Demand Market Size & Forecast, By Platform, 2021 – 2032
9.4.6.4.4 Print On Demand Market Size & Forecast, By End User, 2021 – 2032
9.4.6.5 Australia
9.4.6.5.1 Print On Demand Market Size & Forecast, By Product, 2021 – 2032
9.4.6.5.2 Print On Demand Market Size & Forecast, By Technology, 2021 – 2032
9.4.6.5.3 Print On Demand Market Size & Forecast, By Platform, 2021 – 2032
9.4.6.5.4 Print On Demand Market Size & Forecast, By End User, 2021 – 2032
9.4.6.6 ASEAN Countries
9.4.6.6.1 Print On Demand Market Size & Forecast, By Product, 2021 – 2032
9.4.6.6.2 Print On Demand Market Size & Forecast, By Technology, 2021 – 2032
9.4.6.6.3 Print On Demand Market Size & Forecast, By Platform, 2021 – 2032
9.4.6.6.4 Print On Demand Market Size & Forecast, By End User, 2021 – 2032
9.4.6.7 Rest of Asia-Pacific
9.4.6.7.1 Print On Demand Market Size & Forecast, By Product, 2021 – 2032
9.4.6.7.2 Print On Demand Market Size & Forecast, By Technology, 2021 – 2032
9.4.6.7.3 Print On Demand Market Size & Forecast, By Platform, 2021 – 2032
9.4.6.7.4 Print On Demand Market Size & Forecast, By End User, 2021 – 2032
9.5 Latin America
9.5.1 Key Trends
9.5.2 Print On Demand Market Size & Forecast, By Product, 2021 – 2032
9.5.3 Print On Demand Market Size & Forecast, By Technology, 2021 – 2032
9.5.4 Print On Demand Market Size & Forecast, By Platform, 2021 – 2032
9.5.5 Print On Demand Market Size & Forecast, By End User, 2021 – 2032
9.5.6 Print On Demand Market Size & Forecast, By Country, 2021 – 2032
9.5.6.1 Brazil
9.5.6.1.1 Print On Demand Market Size & Forecast, By Product, 2021 – 2032
9.5.6.1.2 Print On Demand Market Size & Forecast, By Technology, 2021 – 2032
9.5.6.1.3 Print On Demand Market Size & Forecast, By Platform, 2021 – 2032
9.5.6.1.4 Print On Demand Market Size & Forecast, By End User, 2021 – 2032
9.5.6.2 Argentina
9.5.6.2.1 Print On Demand Market Size & Forecast, By Product, 2021 – 2032
9.5.6.2.2 Print On Demand Market Size & Forecast, By Technology, 2021 – 2032
9.5.6.2.3 Print On Demand Market Size & Forecast, By Platform, 2021 – 2032
9.5.6.2.4 Print On Demand Market Size & Forecast, By End User, 2021 – 2032
9.5.6.3 Mexico
9.5.6.3.1 Print On Demand Market Size & Forecast, By Product, 2021 – 2032
9.5.6.3.2 Print On Demand Market Size & Forecast, By Technology, 2021 – 2032
9.5.6.3.3 Print On Demand Market Size & Forecast, By Platform, 2021 – 2032
9.5.6.3.4 Print On Demand Market Size & Forecast, By End User, 2021 – 2032
9.5.6.4 Colombia
9.5.6.4.1 Print On Demand Market Size & Forecast, By Product, 2021 – 2032
9.5.6.4.2 Print On Demand Market Size & Forecast, By Technology, 2021 – 2032
9.5.6.4.3 Print On Demand Market Size & Forecast, By Platform, 2021 – 2032
9.5.6.4.4 Print On Demand Market Size & Forecast, By End User, 2021 – 2032
9.5.6.5 Rest of Latin America
9.5.6.5.1 Print On Demand Market Size & Forecast, By Product, 2021 – 2032
9.5.6.5.2 Print On Demand Market Size & Forecast, By Technology, 2021 – 2032
9.5.6.5.3 Print On Demand Market Size & Forecast, By Platform, 2021 – 2032
9.5.6.5.4 Print On Demand Market Size & Forecast, By End User, 2021 – 2032
9.6 Middle East & Africa
9.6.1 Key Trends
9.6.2 Print On Demand Market Size & Forecast, By Product, 2021 – 2032
9.6.3 Print On Demand Market Size & Forecast, By Technology, 2021 – 2032
9.6.4 Print On Demand Market Size & Forecast, By Platform, 2021 – 2032
9.6.5 Print On Demand Market Size & Forecast, By End User, 2021 – 2032
9.6.6 Print On Demand Market Size & Forecast, By Country, 2021 – 2032
9.6.6.1 UAE
9.6.6.1.1 Print On Demand Market Size & Forecast, By Product, 2021 – 2032
9.6.6.1.2 Print On Demand Market Size & Forecast, By Technology, 2021 – 2032
9.6.6.1.3 Print On Demand Market Size & Forecast, By Platform, 2021 – 2032
9.6.6.1.4 Print On Demand Market Size & Forecast, By End User, 2021 – 2032
9.6.6.2 Saudi Arabia
9.6.6.2.1 Print On Demand Market Size & Forecast, By Product, 2021 – 2032
9.6.6.2.2 Print On Demand Market Size & Forecast, By Technology, 2021 – 2032
9.6.6.2.3 Print On Demand Market Size & Forecast, By Platform, 2021 – 2032
9.6.6.2.4 Print On Demand Market Size & Forecast, By End User, 2021 – 2032
9.6.6.3 Qatar
9.6.6.3.1 Print On Demand Market Size & Forecast, By Product, 2021 – 2032
9.6.6.3.2 Print On Demand Market Size & Forecast, By Technology, 2021 – 2032
9.6.6.3.3 Print On Demand Market Size & Forecast, By Platform, 2021 – 2032
9.6.6.3.4 Print On Demand Market Size & Forecast, By End User, 2021 – 2032
9.6.6.4 Egypt
9.6.6.4.1 Print On Demand Market Size & Forecast, By Product, 2021 – 2032
9.6.6.4.2 Print On Demand Market Size & Forecast, By Technology, 2021 – 2032
9.6.6.4.3 Print On Demand Market Size & Forecast, By Platform, 2021 – 2032
9.6.6.4.4 Print On Demand Market Size & Forecast, By End User, 2021 – 2032
9.6.6.5 South Africa
9.6.6.5.1 Print On Demand Market Size & Forecast, By Product, 2021 – 2032
9.6.6.5.2 Print On Demand Market Size & Forecast, By Technology, 2021 – 2032
9.6.6.5.3 Print On Demand Market Size & Forecast, By Platform, 2021 – 2032
9.6.6.5.4 Print On Demand Market Size & Forecast, By End User, 2021 – 2032
9.6.6.6 Rest of Middle East & Africa
9.6.6.6.1 Print On Demand Market Size & Forecast, By Product, 2021 – 2032
9.6.6.6.2 Print On Demand Market Size & Forecast, By Technology, 2021 – 2032
9.6.6.6.3 Print On Demand Market Size & Forecast, By Platform, 2021 – 2032
9.6.6.6.4 Print On Demand Market Size & Forecast, By End User, 2021 – 2032
10. Competitive Landscape
10.1 Key Players' Positioning
10.2 Competitive Developments
10.2.1 Key Strategies Adopted (%), By Key Players, 2024
10.2.2 Year-Wise Strategies & Development, 2021 – 2025
10.2.3 Number Of Strategies Adopted By Key Players, 2024
10.3 Market Share Analysis, 2024
10.4 Product/Service & Application Benchmarking
10.4.1 Product/Service Specifications & Features By Key Players
10.4.2 Product/Service Heatmap By Key Players
10.4.3 Application Heatmap By Key Players
10.5 Industry Start-Up & Innovation Landscape
10.6 Key Company Profiles
10.6.1 Spreadshirt (SPOD - Spreadshirt Print-On-Demand)
10.6.1.1 Company Overview & Snapshot
10.6.1.2 Product/Service Portfolio
10.6.1.3 Key Company Financials
10.6.1.4 SWOT Analysis
10.6.2 TeeSpring (Spring)
10.6.2.1 Company Overview & Snapshot
10.6.2.2 Product/Service Portfolio
10.6.2.3 Key Company Financials
10.6.2.4 SWOT Analysis
10.6.3 Society6
10.6.3.1 Company Overview & Snapshot
10.6.3.2 Product/Service Portfolio
10.6.3.3 Key Company Financials
10.6.3.4 SWOT Analysis
10.6.4 Printify, Inc.
10.6.4.1 Company Overview & Snapshot
10.6.4.2 Product/Service Portfolio
10.6.4.3 Key Company Financials
10.6.4.4 SWOT Analysis
10.6.5 Printful Inc.
10.6.5.1 Company Overview & Snapshot
10.6.5.2 Product/Service Portfolio
10.6.5.3 Key Company Financials
10.6.5.4 SWOT Analysis
10.6.6 Canva
10.6.6.1 Company Overview & Snapshot
10.6.6.2 Product/Service Portfolio
10.6.6.3 Key Company Financials
10.6.6.4 SWOT Analysis
10.6.7 VistaPrint (Cimpress)
10.6.7.1 Company Overview & Snapshot
10.6.7.2 Product/Service Portfolio
10.6.7.3 Key Company Financials
10.6.7.4 SWOT Analysis
10.6.8 CustomCat
10.6.8.1 Company Overview & Snapshot
10.6.8.2 Product/Service Portfolio
10.6.8.3 Key Company Financials
10.6.8.4 SWOT Analysis
10.6.9 Gelato
10.6.9.1 Company Overview & Snapshot
10.6.9.2 Product/Service Portfolio
10.6.9.3 Key Company Financials
10.6.9.4 SWOT Analysis
10.6.10 Gooten
10.6.10.1 Company Overview & Snapshot
10.6.10.2 Product/Service Portfolio
10.6.10.3 Key Company Financials
10.6.10.4 SWOT Analysis
10.6.11 Printed Mint
10.6.11.1 Company Overview & Snapshot
10.6.11.2 Product/Service Portfolio
10.6.11.3 Key Company Financials
10.6.11.4 SWOT Analysis
10.6.12 Teelaunch
10.6.12.1 Company Overview & Snapshot
10.6.12.2 Product/Service Portfolio
10.6.12.3 Key Company Financials
10.6.12.4 SWOT Analysis
10.6.13 Zazzle, Inc.
10.6.13.1 Company Overview & Snapshot
10.6.13.2 Product/Service Portfolio
10.6.13.3 Key Company Financials
10.6.13.4 SWOT Analysis
10.6.14 Redbubble Group
10.6.14.1 Company Overview & Snapshot
10.6.14.2 Product/Service Portfolio
10.6.14.3 Key Company Financials
10.6.14.4 SWOT Analysis
10.6.15 T-Pop
10.6.15.1 Company Overview & Snapshot
10.6.15.2 Product/Service Portfolio
10.6.15.3 Key Company Financials
10.6.15.4 SWOT Analysis
10.6.16 Apliiq
10.6.16.1 Company Overview & Snapshot
10.6.16.2 Product/Service Portfolio
10.6.16.3 Key Company Financials
10.6.16.4 SWOT Analysis
10.6.17 Amplifier
10.6.17.1 Company Overview & Snapshot
10.6.17.2 Product/Service Portfolio
10.6.17.3 Key Company Financials
10.6.17.4 SWOT Analysis
10.6.18 Printsome
10.6.18.1 Company Overview & Snapshot
10.6.18.2 Product/Service Portfolio
10.6.18.3 Key Company Financials
10.6.18.4 SWOT Analysis
10.6.19 Prodigi Group
10.6.19.1 Company Overview & Snapshot
10.6.19.2 Product/Service Portfolio
10.6.19.3 Key Company Financials
10.6.19.4 SWOT Analysis
10.6.20 JetPrint Fulfillment
10.6.20.1 Company Overview & Snapshot
10.6.20.2 Product/Service Portfolio
10.6.20.3 Key Company Financials
10.6.20.4 SWOT Analysis
11. Analyst Recommendations
11.1 SNS Insider Opportunity Map
11.2 Industry Low-Hanging Fruit Assessment
11.3 Market Entry & Growth Strategy
11.4 Analyst Viewpoint & Suggestions On Market Growth
12. Assumptions
13. Disclaimer
14. Appendix
14.1 List Of Tables
14.2 List Of Figures
An accurate research report requires proper strategizing as well as implementation. There are multiple factors involved in the completion of good and accurate research report and selecting the best methodology to compete the research is the toughest part. Since the research reports we provide play a crucial role in any company’s decision-making process, therefore we at SNS Insider always believe that we should choose the best method which gives us results closer to reality. This allows us to reach at a stage wherein we can provide our clients best and accurate investment to output ratio.
Each report that we prepare takes a timeframe of 350-400 business hours for production. Starting from the selection of titles through a couple of in-depth brain storming session to the final QC process before uploading our titles on our website we dedicate around 350 working hours. The titles are selected based on their current market cap and the foreseen CAGR and growth.
The 5 steps process:
Step 1: Secondary Research:
Secondary Research or Desk Research is as the name suggests is a research process wherein, we collect data through the readily available information. In this process we use various paid and unpaid databases which our team has access to and gather data through the same. This includes examining of listed companies’ annual reports, Journals, SEC filling etc. Apart from this our team has access to various associations across the globe across different industries. Lastly, we have exchange relationships with various university as well as individual libraries.
Step 2: Primary Research
When we talk about primary research, it is a type of study in which the researchers collect relevant data samples directly, rather than relying on previously collected data. This type of research is focused on gaining content specific facts that can be sued to solve specific problems. Since the collected data is fresh and first hand therefore it makes the study more accurate and genuine.
We at SNS Insider have divided Primary Research into 2 parts.
Part 1 wherein we interview the KOLs of major players as well as the upcoming ones across various geographic regions. This allows us to have their view over the market scenario and acts as an important tool to come closer to the accurate market numbers. As many as 45 paid and unpaid primary interviews are taken from both the demand and supply side of the industry to make sure we land at an accurate judgement and analysis of the market.
This step involves the triangulation of data wherein our team analyses the interview transcripts, online survey responses and observation of on filed participants. The below mentioned chart should give a better understanding of the part 1 of the primary interview.
Part 2: In this part of primary research the data collected via secondary research and the part 1 of the primary research is validated with the interviews from individual consultants and subject matter experts.
Consultants are those set of people who have at least 12 years of experience and expertise within the industry whereas Subject Matter Experts are those with at least 15 years of experience behind their back within the same space. The data with the help of two main processes i.e., FGDs (Focused Group Discussions) and IDs (Individual Discussions). This gives us a 3rd party nonbiased primary view of the market scenario making it a more dependable one while collation of the data pointers.
Step 3: Data Bank Validation
Once all the information is collected via primary and secondary sources, we run that information for data validation. At our intelligence centre our research heads track a lot of information related to the market which includes the quarterly reports, the daily stock prices, and other relevant information. Our data bank server gets updated every fortnight and that is how the information which we collected using our primary and secondary information is revalidated in real time.
Step 4: QA/QC Process
After all the data collection and validation our team does a final level of quality check and quality assurance to get rid of any unwanted or undesired mistakes. This might include but not limited to getting rid of the any typos, duplication of numbers or missing of any important information. The people involved in this process include technical content writers, research heads and graphics people. Once this process is completed the title gets uploader on our platform for our clients to read it.
Step 5: Final QC/QA Process:
This is the last process and comes when the client has ordered the study. In this process a final QA/QC is done before the study is emailed to the client. Since we believe in giving our clients a good experience of our research studies, therefore, to make sure that we do not lack at our end in any way humanly possible we do a final round of quality check and then dispatch the study to the client.
Key Segments:
By Platform
Software
Services
By Product
Apparel
Home Decor
Drinkware
Accessories
Others
By Technology
Digital Printing
Offset Printing
Flexographic Printing
Screen Printing
By End User
Fashion & Apparel
Furnishing
Publishing
Art & Creative
Corporate
Education
Others
Request for Segment Customization as per your Business Requirement: Segment Customization Request
Regional Coverage:
North America
US
Canada
Europe
Germany
France
UK
Italy
Spain
Poland
Russia
Rest of Europe
Asia Pacific
China
India
Japan
South Korea
Australia
ASEAN Countries
Rest of Asia Pacific
Middle East & Africa
UAE
Saudi Arabia
Qatar
South Africa
Rest of Middle East & Africa
Latin America
Brazil
Argentina
Mexico
Colombia
Rest of Latin America
Request for Country Level Research Report: Country Level Customization Request
Available Customization
With the given market data, SNS Insider offers customization as per the company’s specific needs. The following customization options are available for the report:
Detailed Volume Analysis
Criss-Cross segment analysis (e.g. Product X Application)
Competitive Product Benchmarking
Geographic Analysis
Additional countries in any of the regions
Customized Data Representation
Detailed analysis and profiling of additional market players