Agricultural Textiles Market Report Scope & Overview:
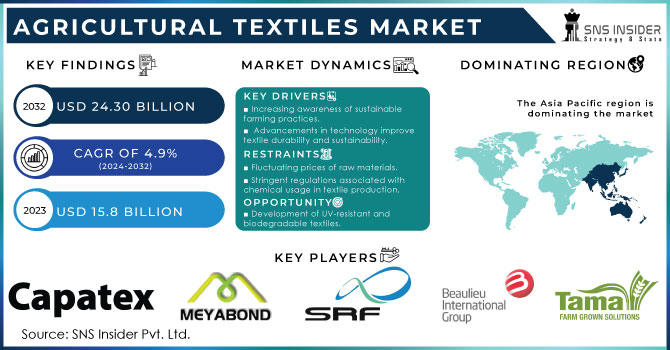
The Agricultural Textiles Market Size was valued at USD 15.8 billion in 2023 and is expected to reach USD 24.3 billion by 2032 and grow at a CAGR of 4.9% over the forecast period 2024-2032.
Get More Information on Agricultural Textiles Market - Request Sample Report
The agricultural textiles market is evolving rapidly, driven by the growing need for sustainable farming practices and increased agricultural productivity. As global populations rise, there is an urgent demand for innovative solutions that enhance crop yields while minimizing environmental impacts. Key market dynamics include the increasing adoption of precision farming techniques, the need for climate-resilient materials, and the integration of smart technologies into textile products. These factors collectively contribute to the development of textiles that protect crops from pests and harsh weather conditions and promote sustainable farming practices.
Recent innovations highlight the adaptability of agricultural textiles to address climate change challenges. For instance, in April 2024, advancements in fabric technology are allowing textiles to provide better insulation and moisture management, which are crucial in extreme weather conditions. This innovation enables farmers to create microclimates around crops, improving growth and resilience against heat waves and excessive rainfall. The shift towards eco-friendly materials is also notable, with manufacturers increasingly focusing on biopolymers and recycled materials, which align with global sustainability goals.
Sustainability is further emphasized by the enhancements in farming practices made possible by agricultural textiles. In January 2024, the introduction of lightweight, breathable materials that enhance soil health and moisture retention was reported. These textiles help minimize water usage, which is crucial for water scarcity regions. Furthermore, the integration of color-changing technologies in these fabrics allows farmers to monitor crop health in real time, facilitating timely interventions. This kind of innovation reflects a broader trend where agricultural textiles not only serve as protective covers but also as vital tools in precision farming.
Another significant development occurred in December 2023, when companies showcased innovations in agricultural textile fabrics designed for a range of applications, from crop covers to nets and bags. The focus was on increasing the durability and effectiveness of these materials, ensuring they can withstand various environmental stressors while being cost-effective for farmers. The introduction of multifunctional textiles that combine pest protection with UV resistance signifies a shift towards products that offer multiple benefits, thereby enhancing their value in the agricultural sector.
The market's trajectory is also shaped by collaborations between textile manufacturers and agricultural experts. These partnerships are essential in researching and developing textiles that meet the specific needs of farmers while adhering to sustainability principles. As the agricultural textiles sector continues to adapt and innovate, it plays a pivotal role in transforming farming into a more sustainable and productive industry, ultimately supporting global food security. Through the ongoing development of smart, sustainable textile solutions, the agricultural textiles market is poised to significantly impact modern agricultural practices, fostering a more resilient and sustainable approach to farming.
Agricultural Textiles Market Dynamics:
Drivers:
-
Increasing Focus on Sustainable Agricultural Practices Is a Significant Driver for The Agricultural Textiles Market
The increasing focus on sustainable agricultural practices is a significant driver for the agricultural textiles market. With rising awareness about environmental conservation and the need to reduce chemical inputs, farmers are seeking eco-friendly solutions that can help them achieve higher productivity without compromising soil health. The shift towards sustainable farming practices is being influenced by consumer demand for organic and environmentally friendly produce. Agricultural textiles play a crucial role in this transformation by offering protective measures that reduce the reliance on chemical pesticides and fertilizers. For instance, biodegradable mulch films and nets can effectively control weeds and pests while promoting soil health. These textiles contribute to creating a balanced ecosystem, allowing beneficial organisms to thrive and supporting sustainable practices. Additionally, sustainable textiles often use renewable materials, reducing the carbon footprint of agricultural operations. Farmers are increasingly investing in these innovative solutions to meet regulatory requirements and consumer preferences, ultimately driving market growth. Moreover, the implementation of eco-certification processes is encouraging manufacturers to develop textiles that adhere to sustainable practices, further boosting the market. As the agricultural sector continues to embrace sustainability, the demand for agricultural textiles is expected to increase significantly, leading to innovations that address the challenges of modern farming while promoting environmental stewardship
-
Technological Advancements in Textile Manufacturing is propelling the Agricultural Textiles market
The agricultural textiles market is significantly driven by technological advancements in textile manufacturing. Innovations such as smart textiles, nanotechnology, and automation are transforming the production and functionality of agricultural fabrics, enhancing their effectiveness and efficiency in various applications. Modern technological advancements have enabled the development of multifunctional textiles that incorporate features such as UV protection, moisture control, and pest deterrence. For example, the integration of nanotechnology allows for the creation of textiles that repel pests without harmful chemicals, thereby promoting safer farming practices. Additionally, smart textiles equipped with sensors can provide real-time data on environmental conditions, enabling farmers to make informed decisions regarding irrigation, fertilization, and pest management. Automation in textile production also leads to increased efficiency and cost-effectiveness, allowing manufacturers to meet the growing demand for high-quality agricultural textiles. As these technologies continue to evolve, they offer new opportunities for enhanced crop protection and yield improvement. The agricultural textiles sector is experiencing a rapid transformation, with companies investing in research and development to create innovative products that cater to the changing needs of farmers. Consequently, technological advancements not only drive market growth but also enhance the overall productivity and sustainability of agricultural practices.
Restraint:
-
Limited Awareness and Adoption of These Products Among Farmers, Particularly in Developing Regions Is Hampering the Growth Of The Market
A significant restraint in the agricultural textiles market is the limited awareness and adoption of these products among farmers, particularly in developing regions. Despite the numerous benefits that agricultural textiles offer, many farmers are hesitant to invest in these solutions due to a lack of knowledge and understanding of their advantages. The adoption of agricultural textiles often requires an initial investment, which can be a barrier for small-scale farmers operating on tight budgets. Many farmers are unaware of how these textiles can improve crop yields, reduce labor costs, and minimize resource use. Additionally, the availability of agricultural textiles can be limited in certain regions, making it challenging for farmers to access these products. Education and outreach programs are essential to bridge this gap, providing farmers with the necessary information to understand the benefits of agricultural textiles. Training initiatives can showcase successful case studies where these textiles have led to increased productivity and sustainability. Moreover, demonstrating the long-term cost savings associated with using agricultural textiles can encourage adoption. As awareness grows and access to these products improves, more farmers will likely recognize the value of agricultural textiles, ultimately driving market growth. Overcoming this restraint will require collaborative efforts from manufacturers, agricultural experts, and governmental organizations to promote the benefits and availability of these innovative solutions.
Opportunity:
-
Increasing Focus on Environmental Sustainability Presents a Significant Opportunity for The Agricultural Textiles Market
The increasing focus on environmental sustainability presents a significant opportunity for the agricultural textiles market, particularly in the development of biodegradable and eco-friendly textiles. As consumers demand greener products and practices, agricultural textiles that align with these preferences are gaining traction. The rising awareness of plastic pollution and its impact on agriculture has created a demand for sustainable alternatives. Biodegradable mulch films, plant covers, and nets are gaining popularity among farmers looking to reduce their environmental footprint while maintaining productivity. These eco-friendly textiles not only decompose naturally but also contribute to soil health, enhancing fertility and reducing the need for chemical inputs. Furthermore, advancements in biopolymer technology are enabling the creation of high-performance textiles that offer the same protective benefits as traditional materials. This shift towards sustainable options not only helps in meeting consumer demand but also aligns with regulatory pressures to reduce plastic use in agriculture. As more governments and organizations implement initiatives to promote sustainable farming practices, the demand for biodegradable agricultural textiles is expected to rise. Companies that focus on innovation in this area will likely find new growth avenues, positioning themselves as leaders in the sustainable agriculture movement. This opportunity not only supports environmental goals but also meets the evolving needs of farmers, creating a win-win situation for all stakeholders involved.
Challenge:
-
Competition from Traditional Textile Alternatives Poses a Significant challenge for The Agricultural Textiles Market
The agricultural textiles market faces significant challenges from competition posed by traditional textile alternatives. While agricultural textiles offer numerous benefits, conventional materials such as plastic films and nets continue to dominate the market due to their established presence and lower initial costs. Many farmers still rely on traditional textiles, as they are familiar with their properties and performance. The perception that conventional materials are more cost-effective can hinder the adoption of innovative agricultural textiles, even when the latter may offer superior benefits in terms of sustainability and long-term cost savings. Additionally, the initial investment in advanced agricultural textiles can be perceived as a financial burden, especially for small-scale farmers with limited resources. Overcoming this challenge requires manufacturers to clearly communicate the advantages of agricultural textiles, emphasizing their effectiveness, durability, and long-term benefits. Education and outreach efforts can help demonstrate the potential for increased yields and reduced input costs associated with using these advanced materials. Moreover, strategic collaborations with agricultural stakeholders can enhance the visibility and acceptance of agricultural textiles in the market. As the industry evolves and more farmers become aware of the benefits offered by innovative textile solutions, the challenge posed by traditional alternatives can be mitigated, paving the way for market growth.
Agricultural Textiles Market Segmentation Analysis
By Fiber Material
In 2023, the Polypropylene segment dominated the agricultural textiles market, holding an estimated market share of approximately 40%. This dominance can be attributed to the material's excellent durability, resistance to chemicals, and lightweight nature, making it ideal for various agricultural applications such as crop covers, mulch films, and nets. Polypropylene's cost-effectiveness compared to other materials like nylon and polyester also contributes to its widespread use among farmers. Additionally, its versatility allows for easy customization in terms of thickness and texture, catering to diverse agricultural needs. For instance, polypropylene mulch films help in weed control and moisture retention, leading to improved crop yields. The increasing demand for sustainable agricultural practices further enhances the appeal of polypropylene, as it can be produced with recycled content and is recyclable at the end of its life cycle. This combination of properties and advantages solidifies polypropylene's position as the leading segment in the agricultural textiles market.
By Fabric Formation Technology
In 2023, the Nonwoven segment dominated the agricultural textiles market, accounting for an estimated market share of approximately 55%. This dominance stems from the unique properties of nonwoven fabrics, including their lightweight, breathable, and moisture-resistant characteristics, which make them ideal for various agricultural applications such as crop covers, weed control mats, and erosion control fabrics. Nonwoven materials can be produced using a variety of raw materials, including polypropylene and polyester, offering versatility in functionality and cost-effectiveness. For example, nonwoven geotextiles are extensively used in agriculture for soil stabilization and drainage, effectively preventing soil erosion while allowing water to pass through. The growing trend towards sustainable practices has also bolstered the nonwoven segment, as these fabrics can be manufactured using biodegradable materials, appealing to environmentally conscious farmers. This combination of functionality, performance, and adaptability to diverse agricultural needs solidifies the nonwoven segment's leading position in the market.
By Product Type
In 2023, the Shade Nets/Cloths segment dominated the agricultural textiles market, with an estimated market share of approximately 30%. This leading position is primarily due to the increasing demand for shade nets in horticulture and nurseries, where they are used to protect plants from excessive sunlight and harsh weather conditions. Shade nets effectively reduce heat and control light intensity, creating a more favorable microclimate for plant growth. For instance, they are commonly employed in growing vegetables, flowers, and young trees, helping to minimize heat stress and promote healthy development. Additionally, the rising trend of greenhouse farming further boosts the demand for shade nets, as they provide essential protection while allowing for proper air circulation. The versatility of shade nets, which can be customized in terms of shade percentage and color, enhances their appeal among farmers seeking effective solutions for improving crop yield and quality. This combination of practicality and effectiveness solidifies the shade nets/cloths segment's dominance in the agricultural textiles market.
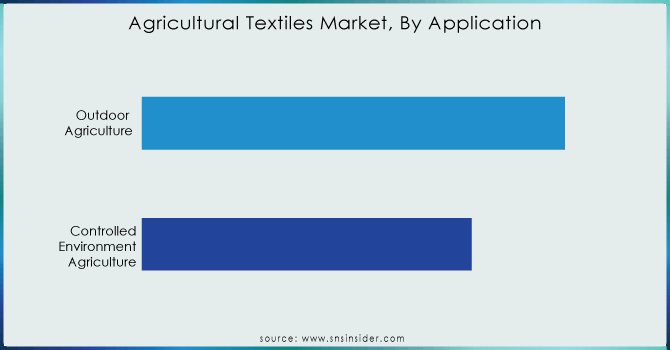
By Application
In 2023, the Agriculture segment dominated the agricultural textiles market, holding an estimated market share of approximately 60%. This significant share is largely attributed to the essential role agricultural textiles play in enhancing crop production and protection. Products such as mulch films, shade nets, and protective covers are widely used to improve soil quality, control pests, and optimize growing conditions. For example, mulch films help retain soil moisture and suppress weed growth, directly contributing to higher yields and reduced labor costs for farmers. Additionally, agricultural textiles provide critical support for sustainable farming practices, such as reducing chemical inputs and minimizing environmental impact. As the global demand for food continues to rise, the reliance on agricultural textiles to improve productivity and resource efficiency in conventional farming practices further solidifies this segment's leading position in the market. The ongoing adoption of innovative textile solutions tailored for agriculture continues to drive growth in this segment, ensuring its dominance within the overall agricultural textiles market.
Get Customized Report as per Your Business Requirement - Request For Customized Report
Agricultural Textiles Market Regional Outlook
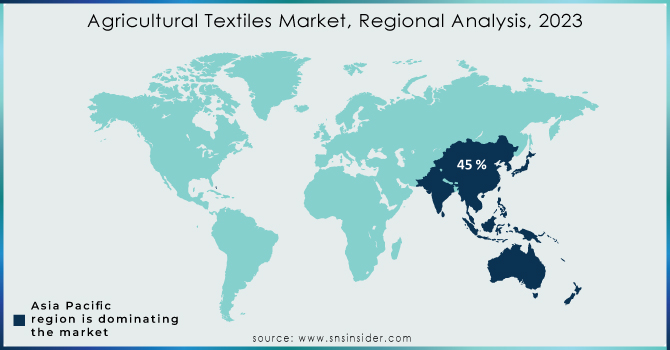
In 2023, the North American region dominated the agricultural textiles market, holding an estimated market share of approximately 35%. This dominance is primarily driven by the high adoption of advanced agricultural practices and technology among farmers in the United States and Canada. The increasing focus on sustainable farming methods has led to a growing demand for agricultural textiles that enhance crop protection and yield. For instance, the use of biodegradable mulch films and shade nets is becoming more prevalent as farmers seek eco-friendly solutions to improve productivity while minimizing environmental impact. Additionally, government initiatives promoting sustainable agriculture and research and development investments in innovative textile solutions are further bolstering the market in North America, solidifying its leading position.
Moreover, in 2023, the Asia-Pacific region emerged as the fastest-growing region in the agricultural textiles market, with an estimated CAGR of around 8%. This rapid growth can be attributed to the increasing agricultural activities and the rising demand for food in densely populated countries like India and China. The adoption of agricultural textiles such as shade nets and mulch films is gaining traction among farmers as they seek to enhance crop yields and protect their produce from environmental stressors. For example, the Indian government’s initiatives to promote modern farming techniques and improve productivity are encouraging farmers to invest in agricultural textiles, contributing to the region's growth. Furthermore, the growing awareness of sustainable practices and the need to combat climate change are prompting investments in innovative textile solutions, positioning the Asia-Pacific region as a key player in the agricultural textiles market.
Key Players
-
B&V Agro Irrigation Co. (drip irrigation systems, shade nets)
-
Beaulieu Technical Textiles (geotextiles, mulch films)
-
Belton Industries, Inc. (crop covers, horticultural nets)
-
Capatex Ltd. (anti-hail nets, crop protection fabrics)
-
Diatex (nonwoven crop covers, weed control fabrics)
-
FarmTek (greenhouse films, shade cloth)
-
Feldhues GmbH (woven ground covers, crop protection nets)
-
Hebei Aining Import and Export Co. Ltd. (agricultural tarps, shade nets)
-
Hy-Tex (U.K.) Ltd (fleece covers, anti-insect nets)
-
Meyabond Industry & Trading (Beijing) Co. Ltd. (mulch films, weed control mats)
-
Neo Corp International Ltd (agricultural mulch films, geotextiles)
-
RKW Group (silage films, greenhouse covers)
-
Sefar AG (separation and filtration fabrics, crop protection nets)
-
SRF Ltd (multi-layer films, crop covers)
-
Tama Plastic Industry (mulch films, crop protection covers)
-
TenCate Geosynthetics (geotextiles, erosion control fabrics)
-
Textiles Vallès (shade nets, insect nets)
-
Trelleborg AB (agricultural covers, silage bags)
-
Utexbel (woven and nonwoven fabrics, shade nets)
-
Zhongshan Hongjun Nonwovens Co. Ltd. (nonwoven fabric for agriculture, weed control fabric)
Recent Development:
-
In July 2020, Beaulieu Technical Textiles introduced Agrolys WH FR, the first halogen-free, flame-retardant reflective woven groundcover in the market.
| Report Attributes | Details |
|---|---|
| Market Size in 2023 | USD 15.8 Billion |
| Market Size by 2032 | USD 24.3 Billion |
| CAGR | CAGR of 4.9% From 2024 to 2032 |
| Base Year | 2023 |
| Forecast Period | 2024-2032 |
| Historical Data | 2020-2022 |
| Report Scope & Coverage | Market Size, Segments Analysis, Competitive Landscape, Regional Analysis, DROC & SWOT Analysis, Forecast Outlook |
| Key Segments | • By Fiber Material (Nylon, Polypropylene, Polyethylene, Natural Fibers, Polyester, Biodegradable Synthetic Fibers, and Others) • By Fabric Formation Technology (Woven, Nonwoven, Knitted, and Others) • By Product Type (Shade Nets/Cloths, Mulch Mats, Fishing Nets, Anti-Hail Nets And Bird Protection Nets, and Others) • By Application (Controlled-Environment Agriculture and Outdoor Agriculture) |
| Regional Analysis/Coverage | North America (US, Canada, Mexico), Europe (Eastern Europe [Poland, Romania, Hungary, Turkey, Rest of Eastern Europe] Western Europe] Germany, France, UK, Italy, Spain, Netherlands, Switzerland, Austria, Rest of Western Europe]), Asia Pacific (China, India, Japan, South Korea, Vietnam, Singapore, Australia, Rest of Asia Pacific), Middle East & Africa (Middle East [UAE, Egypt, Saudi Arabia, Qatar, Rest of Middle East], Africa [Nigeria, South Africa, Rest of Africa], Latin America (Brazil, Argentina, Colombia, Rest of Latin America) |
| Company Profiles | Tama Plastic Industry, Diatex, Hy-Tex (U.K.) Ltd, Beaulieu Technical Textiles, Hebei Aining Import and Export Co. Ltd., B&V Agro Irrigation Co., Meyabond Industry & Trading (Beijing) Co. Ltd., SRF Ltd., Capatex Ltd., Neo Corp International Ltd, Belton Industries, Inc., Zhongshan Hongjun Nonwovens Co. Ltd |
Get in Touch
