Amorphous Polyethylene Terephthalate Market Report Scope & Overview:
The Amorphous Polyethylene Terephthalate Market was valued at USD 46.62 billion in 2023 and is expected to reach USD 89.53 billion by 2032, growing at a CAGR of 7.55% over the forecast period 2024-2032.

Get More Information on Amorphous Polyethylene Terephthalate Market - Request Sample Report
The amorphous Polyethylene terephthalate market is expanding owing to the versatility of properties and dictation high application. APET is another common type with its excellent clarity, toughness, and recyclability which make it widely used for bottles, films, sheets, and food packaging. These properties make it an ideal packaging material, especially in the food and beverage market, where demand for durability and sustainability is steadily increasing among consumers. A high strength-to-weight ratio in APET benefits increases the demand for APET in pharmaceuticals and consumer goods, which supports the growth of the APET market. APET maintains transparency and still provides barrier protection for products, making it a mainstay of packaging solutions. APET has a recycling rate of 30%, whereby carbon emissions are reduced by 60% through recycling. APET Bottles represent about 45% of bottled beverage packaging in 2023, and recycled APET can save 50% of the energy for producing virgin APET. Moreover, APET recycling helps decrease the energy used in the process by 84% and greenhouse gas emissions by 71%.
The anticipated development in the APET market astounding base is additionally ascribed to a rising accentuation on sustainable and natural foundation materials. Environmental consciousness is at its peak and manufacturers are switching to APET for its recyclability rate which is in line with global standards for lowering plastic waste. There is thus continued demand for APET as an alternative because the growth of regulations to limit single-use plastic and promote recycling is real. Additionally, although the demand for APET would be driven due to urbanization and population growth across the globe, the rise in demand in emerging markets across Asia Pacific and Latin American economies would significantly boost the demand for APET in the forecast period, particularly for food and beverage packaging. In the U.S. the rate increased from 34.2% to 36.8 % for PET bottles. Enhanced collection systems that keep plastic waste out of landfills have been successful, diverting as much as 46% of plastic in California. APET adoption is also supported by the European Union's goal of putting at least 30% recycled content in all packaging by 2030.
Amorphous Polyethylene Terephthalate Market Dynamics
KEY DRIVERS:
-
Rising Demand for Convenient Food Packaging and E-Commerce Drives APET Adoption in Global Markets
The key factor driving demand for Amorphous Polyethylene Terephthalate is high demand for convenience and ready-to-use food packaging. As people are leading busier lives and opting for on-the-go products, the demand for packaging that protects the freshness and quality of the food, while also being user-friendly, is rising. Due to its great sealability, barrier protection, product tightness, and even sturdiness during distribution and storage, APET is a good packaging material for ready-to-eat meals, snacks, and drinks. The changing consumer preference in developed and emerging economies towards pre-packaged and single-served food products is expected to create a high APET market. The increasing trend of e-commerce and home delivery has also boosted the requirement for safe and reliable packaging materials, which is effectively provided by APET. In India and China, more than 40% of packaged foods have switched to single-serving formats, as global demand for ready-to-eat meals and snacks rose by 5-7% per year. The sector of e-commerce food delivery service has gone over 30%, which requires a stable form of packaging to preserve food hygiene like APET to protect during transportation. 25% of global food packaging efforts target sustainable materials in response to consumer preference and regulations
-
Advancements in APET Film Extrusion and Coating Technologies Drive Market Growth and Industry Adoption
One vital driver is the modernized innovations related to APET, principally top-to-bottom film extrusion and molding procedures. These innovations make for improved product performance, as well as a broader application range. Contemporary manufacturing processes have enabled the manufacture of mechanical strength, minimized APET with clarity, and chemical resistance suitable for a wider range of end-use industries including electronics, automotive, and personal care. In addition, the introduction of APET with custom coatings or multi-layer structures provides improved barrier functionality by blocking moisture, gases, and UV light, which is especially important for the preservation of moisture-sensitive products, such as pharmaceuticals and cosmetics. APET gaining traction in new applications owing to such developments and meeting the changing needs of industries is anticipated to propel market growth. In 2023, 100% recycled content APET, is manufactured in food contact certified by EFSA with available thicknesses from 150 to 1200 microns, allowing to provide custom barrier properties such as moisture, gas, and UV protection. Over 40% of the innovations in packaging are multi-layered, barrier-protected solutions making barrier-coated APET essential for moisture-sensitive products. Similarly, 25-30% of new packaging in categories such as electronics, automotive parts, and personal care is now APET, which is valued for its strength and barrier properties.
RESTRAIN:
-
High Production Costs and Recycling Challenges Hindering Widespread Adoption of APET in Packaging Solutions
The relatively high production cost of APET in comparison to other common plastics is a major obstacle to its widespread application, particularly in cost-sensitive sectors. Specialized production facilities and energy-intensive production methods increase the cost of manufacturing. This prevents even small and medium enterprises from using APET in their packaging solutions. A second area of difficulty is the minimized recycling capabilities that exist when it comes to the APET in certain areas. APET is recyclable, but built and available recycling facilities and systems are still greatly lacking. Despite its recyclability, environmental concerns can arise from the low levels of collection and recycling programs for APET. Further contamination risk compounds the issue, as waste that contains mixed materials tends to be less easily processed, negating some of the sustainability potential of the material. This could delay the adoption of APET in some markets.
Amorphous Polyethylene Terephthalate Market Segmentation Analysis
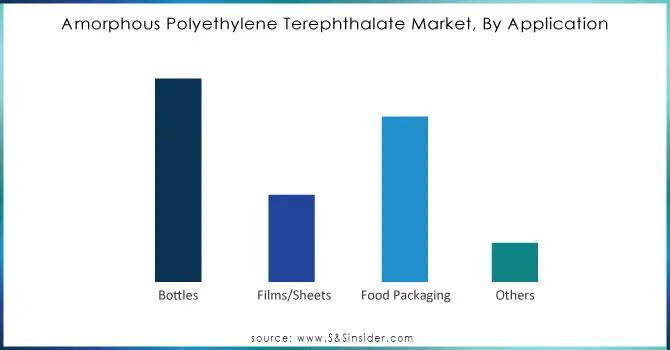
BY APPLICATION
Bottles accounted for the largest revenue share of 47% in 2023, as the terrific properties of APET such as high clarity and strength with good toughness, and easy manufacturing and processing make them useful to be used in various applications. Owing to its lightweight, strength, and cost-effectiveness, APET has become a material of choice for a wide range of bottled products including beverages, personal care, and household products. APET bottles have been dominating the market due to increased demand for packaging solutions that are recyclable, transparent, and sustainable in end-use industries including food & beverage, cosmetics, and cleaning products. In addition, its recyclability meets the increasing global call for lowering plastic waste which strengthens its prominence in the bottle sector
Food packaging will experience the fastest CAGR growth from 2024 to 2032 due to an increase in demand for easy-to-eat, ready-to-eat, and single-meal food products is increasing the demand for reliable packaging materials that preserve food quality and extend shelf life, enabling the convenience of portability. The good barrier properties of APET, such as moisture, oxygen, and UV light barrier make APET a preferred material for fresh, frozen, or processed foods packaging. In addition, APET has recyclability, which makes it a preferable substitute for non-eco-friendly materials as consumers’ awareness of sustainability heightens.
BY END USE
Food & Beverage accounted for a leading market share of 59% in 2023, which APET is an ideal choice due to its high performance in packaging food and drink products. APET gives terrific transparency, which means that products look good and appeal to consumers. The invention is also lightweight, and strong, and provides a high moisture, gas, and UV barrier essential for maintaining the quality, taste, and freshness of food and beverage. In this segment, the rising consumer demand for convenience, on-the-go food products as well as packaged beverages is anticipated to propel APET acceptance. Due to its recyclability, APET is also a suitable choice for food and beverage packaging, as the consumer demand for sustainable and recyclable packaging material continues its grow.
Pharmaceuticals are predicted to register the fastest CAGR during the forecast timespan, 2024 to 2032, owing to the growing demand for safe, tamper-proof & high-performance packaging materials. The high barrier protection of APET from moisture, oxygen, and light makes it suitable for most sensitive pharmaceutical products such as tablets, capsules, and liquids. In addition, the rising need for keeping product integrity, longer shelf life, and regulatory compliance of packaging materials in the pharmaceutical industry will drive the market for APET. Furthermore, as the global healthcare industry is expected to continue expansion, especially in emerging markets, demand for long-term sustainable packaging solutions will remain high, making for the fastest-growing sector in pharmaceutical packaging the APET.
Get Customized Report as per Your Business Requirement - Request For Customized Report
Amorphous Polyethylene Terephthalate Market Regional Outlook
Asia Pacific was the market leader with 46% in 2023 due to the fast industrialization, growing consumption, and development of packaging in the region. The food and beverage sector is seeing growing demand in emerging markets like China and India, which are a major driver of this dominance. APET is widely utilized for job bottled beverages, snacks, and instant meals, for instance, in China. To Meet such customer demand and cough up a Big Bulky to Big Names like Nongfu Sprint (Big Bottled Water Brand), Companies like these rely on APET for its transparency and durability. At the same time, the growth of e-commerce and delivery in the region has multiplied the need for suitable, lightweight packaging, driving the use of APET in food packaging and consumer packaged goods.
North America is projected to experience the fastest CAGR period from 2024 to 2032. The primary factor contributing to this growth is the rising demand for sustainability-based packaging solutions along with the requirement to cut down on plastic use. APET is gaining momentum in food and beverage packaging in the US while brands like Coca-Cola are moving over to APET on its green qualities. The rise of online grocery shopping and meal kit delivery services, including HelloFresh and Blue Apron, is also fuelling demand for APET packaging as these pre-portioned ingredients require protection and freshness while in transit as well. North America is likely to drive the rapidly growing APET market in the upcoming years with its sustainability and recycling initiatives.

Key players
Some of the major players in the Amorphous Polyethylene Terephthalate Market are:
-
Indorama Ventures (PET resin, ClearGuard™)
-
Reliance Industries Limited (PET resins, PET films)
-
Covestro AG (APET sheets, high-performance films)
-
M&G Chemicals (PET resins, APET films)
-
LOTTE Chemical Corporation (APET, PET sheets)
-
JBF Industries Ltd. (PET resins, packaging materials)
-
PolyQuest (APET films, food-grade PET resins)
-
Daiwa Can Company (APET, shrink films)
-
Shijiazhuang Sicong Technology Co. Ltd. (APET resin, recycled PET)
-
Quadrant AG (APET sheets, PET plastic packaging)
-
Polisan Holding (PET resins, PET sheets)
-
Teijin Limited (PET films, automotive materials)
-
Jiangsu Sanfangxiang (APET resin, packaging materials)
-
Alpek Polyester (PET resin, APET products)
-
Evergreen Plastics (APET sheets, PET recycling)
-
Toray Industries (APET films, plastic sheets)
-
Jiangsu Zhongtai International (PET resin, APET products)
-
SABIC (Recycled PET, APET resin)
-
OCTAL (PET resin, food-grade packaging)
-
MPI Polyester Industries (APET resin, films for packaging)
Some of the Raw Material Suppliers:
-
Reliance Industries Limited
-
M&G Chemicals
-
Covestro AG
-
DuPont
-
BASF
-
Eastman Chemical Company
-
SABIC
-
Indorama Ventures
-
LG Chem
-
Toray Industries
RECENT TRENDS
-
In October 2024, Indorama Ventures partnered with Suntory to launch the world’s first commercial PET bottles made from bio-paraxylene, derived from used cooking oil, marking a significant step in sustainable packaging.
-
In October 2024, Teijin Frontier launched OCTAIR, a premium insulation fiber for bedding and apparel, designed as an alternative to natural feathers. The company also introduced SOLOTEX OCTAIR, combining PTT fibers and OCTAIR™ for enhanced insulation, now available for global sale.
-
In November 2024, Covestro strengthened its partnership with Ausell to boost automotive plastics recycling, turning end-of-life vehicle parts into reusable materials. This collaboration supports the shift toward a circular economy.
| Report Attributes | Details |
|---|---|
| Market Size in 2023 | USD 46.62 Billion |
| Market Size by 2032 | USD 89.53 Billion |
| CAGR | CAGR of 7.55% From 2024 to 2032 |
| Base Year | 2023 |
| Forecast Period | 2024-2032 |
| Historical Data | 2020-2022 |
| Report Scope & Coverage | Market Size, Segments Analysis, Competitive Landscape, Regional Analysis, DROC & SWOT Analysis, Forecast Outlook |
| Key Segments | • By Application (Bottles, Films/Sheets, Food Packaging, Others) • By End Use (Food & Beverage, Pharmaceuticals, Others) |
| Regional Analysis/Coverage | North America (US, Canada, Mexico), Europe (Eastern Europe [Poland, Romania, Hungary, Turkey, Rest of Eastern Europe] Western Europe] Germany, France, UK, Italy, Spain, Netherlands, Switzerland, Austria, Rest of Western Europe]), Asia Pacific (China, India, Japan, South Korea, Vietnam, Singapore, Australia, Rest of Asia Pacific), Middle East & Africa (Middle East [UAE, Egypt, Saudi Arabia, Qatar, Rest of Middle East], Africa [Nigeria, South Africa, Rest of Africa], Latin America (Brazil, Argentina, Colombia, Rest of Latin America) |
| Company Profiles | Indorama Ventures, Reliance Industries Limited, Covestro AG, M&G Chemicals, LOTTE Chemical Corporation, JBF Industries Ltd., PolyQuest, Daiwa Can Company, Shijiazhuang Sicong Technology Co. Ltd., Quadrant AG, Polisan Holding, Teijin Limited, Jiangsu Sanfangxiang, Alpek Polyester, Evergreen Plastics, Toray Industries, Jiangsu Zhongtai International, SABIC, OCTAL, MPI Polyester Industries. |
| Key Drivers | • Rising Demand for Convenient Food Packaging and E-Commerce Drives APET Adoption in Global Markets • Advancements in APET Film Extrusion and Coating Technologies Drive Market Growth and Industry Adoption |
| Restraints | • High Production Costs and Recycling Challenges Hindering Widespread Adoption of APET in Packaging Solutions |
Get in Touch
