image

AI Data Center Market Size, Share & Segmentation By Component (Hardware, Software, Services), Data Center Type (Hyperscale Data Centers, Enterprise Data Centers, Colocation Data Centers, Edge Data Centers, Modular & Portable Data Centers), Deployment (On-Premises, Cloud-Based, Hybrid), Application (AI Model Training, AI Model Inference, Big Data Analytics, Computer Vision Processing, Natural Language Processing (NLP), Autonomous Systems & Robotics, Cybersecurity & Fraud Detection), Industry Vertical (IT & Telecom, BFSI, Healthcare, Retail & E-commerce, Manufacturing, Government & Defense, Energy & Utilities, Media & Entertainment, Automotive, Others), Region | Global Forecast 2025-2032

Date: July 2025 Report Code: SNS/ICT/7714 Page 320

AI Data Center Market Report Scope & Overview:

AI Data Center Market size was valued at USD 14.25 billion in 2024 and is expected to reach USD 98.04 billion by 2032, growing at a CAGR of 27.33% from 2025-2032. 
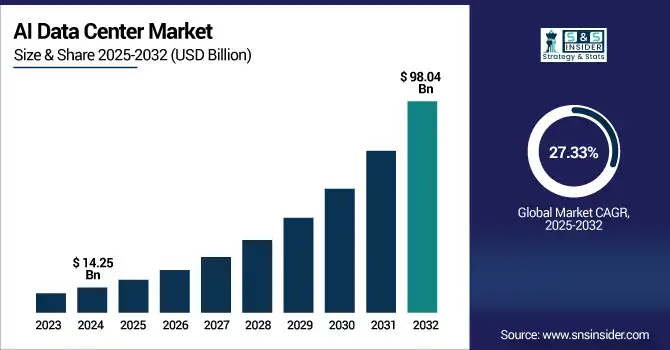
The AI Data Center Market is experiencing rapid growth due to the surging demand for high-performance computing infrastructure required to support AI workloads such as model training, inference, and data analytics. The proliferation of AI applications across industries including healthcare, automotive, finance, and cybersecurity is fueling investments in specialized data centers equipped with GPUs, TPUs, and advanced cooling technologies.

  • A U.S. Department of Energy report finds that an 8‑H100 GPU node draws approximately 74% of its rated thermal design power during AI training, equating to nearly 8 kW per node underscoring the significant energy demands of AI workloads.

  • Google’s TPU v6, launched in October 2024, delivers 4.7× more performance than its predecessor v5e, while the TPU v7 “Ironwood,” unveiled in April 2025, reaches a peak performance of 4,614 TFLOPS in clustered configurations.

Additionally, the rise of generative AI, edge AI, and large language models is driving the need for scalable, energy-efficient, and AI-optimized data center architectures.

  • Notably, data centers in the U.S. now account for about 4.4% of national electricity consumption up from 58 TWh in 2014 to 176 TWh in 2023—with projections suggesting usage could reach between 325 and 580 TWh by 2028, representing as much as 12% of U.S. power demand.

Cloud adoption and the increasing deployment of AI-as-a-Service platforms are further accelerating the expansion of AI-centric data center infrastructure.

U.S. AI Data Center Market size was valued at USD 3.35 billion in 2024 and is expected to reach USD 20.12 billion by 2032, growing at a CAGR of 25.21% from 2025-2032. 

The U.S. AI Data Center Market is growing due to rising demand for generative AI, cloud-based services, and advanced analytics. Increased investments by tech giants in AI infrastructure, government support for AI innovation, and the need for high-performance, energy-efficient computing environments are further accelerating market expansion across key industries.

Market Dynamics

Drivers

  • Surging demand for generative AI and large language models is accelerating the global deployment of high-performance AI data center infrastructure.

The rapid rise of generative AI software and LLMs such as ChatGPT and Bard has created an immediate demand for powerful AI data centers. High computational power including GPUs, TPUs and highspeed interconnections is needed for these models, which traditional data centers do not have access to. Enterprises and hyperscalers are quickly expanding infrastructure to accommodate this demand. AI data centers, from training deep neural networks to massive inference workloads, are the backbone. Their position is strengthened by growing corporate investments in AI-based automation, analytics and customer engagement solutions.

  • To support this scale, every additional 100 MW of AI data center capacity could require 19–25 million cubic feet of natural gas per day, potentially adding 4.5–6.5 billion cubic feet per day to U.S. natural gas demand by 2028.

  • Furthermore, according to the International Energy Agency (IEA), a single 100 MW data center can consume up to 2 million liters of water dail equivalent to the water usage of approximately 6,500 households.

Restraints

  • High energy consumption and carbon footprint of AI data centers pose serious environmental and operational sustainability concerns.

Large-scale AI models require an extraordinary amount of compute and cooling power to train, driving energy consumption and carbon footprints that run contrary to corporate sustainability objectives. Tougher climate regulations are forcing operators to decarbonize, and rising energy prices have the potential to make profitability even more elusive, particularly for small companies. Moving to greener data centres that use renewable energy, liquid cooling and energy-saving chips costs money. High operational energy requirements will persist to limit AI data center scalability and wider regional application, unless such solutions are widely accepted.

Opportunities

  • Adoption of liquid cooling and sustainable infrastructure opens avenues for energy-efficient, scalable, and greener AI data center ecosystems.

The shift towards sustainable infrastructure is opening up substantial innovation opportunities in AI data centers. What’s more, liquid cooling can reduce PUE. Complemented by on-site renewables and smart energy optimisation, these centres can work towards carbon-neutral goals. This pivot draws in green financing, government support and ESG-focused partnerships. Suppliers of modular, environmentally friendly deployments are making strong headway around the world, particularly in areas with rigorous climate rules and high energy prices. Sustainability is increasingly an important point of differentiation in the market.

  • Huawei reports its full liquid-cooled cabinets reduce cooling power consumption by 96%, lowering PUE from 2.2 to 1.1 and saving approximately 500,000 kWh/year per 50 kW rack equivalent to around 237 tons of CO₂ emissions avoided.

  • Similarly, Mitsubishi Heavy Industries, KDDI & NEC achieved a 94% reduction in server cooling energy using immersion liquid cooling, attaining a PUE of 1.05 in a Tier‑4 demonstration data center.

  • In addition, a joint analysis by Vertiv and NVIDIA shows that implementing approximately 75% direct-to-chip liquid cooling can reduce total data center power consumption by 10.2%, improve Total Usage Effectiveness (TUE) by 15.5%, and cut server fan energy use by up to 80%.

Challenges

  • Managing heat dissipation and thermal efficiency for AI-intensive workloads is a technical bottleneck in data center operations.

AI model training generates higher levels of heat than traditional IT workloads, putting overwhelming stress on traditional cooling solutions. Traditional air-cooling is often unable to meet the cooling requirement of server with high density GPU and ASIC, which can negatively affect the server performance, reduce the service time and increase the power consumption. More-advanced cooling methods such as liquid immersion and direct-to-chip cooling provide relief but require significant upfront investment and retrofit of infrastructure. There is a continuing need to scale these remedies in a cost-effective manner across various geographies and types of facilities. Without the standardization, how to manage the thermal load of AI data centers will be a significant challenge for the scalability and reliability of AI data centers.

Segment Analysis

By Component

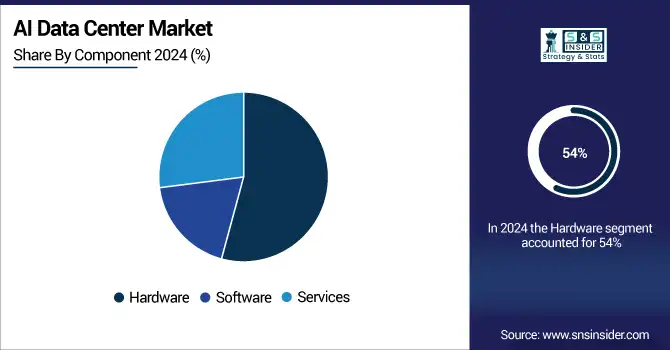
Hardware segment dominated the AI Data Center Market with the highest revenue share of about 54% in 2024 due to the substantial demand for specialized AI chips, including GPUs, TPUs, and FPGAs, essential for training and inference workloads. The rapid scaling of AI workloads necessitates high-performance computing infrastructure, driving heavy investments in hardware. Additionally, growing deployment of energy-efficient servers and advanced cooling systems further boosts hardware adoption across global AI data centers.

Services segment is expected to grow at the fastest CAGR of about 28.64% from 2025-2032 due to increasing reliance on managed, integration, and optimization services to support complex AI deployments. As organizations face growing complexity in handling AI workloads, they increasingly turn to external service providers for seamless implementation, performance tuning, and continuous infrastructure support. The need for scalability, reliability, and faster deployment cycles accelerates the demand for specialized AI data center services.
By Data Center Type

Hyperscale Data Centers segment dominated the AI Data Center Market with the highest revenue share of about 35% in 2024 due to their unmatched capacity to handle large-scale AI model training and storage requirements. These facilities, backed by tech giants, offer optimized infrastructure, integrated AI accelerators, and high-throughput networking. Their ability to support diverse AI workloads at scale while ensuring energy efficiency and centralized orchestration makes them foundational to current enterprise and cloud AI strategies.

Edge Data Centers segment is expected to grow at the fastest CAGR of about 29.04% from 2025-2032 due to the increasing demand for real-time AI processing near data sources. Applications such as autonomous vehicles, remote healthcare, smart factories, and video analytics require low-latency computing. Edge data centers enable AI inference closer to end users, improving responsiveness while reducing bandwidth costs. The 5G rollout and IoT expansion further accelerate this decentralization trend in AI infrastructure.

By AI Application

AI Model Training segment dominated the AI Data Center Market with the highest revenue share of about 29% in 2024 owing to the growing need to build large, complex models like GPT, DALL·E, and Gemini. Training requires vast computational resources and prolonged runtimes, resulting in significantly higher infrastructure and power costs. Organizations are investing heavily in GPU clusters and distributed systems to handle model complexity, making training the costliest and most resource-intensive workload in AI.

AI Model Inference segment is expected to grow at the fastest CAGR of about 29.39% from 2025-2032 due to the massive deployment of AI-powered applications across industries. As trained models are deployed for customer service, fraud detection, recommendation engines, and image recognition, the need for fast, scalable inference surges. With more enterprises shifting AI models into production environments, optimizing low-latency and cost-effective inference workloads drives rapid growth in this segment.

By Industry Vertical

BFSI segment dominated the AI Data Center Market with the highest revenue share of about 29% in 2024 due to widespread adoption of AI for fraud detection, algorithmic trading, credit scoring, and risk analytics. The financial sector's emphasis on security, real-time data processing, and compliance creates a consistent demand for high-performance AI infrastructure. Continued investments in AI-driven digital transformation by banks and insurers strengthen BFSI's leadership in AI data center utilization.

IT & Telecom segment is expected to grow at the fastest CAGR of about 29.37% from 2025-2032 as the industry accelerates AI-driven automation, network optimization, and customer personalization. AI is integral to managing 5G networks, predictive maintenance, and intelligent customer support systems. The need for agile, scalable data center infrastructure to support these AI applications across distributed environments drives strong investment in AI capabilities among IT and telecom service providers.

By Deployment

Cloud-Based segment dominated the AI Data Center Market with the highest revenue share of about 62% in 2024 due to the increasing preference for flexible, scalable AI computing platforms offered by major cloud providers. Enterprises rely on cloud-based AI services to avoid heavy upfront hardware investments and quickly deploy models. The availability of advanced AI chips, toolkits, and data management in the cloud ecosystem fuels its dominance across AI-driven digital initiatives.

Hybrid segment is expected to grow at the fastest CAGR of about 29.31% from 2025-2032 as organizations seek to balance cloud scalability with on-premise control and data sovereignty. Hybrid architectures allow enterprises to run sensitive AI workloads locally while leveraging public cloud for large-scale training. The model supports regulatory compliance, cost optimization, and performance flexibility. Increasing demand for customizable and secure AI deployments accelerates hybrid adoption in diverse industry verticals.

Regional Analysis

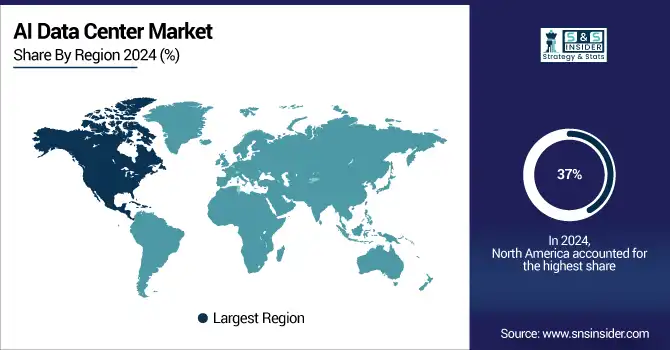
North America dominated the AI Data Center Market with the highest revenue share of about 37% in 2024 due to early adoption of AI technologies, strong presence of hyperscalers like Google, Microsoft, and Amazon, and robust investment in AI infrastructure. The region also benefits from a mature cloud ecosystem, high AI talent concentration, and aggressive innovation in generative AI, driving significant demand for advanced, high-performance AI data center deployments.

The U.S. is dominating the AI Data Center Market due to massive investments, presence of major cloud providers, and advanced AI infrastructure deployment.

Asia Pacific is expected to grow at the fastest CAGR of about 29.04% from 2025–2032 due to rapid digital transformation, government AI initiatives, and booming demand from sectors like e-commerce, fintech, and manufacturing. Countries like China, India, and South Korea are heavily investing in AI research, cloud infrastructure, and edge data centers. Rising data consumption, urbanization, and local tech ecosystem expansion accelerate regional adoption of AI-driven data center infrastructure.

China is dominating the AI Data Center Market in Asia Pacific due to large-scale AI adoption, government support, and massive investments in hyperscale infrastructure.

Europe is witnessing steady growth in the AI Data Center Market, driven by digital transformation, data localization laws, and rising AI adoption across industries. Countries like Germany, France, and the UK are investing heavily in sustainable, energy-efficient AI infrastructure.

Germany is dominating the AI Data Center Market in Europe due to its strong industrial base, AI investments, and advanced data infrastructure capabilities.

Middle East & Africa and Latin America are emerging markets in the AI Data Center sector, fueled by growing cloud adoption, digitalization initiatives, and investments in smart city projects, with governments and enterprises increasingly deploying AI-driven infrastructure to boost efficiency.
Key Players

AI Data Center Market companies are Advanced Micro Devices, Inc., Amazon Web Services, Inc., Arista Networks, Inc., Cisco Systems, Inc., Dell Technologies, Google LLC, Hewlett Packard Enterprise Development LP, Hitachi Vantara LLC, Intel Corporation, International Business Machines Corporation, Juniper Networks, Inc., Microsoft Corporation, NetApp, Nutanix, NVIDIA Corporation.

Recent Developments:

  • August 2024, AMD acquired ZT Systems for $4.9 billion, strengthening its capabilities in delivering full-rack AI data center systems optimized for hyperscalers and large-scale AI workloads.

  • March 2025, Arista launched EOS Smart AI Suite with cluster load balancing; by July, it acquired VeloCloud to enhance enterprise AI networking and optimize data center fabric intelligence.

  • June 2025, Cisco launched N9300 AI-smart switches, a Secure AI Factory with NVIDIA, and full-stack Nexus Dashboard solutions tailored for next-gen AI-ready data center architectures.

AI Data Center Market Report Scope:

Report Attributes Details
Market Size in 2024 USD 14.25 Billion 
Market Size by 2032 USD 98.04 Billion 
CAGR CAGR of 27.33% From 2025 to 2032
Base Year 2024
Forecast Period 2025-2032
Historical Data 2021-2023
Report Scope & Coverage Market Size, Segments Analysis, Competitive Landscape, Regional Analysis, DROC & SWOT Analysis, Forecast Outlook
Key Segments • By Component (Hardware, Software, Services)
• By Data Center Type (Hyperscale Data Centers, Enterprise Data Centers, Colocation Data Centers, Edge Data Centers, Modular & Portable Data Centers)
• By AI Application (AI Model Training, AI Model Inference, Big Data Analytics, Computer Vision Processing, Natural Language Processing (NLP), Autonomous Systems & Robotics, Cybersecurity & Fraud Detection)
• By Industry Vertical (IT & Telecom, BFSI, Healthcare, Retail & E-commerce, Manufacturing, Government & Defense, Energy & Utilities, Media & Entertainment, Automotive, Others)
• By Deployment (On-Premises, Cloud-Based, Hybrid)
Regional Analysis/Coverage North America (US, Canada, Mexico), Europe (Germany, France, UK, Italy, Spain, Poland, Turkey, Rest of Europe), Asia Pacific (China, India, Japan, South Korea, Singapore, Australia, Rest of Asia Pacific), Middle East & Africa (UAE, Saudi Arabia, Qatar, South Africa, Rest of Middle East & Africa), Latin America (Brazil, Argentina, Rest of Latin America)
Company Profiles Advanced Micro Devices, Inc., Amazon Web Services, Inc., Arista Networks, Inc., Cisco Systems, Inc., Dell Technologies, Google LLC, Hewlett Packard Enterprise Development LP, Hitachi Vantara LLC, Intel Corporation, International Business Machines Corporation, Juniper Networks, Inc., Microsoft Corporation, NetApp, Nutanix, NVIDIA Corporation

Frequently Asked Questions

Ans: The AI Data Center Market is expected to grow at a CAGR of 27.33% from 2025 to 2032, driven by AI workload expansion and infrastructure scaling.

Ans: The AI Data Center Market was valued at USD 14.25 billion in 2024, with substantial growth fueled by demand for AI-optimized computing infrastructure.

Ans: The market is primarily driven by the surging demand for generative AI, LLMs, and high-performance computing infrastructure across various industries.

Ans: The Hardware segment dominated the market in 2024 with a 54% share, due to the demand for GPUs, TPUs, and energy-efficient servers.

Ans: North America led the market with a 37% revenue share in 2024, due to early AI adoption and hyperscaler investment in infrastructure.

Table of Contents:

1. Introduction

1.1 Market Definition

1.2 Scope (Inclusion and Exclusions)

1.3 Research Assumptions

2. Executive Summary

2.1 Market Overview

2.2 Regional Synopsis

2.3 Competitive Summary

3. Research Methodology

3.1 Top-Down Approach

3.2 Bottom-up Approach

3.3. Data Validation

3.4 Primary Interviews

4. Market Dynamics Impact Analysis

4.1 Market Driving Factors Analysis

4.1.1 Drivers

4.1.2 Restraints

4.2 PESTLE Analysis

4.3 Porter’s Five Forces Model

5. Statistical Insights and Trends Reporting

5.1 Power Consumption Metrics

5.2 AI Workload Distribution

5.3 Cooling Technology Stats

5.4 Server Density & Rack Utilization

5.5 Latency & Network Throughput Stats

6. Competitive Landscape

6.1 List of Major Companies, By Region

6.2 Market Share Analysis, By Region

6.3 Product Benchmarking

6.3.1 Product specifications and features

6.3.2 Pricing

6.4 Strategic Initiatives

6.4.1 Marketing and promotional activities

6.4.2 Distribution and supply chain strategies

6.4.3 Expansion plans and new product launches

6.4.4 Strategic partnerships and collaborations

6.5 Technological Advancements

6.6 Market Positioning and Branding

7. AI Data Center Market Segmentation, By Component

7.1 Chapter Overview

7.2 Software

7.2.1 Software Market Trends Analysis (2020-2032)

7.2.2 Software Market Size Estimates and Forecasts to 2032 (USD Billion)

7.3 Services

7.3.1 Services Market Trends Analysis (2020-2032)

7.3.2 Services Market Size Estimates and Forecasts to 2032 (USD Billion)

7.3 Hardware

7.3.1 Hardware Market Trends Analysis (2020-2032)

7.3.2 Hardware Market Size Estimates and Forecasts to 2032 (USD Billion)

8. AI Data Center Market Segmentation, By Industry Vertical

8.1 Chapter Overview

8.2 BFSI

8.2.1 BFSI Market Trends Analysis (2020-2032)

8.2.2 BFSI Market Size Estimates And Forecasts To 2032 (USD Billion)

8.3 Healthcare

8.3.1 Healthcare Market Trends Analysis (2020-2032)

8.3.2 Healthcare Market Size Estimates And Forecasts To 2032 (USD Billion)

8.4 Retail & E-commerce

8.4.1 Retail & E-commerce Market Trends Analysis (2020-2032)

8.4.2 Retail & E-commerce Market Size Estimates And Forecasts To 2032 (USD Billion)

8.5 IT & Telecom

8.5.1 IT & Telecom Market Trends Analysis (2020-2032)

8.5.2 IT & Telecom Market Size Estimates And Forecasts To 2032 (USD Billion)

8.6 Government & Defense

8.6.1 Government & Defense Market Trends Analysis (2020-2032)

8.6.2 Government & Defense Market Size Estimates And Forecasts To 2032 (USD Billion)

8.7 Manufacturing

8.7.1 Manufacturing Market Trends Analysis (2020-2032)

8.7.2 Manufacturing Market Size Estimates And Forecasts To 2032 (USD Billion)

8.8 Media & Entertainment

8.8.1 Media & Entertainment Market Trends Analysis (2020-2032)

8.8.2 Media & Entertainment Market Size Estimates And Forecasts To 2032 (USD Billion)

8.9 Energy & Utilities

8.9.1 Energy & Utilities Market Trends Analysis (2020-2032)

8.9.2 Energy & Utilities Market Size Estimates And Forecasts To 2032 (USD Billion)

8.10 Automotive

8.10.1 Automotive Market Trends Analysis (2020-2032)

8.10.2 Automotive Market Size Estimates And Forecasts To 2032 (USD Billion)

8.11 Others

8.11.1 Others Market Trends Analysis (2020-2032)

8.11.2 Others Market Size Estimates And Forecasts To 2032 (USD Billion)

9. AI Data Center Market Segmentation, By Data Center Type

9.1 Chapter Overview

9.2 Hyperscale Data Centers

9.2.1 Hyperscale Data Centers Market Trends Analysis (2020-2032)

9.2.2 Hyperscale Data Centers Market Size Estimates And Forecasts To 2032 (USD Billion)

9.3 Enterprise Data Centers

9.3.1 Enterprise Data Centers Market Trends Analysis (2020-2032)

9.3.2 Enterprise Data Centers Market Size Estimates And Forecasts To 2032 (USD Billion)

9.4 Colocation Data Centers

9.4.1 Colocation Data Centers Market Trends Analysis (2020-2032)

9.4.2 Colocation Data Centers Market Size Estimates And Forecasts To 2032 (USD Billion)

9.5 Edge Data Centers

9.5.1 Edge Data Centers Market Trends Analysis (2020-2032)

9.5.2 Edge Data Centers Market Size Estimates And Forecasts To 2032 (USD Billion)

9.6 Modular & Portable Data Centers

9.6.1 Modular & Portable Data Centers Market Trends Analysis (2020-2032)

9.6.2 Modular & Portable Data Centers Market Size Estimates And Forecasts To 2032 (USD Billion)

10. AI Data Center Market Segmentation, By Deployment Mode

10.1 Chapter Overview

10.2 Cloud

10.2.1 Cloud Market Trends Analysis (2020-2032)

10.2.2 Cloud Market Size Estimates And Forecasts To 2032 (USD Billion)

10.3 On-premises

10.3.1 On-premises Market Trends Analysis (2020-2032)

10.3.2 On-premises Market Size Estimates And Forecasts To 2032 (USD Billion)

10.4 Hybrid

10.4.1 Hybrid Market Trends Analysis (2020-2032)

10.4.2 Hybrid Market Size Estimates And Forecasts To 2032 (USD Billion)

11. AI Data Center Market Segmentation, By Application

11.1 Chapter Overview

11.2 AI Model Training

11.2.1 AI Model Training Market Trends Analysis (2020-2032)

11.2.2 AI Model Training Market Size Estimates And Forecasts To 2032 (USD Billion)

11.3 AI Model Inference

11.3.1 AI Model Inference Market Trends Analysis (2020-2032)

11.3.2 AI Model Inference Market Size Estimates And Forecasts To 2032 (USD Billion)

11.4 Big Data Analytics

11.4.1 Big Data Analytics Market Trends Analysis (2020-2032)

11.4.2 Big Data Analytics Market Size Estimates And Forecasts To 2032 (USD Billion)

11.5 Computer Vision Processing

11.5.1 Computer Vision Processing Market Trends Analysis (2020-2032)

11.5.2 Computer Vision Processing Market Size Estimates And Forecasts To 2032 (USD Billion)

11.6 Natural Language Processing (NLP)

11.6.1 Natural Language Processing (NLP) Market Trends Analysis (2020-2032)

11.6.2 Natural Language Processing (NLP) Market Size Estimates And Forecasts To 2032 (USD Billion)

11.7 Autonomous Systems & Robotics

11.7.1 Autonomous Systems & Robotics Market Trends Analysis (2020-2032)

11.7.2 Autonomous Systems & Robotics Market Size Estimates And Forecasts To 2032 (USD Billion)

11.8 Cybersecurity & Fraud Detection

11.8.1 Cybersecurity & Fraud Detection Market Trends Analysis (2020-2032)

11.8.2 Cybersecurity & Fraud Detection Market Size Estimates And Forecasts To 2032 (USD Billion)

12. Regional Analysis

12.1 Chapter Overview

12.2 North America

12.2.1 Trends Analysis

12.2.2 North America AI Data Center Market Estimates And Forecasts, By Country (2020-2032) (USD Billion)

12.2.3 North America AI Data Center Market Estimates And Forecasts, By Component (2020-2032) (USD Billion)

12.2.4 North America AI Data Center Market Estimates And Forecasts, By Industry Vertical (2020-2032) (USD Billion)

12.2.5 North America AI Data Center Market Estimates And Forecasts, By Data Center Type (2020-2032) (USD Billion)

12.2.6 North America AI Data Center Market Estimates And Forecasts, By Deployment Mode (2020-2032) (USD Billion)

12.2.7 North America AI Data Center Market Estimates And Forecasts, By Application (2020-2032) (USD Billion)

12.2.8 USA

12.2.8.1 USA AI Data Center Market Estimates And Forecasts, By Component (2020-2032) (USD Billion)

12.2.8.2 USA AI Data Center Market Estimates And Forecasts, By Industry Vertical (2020-2032) (USD Billion)

12.2.8.3 USA AI Data Center Market Estimates And Forecasts, By Data Center Type (2020-2032) (USD Billion)

12.2.8.4 USA AI Data Center Market Estimates And Forecasts, By Deployment Mode (2020-2032) (USD Billion)

12.2.8.5 USA AI Data Center Market Estimates And Forecasts, By Application (2020-2032) (USD Billion)

12.2.9 Canada

12.2.9.1 Canada AI Data Center Market Estimates And Forecasts, By Component (2020-2032) (USD Billion)

12.2.9.2 Canada AI Data Center Market Estimates And Forecasts, By Industry Vertical (2020-2032) (USD Billion)

12.2.9.3 Canada AI Data Center Market Estimates And Forecasts, By Data Center Type (2020-2032) (USD Billion)

12.2.9.4 Canada AI Data Center Market Estimates And Forecasts, By Deployment Mode (2020-2032) (USD Billion)

12.2.9.5 Canada AI Data Center Market Estimates And Forecasts, By Application (2020-2032) (USD Billion)

12.2.10 Mexico

12.2.10.1 Mexico AI Data Center Market Estimates And Forecasts, By Component (2020-2032) (USD Billion)

12.2.10.2 Mexico AI Data Center Market Estimates And Forecasts, By Industry Vertical (2020-2032) (USD Billion)

12.2.10.3 Mexico AI Data Center Market Estimates And Forecasts, By Data Center Type (2020-2032) (USD Billion)

12.2.10.4 Mexico AI Data Center Market Estimates And Forecasts, By Deployment Mode (2020-2032) (USD Billion)

12.2.10.5 Mexico AI Data Center Market Estimates And Forecasts, By Application (2020-2032) (USD Billion)

12.3 Europe

12.3.1 Trends Analysis

12.3.2 Eastern Europe AI Data Center Market Estimates And Forecasts, By Country (2020-2032) (USD Billion)

12.3.3 Eastern Europe AI Data Center Market Estimates And Forecasts, By Component (2020-2032) (USD Billion)

12.3.4 Eastern Europe AI Data Center Market Estimates And Forecasts, By Industry Vertical (2020-2032) (USD Billion)

12.3.5 Eastern Europe AI Data Center Market Estimates And Forecasts, By Data Center Type (2020-2032) (USD Billion)

12.3.6 Eastern Europe AI Data Center Market Estimates And Forecasts, By Deployment Mode (2020-2032) (USD Billion)

12.3.7 Eastern Europe AI Data Center Market Estimates And Forecasts, By Application (2020-2032) (USD Billion)

12.3.8 Poland

12.3.8.1 Poland AI Data Center Market Estimates And Forecasts, By Component (2020-2032) (USD Billion)

12.3.8.2 Poland AI Data Center Market Estimates And Forecasts, By Industry Vertical (2020-2032) (USD Billion)

12.3.8.3 Poland AI Data Center Market Estimates And Forecasts, By Data Center Type (2020-2032) (USD Billion)

12.3.8.4 Poland AI Data Center Market Estimates And Forecasts, By Deployment Mode (2020-2032) (USD Billion)

12.3.8.5 Poland AI Data Center Market Estimates And Forecasts, By Application (2020-2032) (USD Billion)

12.3.9 Turkey

12.3.9.1 Turkey AI Data Center Market Estimates And Forecasts, By Component (2020-2032) (USD Billion)

12.3.9.2 Turkey AI Data Center Market Estimates And Forecasts, By Industry Vertical (2020-2032) (USD Billion)

12.3.9.3 Turkey AI Data Center Market Estimates And Forecasts, By Data Center Type (2020-2032) (USD Billion)

12.3.9.4 Turkey AI Data Center Market Estimates And Forecasts, By Deployment Mode (2020-2032) (USD Billion)

12.3.9.5 Turkey AI Data Center Market Estimates And Forecasts, By Application (2020-2032) (USD Billion)

12.3.10 Germany

12.3.10.1 Germany AI Data Center Market Estimates And Forecasts, By Component (2020-2032) (USD Billion)

12.3.10.2 Germany AI Data Center Market Estimates And Forecasts, By Industry Vertical (2020-2032) (USD Billion)

12.3.10.3 Germany AI Data Center Market Estimates And Forecasts, By Data Center Type (2020-2032) (USD Billion)

12.3.10.4 Germany AI Data Center Market Estimates And Forecasts, By Deployment Mode (2020-2032) (USD Billion)

12.3.10.5 Germany AI Data Center Market Estimates And Forecasts, By Application (2020-2032) (USD Billion)

12.3.11 France

12.3.11.1 France AI Data Center Market Estimates And Forecasts, By Component (2020-2032) (USD Billion)

12.3.11.2 France AI Data Center Market Estimates And Forecasts, By Industry Vertical (2020-2032) (USD Billion)

12.3.11.3 France AI Data Center Market Estimates And Forecasts, By Data Center Type (2020-2032) (USD Billion)

12.3.11.4 France AI Data Center Market Estimates And Forecasts, By Deployment Mode (2020-2032) (USD Billion)

12.3.11.5 France AI Data Center Market Estimates And Forecasts, By Application (2020-2032) (USD Billion)

12.3.12 UK

12.3.12.1 UK AI Data Center Market Estimates And Forecasts, By Component (2020-2032) (USD Billion)

12.3.12.2 UK AI Data Center Market Estimates And Forecasts, By Industry Vertical (2020-2032) (USD Billion)

12.3.12.3 UK AI Data Center Market Estimates And Forecasts, By Data Center Type (2020-2032) (USD Billion)

12.3.12.4 UK AI Data Center Market Estimates And Forecasts, By Deployment Mode (2020-2032) (USD Billion)

12.3.12.5 UK AI Data Center Market Estimates And Forecasts, By Application (2020-2032) (USD Billion)

12.3.13 Italy

12.3.13.1 Italy AI Data Center Market Estimates And Forecasts, By Component (2020-2032) (USD Billion)

12.3.13.2 Italy AI Data Center Market Estimates And Forecasts, By Industry Vertical (2020-2032) (USD Billion)

12.3.13.3 Italy AI Data Center Market Estimates And Forecasts, By Data Center Type (2020-2032) (USD Billion)

12.3.13.4 Italy AI Data Center Market Estimates And Forecasts, By Deployment Mode (2020-2032) (USD Billion)

12.3.13.5 Italy AI Data Center Market Estimates And Forecasts, By Application (2020-2032) (USD Billion)

12.3.14 Spain

12.3.14.1 Spain AI Data Center Market Estimates And Forecasts, By Component (2020-2032) (USD Billion)

12.3.14.2 Spain AI Data Center Market Estimates And Forecasts, By Industry Vertical (2020-2032) (USD Billion)

12.3.14.3 Spain AI Data Center Market Estimates And Forecasts, By Data Center Type (2020-2032) (USD Billion)

12.3.14.4 Spain AI Data Center Market Estimates And Forecasts, By Deployment Mode (2020-2032) (USD Billion)

12.3.14.5 Spain AI Data Center Market Estimates And Forecasts, By Application (2020-2032) (USD Billion)

12.3.15 Rest Of Europe

12.3.15.1 Rest Of Western Europe AI Data Center Market Estimates And Forecasts, By Component (2020-2032) (USD Billion)

12.3.15.2 Rest Of Western Europe AI Data Center Market Estimates And Forecasts, By Industry Vertical (2020-2032) (USD Billion)

12.3.15.3 Rest Of Western Europe AI Data Center Market Estimates And Forecasts, By Data Center Type (2020-2032) (USD Billion)

12.3.15.4 Rest Of Western Europe AI Data Center Market Estimates And Forecasts, By Deployment Mode (2020-2032) (USD Billion)

12.3.15.5 Rest Of Western Europe AI Data Center Market Estimates And Forecasts, By Application (2020-2032) (USD Billion)

12.4 Asia Pacific

12.4.1 Trends Analysis

12.4.2 Asia Pacific AI Data Center Market Estimates And Forecasts, By Country (2020-2032) (USD Billion)

12.4.3 Asia Pacific AI Data Center Market Estimates And Forecasts, By Component (2020-2032) (USD Billion)

12.4.4 Asia Pacific AI Data Center Market Estimates And Forecasts, By Industry Vertical (2020-2032) (USD Billion)

12.4.5 Asia Pacific AI Data Center Market Estimates And Forecasts, By Data Center Type (2020-2032) (USD Billion)

12.4.6 Asia Pacific AI Data Center Market Estimates And Forecasts, By Deployment Mode (2020-2032) (USD Billion)

12.4.7 Asia Pacific AI Data Center Market Estimates And Forecasts, By Application (2020-2032) (USD Billion)

12.4.8 China

12.4.8.1 China AI Data Center Market Estimates And Forecasts, By Component (2020-2032) (USD Billion)

12.4.8.2 China AI Data Center Market Estimates And Forecasts, By Industry Vertical (2020-2032) (USD Billion)

12.4.8.3 China AI Data Center Market Estimates And Forecasts, By Data Center Type (2020-2032) (USD Billion)

12.4.8.4 China AI Data Center Market Estimates And Forecasts, By Deployment Mode (2020-2032) (USD Billion)

12.4.8.5 China AI Data Center Market Estimates And Forecasts, By Application (2020-2032) (USD Billion)

12.4.9 India

12.4.9.1 India AI Data Center Market Estimates And Forecasts, By Component (2020-2032) (USD Billion)

12.4.9.2 India AI Data Center Market Estimates And Forecasts, By Industry Vertical (2020-2032) (USD Billion)

12.4.9.3 India AI Data Center Market Estimates And Forecasts, By Data Center Type (2020-2032) (USD Billion)

12.4.9.4 India AI Data Center Market Estimates And Forecasts, By Deployment Mode (2020-2032) (USD Billion)

12.4.9.5 India AI Data Center Market Estimates And Forecasts, By Application (2020-2032) (USD Billion)

12.4.10 Japan

12.4.10.1 Japan AI Data Center Market Estimates And Forecasts, By Component (2020-2032) (USD Billion)

12.4.10.2 Japan AI Data Center Market Estimates And Forecasts, By Industry Vertical (2020-2032) (USD Billion)

12.4.10.3 Japan AI Data Center Market Estimates And Forecasts, By Data Center Type (2020-2032) (USD Billion)

12.4.10.4 Japan AI Data Center Market Estimates And Forecasts, By Deployment Mode (2020-2032) (USD Billion)

12.4.10.5 Japan AI Data Center Market Estimates And Forecasts, By Application (2020-2032) (USD Billion)

12.4.11 South Korea

12.4.11.1 South Korea AI Data Center Market Estimates And Forecasts, By Component (2020-2032) (USD Billion)

12.4.11.2 South Korea AI Data Center Market Estimates And Forecasts, By Industry Vertical (2020-2032) (USD Billion)

12.4.11.3 South Korea AI Data Center Market Estimates And Forecasts, By Data Center Type (2020-2032) (USD Billion)

12.4.11.4 South Korea AI Data Center Market Estimates And Forecasts, By Deployment Mode (2020-2032) (USD Billion)

12.4.11.5 South Korea AI Data Center Market Estimates And Forecasts, By Application (2020-2032) (USD Billion)

12.4.12 Singapore

12.4.12.1 Singapore AI Data Center Market Estimates And Forecasts, By Component (2020-2032) (USD Billion)

12.4.12.2 Singapore AI Data Center Market Estimates And Forecasts, By Industry Vertical (2020-2032) (USD Billion)

12.4.12.3 Singapore AI Data Center Market Estimates And Forecasts, By Data Center Type (2020-2032) (USD Billion)

12.4.12.4 Singapore AI Data Center Market Estimates And Forecasts, By Deployment Mode (2020-2032) (USD Billion)

12.4.12.5 Singapore AI Data Center Market Estimates And Forecasts, By Application (2020-2032) (USD Billion)

12.4.13 Australia

12.4.13.1 Australia AI Data Center Market Estimates And Forecasts, By Component (2020-2032) (USD Billion)

12.4.13.2 Australia AI Data Center Market Estimates And Forecasts, By Industry Vertical (2020-2032) (USD Billion)

12.4.13.3 Australia AI Data Center Market Estimates And Forecasts, By Data Center Type (2020-2032) (USD Billion)

12.4.13.4 Australia AI Data Center Market Estimates And Forecasts, By Deployment Mode (2020-2032) (USD Billion)

12.4.13.5 Australia AI Data Center Market Estimates And Forecasts, By Application (2020-2032) (USD Billion)

12.4.14 Rest Of Asia Pacific

12.4.14.1 Rest Of Asia Pacific AI Data Center Market Estimates And Forecasts, By Component (2020-2032) (USD Billion)

12.4.14.2 Rest Of Asia Pacific AI Data Center Market Estimates And Forecasts, By Industry Vertical (2020-2032) (USD Billion)

12.4.14.3 Rest Of Asia Pacific AI Data Center Market Estimates And Forecasts, By Data Center Type (2020-2032) (USD Billion)

12.4.14.4 Rest Of Asia Pacific AI Data Center Market Estimates And Forecasts, By Deployment Mode (2020-2032) (USD Billion)

12.4.14.5 Rest Of Asia Pacific AI Data Center Market Estimates And Forecasts, By Application (2020-2032) (USD Billion)

12.5 Middle East And Africa

12.5.1 Trends Analysis

12.5.2 Middle East And Africa AI Data Center Market Estimates And Forecasts, By Country (2020-2032) (USD Billion)

12.5.3 Middle East And Africa AI Data Center Market Estimates And Forecasts, By Component (2020-2032) (USD Billion)

12.5.4 Middle East And Africa  AI Data Center Market Estimates And Forecasts, By Industry Vertical (2020-2032) (USD Billion)

12.5.5 Middle East And Africa AI Data Center Market Estimates And Forecasts, By Data Center Type (2020-2032) (USD Billion)

12.5.6 Middle East And Africa AI Data Center Market Estimates And Forecasts, By Deployment Mode (2020-2032) (USD Billion)

12.5.7 Middle East And Africa AI Data Center Market Estimates And Forecasts, By Application (2020-2032) (USD Billion)

12.5.8 UAE

12.5.8.1 UAE AI Data Center Market Estimates And Forecasts, By Component (2020-2032) (USD Billion)

12.5.8.2 UAE AI Data Center Market Estimates And Forecasts, By Industry Vertical (2020-2032) (USD Billion)

12.5.8.3 UAE AI Data Center Market Estimates And Forecasts, By Data Center Type (2020-2032) (USD Billion)

12.5.8.4 UAE AI Data Center Market Estimates And Forecasts, By Deployment Mode (2020-2032) (USD Billion)

12.5.8.5 UAE AI Data Center Market Estimates And Forecasts, By Application (2020-2032) (USD Billion)

12.5.9 Saudi Arabia

12.5.9.1 Saudi Arabia AI Data Center Market Estimates And Forecasts, By Component (2020-2032) (USD Billion)

12.5.9.2 Saudi Arabia AI Data Center Market Estimates And Forecasts, By Industry Vertical (2020-2032) (USD Billion)

12.5.9.3 Saudi Arabia AI Data Center Market Estimates And Forecasts, By Data Center Type (2020-2032) (USD Billion)

12.5.9.4 Saudi Arabia AI Data Center Market Estimates And Forecasts, By Deployment Mode (2020-2032) (USD Billion)

12.5.9.5 Saudi Arabia AI Data Center Market Estimates And Forecasts, By Application (2020-2032) (USD Billion)

12.5.10 Qatar

12.5.10.1 Qatar AI Data Center Market Estimates And Forecasts, By Component (2020-2032) (USD Billion)

12.5.10.2 Qatar AI Data Center Market Estimates And Forecasts, By Industry Vertical (2020-2032) (USD Billion)

12.5.10.3 Qatar AI Data Center Market Estimates And Forecasts, By Data Center Type (2020-2032) (USD Billion)

12.5.10.4 Qatar AI Data Center Market Estimates And Forecasts, By Deployment Mode (2020-2032) (USD Billion)

12.5.10.5 Qatar AI Data Center Market Estimates And Forecasts, By Application (2020-2032) (USD Billion)

12.5.11 South Africa

12.5.11.1 South Africa AI Data Center Market Estimates And Forecasts, By Component (2020-2032) (USD Billion)

12.5.11.2 South Africa AI Data Center Market Estimates And Forecasts, By Industry Vertical (2020-2032) (USD Billion)

12.5.11.3 South Africa AI Data Center Market Estimates And Forecasts, By Data Center Type (2020-2032) (USD Billion)

12.5.11.4 South Africa AI Data Center Market Estimates And Forecasts, By Deployment Mode (2020-2032) (USD Billion)

12.5.11.5 South Africa AI Data Center Market Estimates And Forecasts, By Application (2020-2032) (USD Billion)

12.5.12 Rest Of Africa

12.5.12.1 Rest Of Africa AI Data Center Market Estimates And Forecasts, By Component (2020-2032) (USD Billion)

12.5.12.2 Rest Of Africa AI Data Center Market Estimates And Forecasts, By Industry Vertical (2020-2032) (USD Billion)

12.5.12.3 Rest Of Africa AI Data Center Market Estimates And Forecasts, By Data Center Type (2020-2032) (USD Billion)

12.5.12.4 Rest Of Africa AI Data Center Market Estimates And Forecasts, By Deployment Mode (2020-2032) (USD Billion)

12.5.12.5 Rest Of Africa AI Data Center Market Estimates And Forecasts, By Application (2020-2032) (USD Billion)

12.6 Latin America

12.6.1 Trends Analysis

12.6.2 Latin America AI Data Center Market Estimates And Forecasts, By Country (2020-2032) (USD Billion)

12.6.3 Latin America AI Data Center Market Estimates And Forecasts, By Component (2020-2032) (USD Billion)

12.6.4 Latin America AI Data Center Market Estimates And Forecasts, By Industry Vertical (2020-2032) (USD Billion)

12.6.5 Latin America AI Data Center Market Estimates And Forecasts, By Data Center Type (2020-2032) (USD Billion)

12.6.6 Latin America AI Data Center Market Estimates And Forecasts, By Deployment Mode (2020-2032) (USD Billion)

12.6.7 Latin America AI Data Center Market Estimates And Forecasts, By Application (2020-2032) (USD Billion)

12.6.8 Brazil

12.6.8.1 Brazil AI Data Center Market Estimates And Forecasts, By Component (2020-2032) (USD Billion)

12.6.8.2 Brazil AI Data Center Market Estimates And Forecasts, By Industry Vertical (2020-2032) (USD Billion)

12.6.8.3 Brazil AI Data Center Market Estimates And Forecasts, By Data Center Type (2020-2032) (USD Billion)

12.6.8.4 Brazil AI Data Center Market Estimates And Forecasts, By Deployment Mode (2020-2032) (USD Billion)

12.6.8.5 Brazil AI Data Center Market Estimates And Forecasts, By Application (2020-2032) (USD Billion)

12.6.9 Argentina

12.6.9.1 Argentina AI Data Center Market Estimates And Forecasts, By Component (2020-2032) (USD Billion)

12.6.9.2 Argentina AI Data Center Market Estimates And Forecasts, By Industry Vertical (2020-2032) (USD Billion)

12.6.9.3 Argentina AI Data Center Market Estimates And Forecasts, By Data Center Type (2020-2032) (USD Billion)

12.6.9.4 Argentina AI Data Center Market Estimates And Forecasts, By Deployment Mode (2020-2032) (USD Billion)

12.6.9.5 Argentina AI Data Center Market Estimates And Forecasts, By Application (2020-2032) (USD Billion)

12.6.10 Rest Of Latin America

12.6.10.1 Rest Of Latin America AI Data Center Market Estimates And Forecasts, By Component (2020-2032) (USD Billion)

12.6.10.2 Rest Of Latin America AI Data Center Market Estimates And Forecasts, By Industry Vertical (2020-2032) (USD Billion)

12.6.10.3 Rest Of Latin America AI Data Center Market Estimates And Forecasts, By Data Center Type (2020-2032) (USD Billion)

12.6.10.4 Rest Of Latin America AI Data Center Market Estimates And Forecasts, By Deployment Mode (2020-2032) (USD Billion)

12.6.10.5 Rest Of Latin America AI Data Center Market Estimates And Forecasts, By Application (2020-2032) (USD Billion)

13. Company Profiles

     13.1 Advanced Micro Devices, Inc.

13.1.1 Company Overview

13.1.2 Financial

13.1.3 Products/ Services Offered

13.1.4 SWOT Analysis

    13.2 Amazon Web Services, Inc          

13.2.1 Company Overview

13.2.2 Financial

13.2.3 Products/ Services Offered

13.2.4 SWOT Analysis

   13.3 Arista Networks, Inc

13.3.1 Company Overview

13.3.2 Financial

13.3.3 Products/ Services Offered

13.3.4 SWOT Analysis

  13.4 Cisco Systems, Inc

13.4.1 Company Overview

13.4.2 Financial

13.4.3 Products/ Services Offered

13.4.4 SWOT Analysis

  13.5 Dell Technologies

13.5.1 Company Overview

13.5.2 Financial

13.5.3 Products/ Services Offered

13.5.4 SWOT Analysis

  13.6 Google LLC

13.6.1 Company Overview

13.6.2 Financial

13.6.3 Products/ Services Offered

13.6.4 SWOT Analysis

 13.7 Hewlett Packard Enterprise Development LP

13.7.1 Company Overview

13.7.2 Financial

13.7.3 Products/ Services Offered

13.7.4 SWOT Analysis

 13.8 Hitachi Vantara LLC

13.8.1 Company Overview

13.8.2 Financial

13.8.3 Products/ Services Offered

13.8.4 SWOT Analysis

 13.9 Intel Corporation

13.9.1 Company Overview

13.9.2 Financial

13.9.3 Products/ Services Offered

13.9.4 SWOT Analysis

  13.10 International Business Machines Corporation

13.10.1 Company Overview

13.10.2 Financial

13.10.3 Products/ Services Offered

13.10.4 SWOT Analysis

14. Use Cases and Best Practices

15. Conclusion

An accurate research report requires proper strategizing as well as implementation. There are multiple factors involved in the completion of good and accurate research report and selecting the best methodology to compete the research is the toughest part. Since the research reports we provide play a crucial role in any company’s decision-making process, therefore we at SNS Insider always believe that we should choose the best method which gives us results closer to reality. This allows us to reach at a stage wherein we can provide our clients best and accurate investment to output ratio.

Each report that we prepare takes a timeframe of 350-400 business hours for production. Starting from the selection of titles through a couple of in-depth brain storming session to the final QC process before uploading our titles on our website we dedicate around 350 working hours. The titles are selected based on their current market cap and the foreseen CAGR and growth.


The 5 steps process:

Step 1: Secondary Research:

Secondary Research or Desk Research is as the name suggests is a research process wherein, we collect data through the readily available information. In this process we use various paid and unpaid databases which our team has access to and gather data through the same. This includes examining of listed companies’ annual reports, Journals, SEC filling etc. Apart from this our team has access to various associations across the globe across different industries. Lastly, we have exchange relationships with various university as well as individual libraries.

Secondary Research

Step 2: Primary Research

When we talk about primary research, it is a type of study in which the researchers collect relevant data samples directly, rather than relying on previously collected data.  This type of research is focused on gaining content specific facts that can be sued to solve specific problems. Since the collected data is fresh and first hand therefore it makes the study more accurate and genuine.

We at SNS Insider have divided Primary Research into 2 parts.

Part 1 wherein we interview the KOLs of major players as well as the upcoming ones across various geographic regions. This allows us to have their view over the market scenario and acts as an important tool to come closer to the accurate market numbers. As many as 45 paid and unpaid primary interviews are taken from both the demand and supply side of the industry to make sure we land at an accurate judgement and analysis of the market.

This step involves the triangulation of data wherein our team analyses the interview transcripts, online survey responses and observation of on filed participants. The below mentioned chart should give a better understanding of the part 1 of the primary interview.

Primary Research

Part 2: In this part of primary research the data collected via secondary research and the part 1 of the primary research is validated with the interviews from individual consultants and subject matter experts.

Consultants are those set of people who have at least 12 years of experience and expertise within the industry whereas Subject Matter Experts are those with at least 15 years of experience behind their back within the same space. The data with the help of two main processes i.e., FGDs (Focused Group Discussions) and IDs (Individual Discussions). This gives us a 3rd party nonbiased primary view of the market scenario making it a more dependable one while collation of the data pointers.

Step 3: Data Bank Validation

Once all the information is collected via primary and secondary sources, we run that information for data validation. At our intelligence centre our research heads track a lot of information related to the market which includes the quarterly reports, the daily stock prices, and other relevant information. Our data bank server gets updated every fortnight and that is how the information which we collected using our primary and secondary information is revalidated in real time.

Data Bank Validation

Step 4: QA/QC Process

After all the data collection and validation our team does a final level of quality check and quality assurance to get rid of any unwanted or undesired mistakes. This might include but not limited to getting rid of the any typos, duplication of numbers or missing of any important information. The people involved in this process include technical content writers, research heads and graphics people. Once this process is completed the title gets uploader on our platform for our clients to read it.

Step 5: Final QC/QA Process:

This is the last process and comes when the client has ordered the study. In this process a final QA/QC is done before the study is emailed to the client. Since we believe in giving our clients a good experience of our research studies, therefore, to make sure that we do not lack at our end in any way humanly possible we do a final round of quality check and then dispatch the study to the client.

Key Segments: 

By Component 

    • Hardware

    • Software

    • Services

By Data Center Type

    • Hyperscale Data Centers

    • Enterprise Data Centers

    • Colocation Data Centers

    • Edge Data Centers

    • Modular & Portable Data Centers

By Deployment

    • On-Premises

    • Cloud-Based

    • Hybrid

By Application

    • AI Model Training

    • AI Model Inference

    • Big Data Analytics

    • Computer Vision Processing

    • Natural Language Processing (NLP)

    • Autonomous Systems & Robotics

    • Cybersecurity & Fraud Detection

By Industry Vertical

    • IT & Telecom

    • BFSI

    • Healthcare

    • Retail & E-commerce

    • Manufacturing

    • Government & Defense

    • Energy & Utilities

    • Media & Entertainment

    • Automotive

    • Others


Request for Segment Customization as per your Business Requirement: Segment Customization Request

Regional Coverage: 

North America

  • US

  • Canada

  • Mexico

Europe

  • Germany

  • France

  • UK

  • Italy

  • Spain

  • Poland

  • Turkey

  • Rest of Europe

Asia Pacific

  • China

  • India

  • Japan

  • South Korea

  • Singapore

  • Australia

  • Rest of Asia Pacific

Middle East & Africa

  • UAE

  • Saudi Arabia

  • Qatar

  • South Africa

  • Rest of Middle East & Africa

Latin America

  • Brazil

  • Argentina

  • Rest of Latin America

Request for Country Level Research Report: Country Level Customization Request

Available Customization 

With the given market data, SNS Insider offers customization as per the company’s specific needs. The following customization options are available for the report: 

  • Detailed Volume Analysis 

  • Criss-Cross segment analysis (e.g. Product X Application) 

  • Competitive Product Benchmarking 

  • Geographic Analysis 

  • Additional countries in any of the regions 

  • Customized Data Representation 

  • Detailed analysis and profiling of additional market players

Explore Key Insights.


  • Analyzes market trends, forecasts, and regional dynamics
  • Covers core offerings, innovations, and industry use cases
  • Profiles major players, value chains, and strategic developments
  • Highlights innovation trends, regulatory impacts, and growth opportunities
Request an Analyst Call