Action Camera Market Report Scope & Overview:
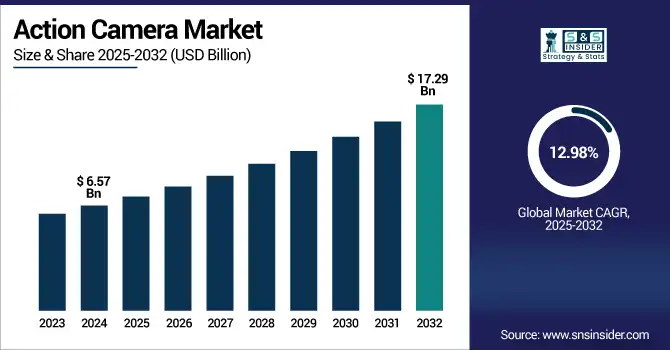
Action Camera Market was valued at USD 6.57 billion in 2024 and is expected to reach USD 17.29 billion by 2032, growing at a CAGR of 12.98% from 2025-2032.
To Get more information on Action Camera Market - Request Free Sample Report
The growth of the Action Camera Market is primarily driven by the rising popularity of adventure sports, travel vlogging, and outdoor recreational activities worldwide. The increasing demand for compact, rugged, and high-resolution imaging devices, especially 4K and 360-degree cameras, supports market expansion. Social media influence and content creation trends are pushing consumers, particularly millennials and Gen Z, toward action cameras for immersive and real-time experiences. Additionally, advancements in connectivity features like Wi-Fi, Bluetooth, and live streaming, along with waterproof and shockproof designs, are enhancing product appeal. Expanding usage in automotive, emergency services, and security sectors further accelerates market demand.
-
In 2023, GoPro sold 3 million camera units, marking a 6% increase over 2022. Subscription services grew to 2.5 million subscribers, up 12% year-over-year, generating USD 97 million in service revenue (an 18% rise).
-
HERO13 Black, launched in September 2024, introduced new lens options (macro, ND filters), Wi‑Fi 6, HyperSmooth 6.0 stabilization, 5.3 K/60 fps resolution, and live-streaming support.
U.S. Action Camera Market was valued at USD 1.65 billion in 2024 and is expected to reach USD 4.28 billion by 2032, growing at a CAGR of 12.62% from 2025-2032.
The U.S. Action Camera Market is growing due to increasing adoption in sports, travel, and adventure activities, rising content creation for social media, and technological advancements like 4K resolution, waterproofing, and wireless connectivity enhancing user experience and market penetration.
Market Dynamics
Drivers
-
Growing Popularity of Adventure Tourism and Extreme Sports Is Increasing Action Camera Adoption Among Enthusiasts and Travelers Worldwide
Rising enthusiasm for adventure sports and experiential travel is significantly boosting action camera demand. Consumers are actively documenting activities such as skydiving, scuba diving, mountain biking, and snowboarding using durable, high-quality action cameras. These devices are preferred for their compact size, image stabilization, and waterproof capabilities. Influencers and vloggers further amplify demand by showcasing adventures on YouTube, Instagram, and TikTok. As global tourism rebounds post-pandemic, especially among younger travelers, action cameras are increasingly seen as essential gear. This trend is encouraging manufacturers to innovate with 4K video support, improved battery life, and seamless mobile integration for instant content sharing.
-
GoPro has strengthened its presence in high-adrenaline sports: it was appointed as the official action camera of X Games Aspen 2024, used by over 100 elite ski and snowboard athletes, reaching 2.4 million viewers across ABC and ESPN broadcasts.
-
According to UNWTO, international tourist arrivals rebounded to approximately 90% of pre-COVID levels by the end of 2023, with 1.4 billion tourists traveling in 2024 marking a near-complete recovery.
-
Influencers and vloggers documenting extreme activities increasingly rely on action cameras like the HERO13 Black for waterproof performance, HyperSmooth stabilization, and 360° capture to create immersive content.
Restraints
-
Limited Battery Life and Storage Capacity Create Frustration for Users Engaging in Long-Duration or Remote Outdoor Activities
Insufficient battery performance and onboard storage hinder the usability of action cameras for prolonged activities such as hiking, motorcycling, or camping. Despite compact designs, the high power consumption from 4K/5K recording, GPS, and wireless connectivity drains batteries quickly, often within an hour or two. Additionally, users face constraints when recording extended footage due to limited SD card capacities or device overheating. Frequent recharging or swapping batteries is impractical in remote areas. These limitations impact the reliability and convenience of action cameras for adventure seekers, prompting some users to consider alternative solutions or postpone purchase decisions.
Opportunities
-
Expanding Demand From Security, Law Enforcement, and Industrial Applications Opens New Commercial Avenues for Action Camera Manufacturers
Widening application of action cameras in surveillance, police body-worn devices, firefighting, and industrial safety presents a significant growth opportunity. These sectors value compact, durable, and high-resolution cameras that can operate in extreme environments and capture real-time video. Action cameras offer cost-effective alternatives to traditional surveillance tools with benefits such as wide-angle views, portability, and easy data transfer. As public safety agencies and private firms increasingly embrace wearable tech for transparency and accountability, demand is growing. Moreover, action cameras are gaining adoption in logistics, warehouse monitoring, and construction site documentation, further diversifying their industrial and professional applications globally.
-
The UK’s Biometrics and Surveillance Camera Commissioner emphasizes the rising use of rugged wearable and public-space cameras by police, transport, local authorities, and industrial sites driven by cost-effective, flexible deployments.
-
Funding via American Rescue Plan Act (ARPA) grants helped deploy bodycams and dashcams for enhanced transparency and real-time capture of patrol scenarios.
Challenges
-
Fierce Competition From Smartphones With Advanced Camera Capabilities Reduces the Unique Value Proposition of Action Cameras
Rapid advancements in smartphone camera technology are challenging the appeal of standalone action cameras. Flagship smartphones now feature high-resolution sensors, AI-powered image processing, stabilization, and waterproofing—features once exclusive to action cameras. For casual users, smartphones are more convenient and multipurpose, making them preferable for capturing daily or spontaneous activities. Additionally, the widespread use of accessories like gimbals and waterproof cases enhances smartphone performance in dynamic settings. This growing overlap in functionality blurs product differentiation, forcing action camera brands to innovate faster, focus on niche segments, or offer bundled services to retain competitive relevance.
Segment Analysis
By Application
Sports and adventure activities accounted for the highest revenue share of 39% in 2024 due to widespread usage among outdoor enthusiasts, athletes, and influencers capturing dynamic, high-intensity experiences. These cameras are preferred for their durability, compact size, and ability to record in challenging environments like underwater or mountainous terrain. Additionally, the rising trend of documenting personal achievements and extreme sports significantly drives segment demand across global tourism hubs.
The automotive segment is expected to grow at the fastest CAGR of 16.00% from 2025 to 2032, driven by increasing integration of action cameras in dashcam systems, motorsports, and vehicle documentation. Consumers are using these cameras for safety recording, accident evidence, and immersive driving content. The rise of autonomous and connected vehicles also encourages the use of compact, high-resolution cameras for real-time monitoring and visual documentation.
By Product
Box-style cameras dominated the market in 2024 with a 35% revenue share owing to their traditional design, ease of use, and compatibility with a wide range of mounts and accessories. These cameras offer robust performance, long battery life, and stable recording, making them ideal for action sports, travel vlogging, and commercial use. Their versatility and established market presence continue to attract consumers across different usage environments.
The 360-degree camera segment is projected to grow at a CAGR of 15.58% from 2025 to 2032, fueled by increasing demand for immersive content creation in sports, tourism, and virtual experiences. These cameras provide panoramic video capabilities and enhanced viewer interactivity, aligning with trends in VR, AR, and metaverse integration. Social media and content platforms also support immersive video formats, further boosting market adoption.
By Resolution
SD & Full HD cameras held the highest market share of 25% in 2024 due to affordability, sufficient resolution for everyday use, and broad compatibility with online streaming and social media platforms. These models cater to budget-conscious consumers, entry-level users, and casual vloggers. Their efficient storage usage, longer recording time, and widespread accessibility make them a preferred choice in many developing and mid-range markets.
The 4K and above camera segment is expected to grow at a CAGR of 14.18% from 2025 to 2032 as consumers and professionals increasingly demand ultra-high-definition video quality. Advancements in sensor technology, video editing software, and larger storage options enable smoother adoption of 4K and 5K content. This trend is particularly driven by content creators, filmmakers, and streamers seeking sharp, cinematic-quality visuals for high-end output.
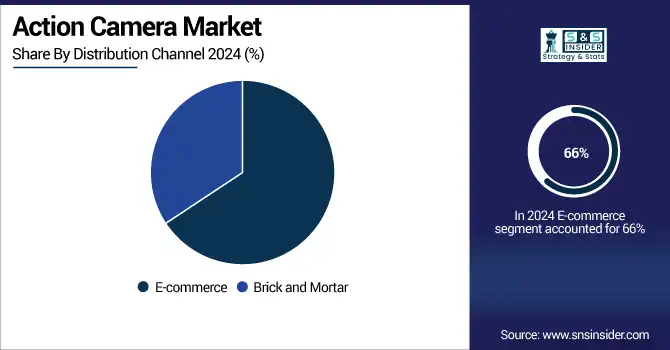
By Distribution Channel
E-commerce accounted for the largest revenue share of 66% in 2024 and is projected to grow at the fastest CAGR of 13.76% from 2025 to 2032 due to the convenience, wide product variety, and competitive pricing offered by online platforms. Consumers increasingly prefer purchasing action cameras through e-commerce channels for access to reviews, discounts, and global brands. Fast delivery, easy returns, and detailed product comparisons further enhance customer experience. Growing digital literacy, smartphone usage, and online payment adoption especially in emerging markets continue to drive strong growth across global e-commerce platforms selling action cameras.
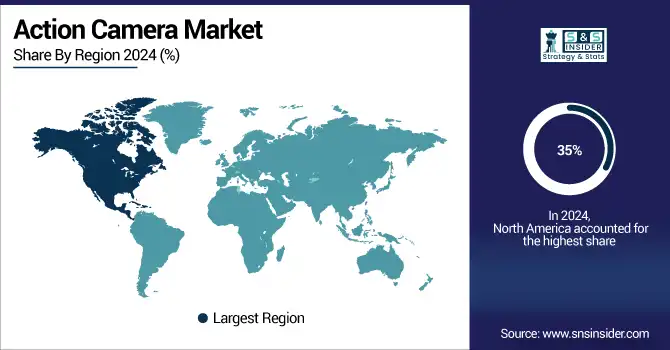
Regional Analysis
North America held the largest revenue share of 35% in 2024 due to high consumer spending on outdoor recreation, advanced technology adoption, and the presence of key action camera manufacturers. The region’s mature adventure tourism industry, strong influencer culture, and widespread social media usage further drive demand. Additionally, robust e-commerce infrastructure and early uptake of high-resolution and smart camera technologies contribute to sustained market dominance.
The United States is dominating the North America action camera market due to high consumer demand, advanced technology adoption, and strong adventure tourism trends.
Asia Pacific is projected to grow at the fastest CAGR of 14.76% from 2025 to 2032, driven by rising disposable incomes, growing adventure tourism, and increasing content creation across emerging economies. Expanding digital penetration, affordable smartphone access, and rising popularity of video-sharing platforms like TikTok and YouTube are boosting first-time camera adoption. Local manufacturing growth and e-commerce expansion further fuel action camera sales across the region.
China is dominating the Asia Pacific action camera market due to its large consumer base, strong manufacturing capabilities, and rapid growth in adventure tourism and e-commerce.
Europe holds a significant share in the action camera market, supported by strong adventure sports participation, rising travel trends, and growing demand for high-quality content creation. Increasing online retail penetration and tech-savvy consumers further contribute to sustained market growth across the region.
Germany is dominating the Europe action camera market, driven by strong outdoor sports culture, high consumer spending, and advanced digital infrastructure supporting content creation.
The Middle East & Africa and Latin America action camera markets are experiencing steady growth, driven by expanding tourism, rising youth interest in adventure activities, and increasing smartphone and internet penetration, which support content sharing and e-commerce-based camera purchases.
Get Customized Report as per Your Business Requirement - Enquiry Now
Key Players
Action Camera Market companies are GoPro Inc., Garmin Ltd., Sony Group Corporation, DJI, YI Technology, SJCAM, AKASO Tech LLC, ARASHI VISION INC. (Insta360), DRIFT, RICOH Company Ltd., Veho, Contour, MOZA (Gudsen Technology), ISAW, SOOCOO, Campark Electronics, Victure, Ordro, EKEN, AEE Technology Inc.
Recent Developments:
-
2023: DJI launched the Osmo Action 4 featuring a 1/1.3″ sensor, magnetic quick-release, ultra-wide 155° FOV, 10‑bit D‑Log M color, low-light optimization, and HorizonSteady stabilization.
-
2024: DJI released the Osmo Action 5 Pro with 13.5‑stop dynamic range, 4‑hour battery life, advanced subject tracking, 10‑bit HDR video, and pro-grade image quality aimed at creators and athletes.
-
2025: GoPro refreshed its MAX 360 camera, introducing new 360° Quik app editing tools and AI-powered object tracking, enhancing immersive content creation for professionals and hobbyists.
| Report Attributes | Details |
|---|---|
| Market Size in 2024 | USD 6.57 Billion |
| Market Size by 2032 | USD 17.29 Billion |
| CAGR | CAGR of 12.98% From 2025 to 2032 |
| Base Year | 2024 |
| Forecast Period | 2025-2032 |
| Historical Data | 2021-2023 |
| Report Scope & Coverage | Market Size, Segments Analysis, Competitive Landscape, Regional Analysis, DROC & SWOT Analysis, Forecast Outlook |
| Key Segments | • By Product (Box Style Camera, Cube Style Camera, Bullet Style Camera, 360-degree Camera, Others) • By Resolution (SD & Full HD, Ultra HD, 4K and Above) • By Distribution Channel (E-commerce, Brick and Mortar) • By Application (Sports and Adventure, Travel and Tourism, Automotive, Emergency Services, Security, Others) |
| Regional Analysis/Coverage | North America (US, Canada), Europe (Germany, UK, France, Italy, Spain, Russia, Poland, Rest of Europe), Asia Pacific (China, India, Japan, South Korea, Australia, ASEAN Countries, Rest of Asia Pacific), Middle East & Africa (UAE, Saudi Arabia, Qatar, South Africa, Rest of Middle East & Africa), Latin America (Brazil, Argentina, Mexico, Colombia, Rest of Latin America). |
| Company Profiles | GoPro Inc., Garmin Ltd., Sony Group Corporation, DJI, YI Technology, SJCAM, AKASO Tech LLC, ARASHI VISION INC. (Insta360), DRIFT, RICOH Company Ltd., Veho, Contour, MOZA (Gudsen Technology), ISAW, SOOCOO, Campark Electronics, Victure, Ordro, EKEN, AEE Technology Inc. |
Frequently Asked Questions
North America dominated the Action Camera Market in 2024, led by high consumer spending, outdoor activity culture, and advanced tech adoption.
Box-style cameras dominated with the highest revenue share in 2024 due to durability, ease of use, and compatibility with various mounts.
The market is primarily driven by the rising popularity of adventure sports, travel vlogging, and demand for compact, high-resolution cameras.
The Action Camera Market was valued at USD 6.57 billion in 2024, with strong demand from adventure tourism and social media influencers.
The Action Camera Market is expected to grow at a CAGR of 12.98% from 2025 to 2032, driven by rising content creation and tourism.
Get in Touch
