Threat Modeling Tools Market Report Scope & Overview:
The Threat Modeling Tools Market was valued at USD 0.95 billion in 2023 and is expected to reach USD 3.37 billion by 2032, growing at a CAGR of 15.17% from 2024-2032.

To Get More Information on Threat Modeling Tools Market - Request Sample Report
The Threat Modeling Tools market is witnessing notable expansion as the increasing prevalence and complexity of cyberattacks drive organizations to implement proactive cybersecurity strategies. In 2024, the average cost of a data breach is USD 4.88 million, prompting businesses to focus on security measures to prevent these expensive incidents. As companies adopt digital technologies and expand their online visibility, the demand for tools to recognize, evaluate, and alleviate potential risks grows increasingly vital. 48% of small and medium enterprises have faced a cyberattack, and 67% of successful breaches are attributed to human mistakes. The 72% rise in security breaches between 2021 and 2023 highlights the urgency even more. The increasing understanding, particularly in areas such as finance, healthcare, and government, fuels the use of threat modeling tools as an essential component of holistic cybersecurity approaches.
This increased demand is further enhanced by the rising intricacy of IT systems and the swift advancement of technologies like IoT, cloud computing, and AI. With cyberattacks becoming increasingly advanced, conventional security measures are inadequate, leading to a heightened demand for expert threat modeling tools. To address these challenges, IBM launched a new generative AI-driven cybersecurity assistant in August 2024 to improve its Threat Detection and Response services. These tools are crucial for detecting weaknesses in dynamic, tech-oriented settings and are increasingly needed to blend effortlessly into development workflows. This transition to ongoing and instant threat evaluations creates new growth possibilities, making threat modeling tools essential resources for contemporary organizations.
Looking toward the future, the demand for threat modeling tools is poised for ongoing expansion, driven by the integration of AI and machine learning to improve predictive abilities and provide more precise risk evaluations. In May 2024, Palo Alto Networks launched AI-driven security solutions, such as AI Access Security, AI-SPM, and AI Runtime Security, to assist businesses in tackling advanced threats and ensuring secure AI integration. As cybersecurity regulations become stricter, organizations will rely more on these tools to maintain compliance and safeguard their digital assets. Moreover, the extensive implementation of DevSecOps methods, highlighting security across the development lifecycle, will additionally boost the need for threat modeling solutions. In this regard, threat modeling tools will be essential for safeguarding digital ecosystems and tackling the changing nature of cyber threats.
Market Dynamics
Drivers
-
The Integration of Advanced Analytics and AI in Threat Modeling Tools is Revolutionizing Cybersecurity Strategies
The incorporation of advanced analytics, artificial intelligence (AI), and machine learning into threat modeling tools is significantly enhancing their capabilities in detecting vulnerabilities and automating the prediction of potential security threats. These technologies enable threat modeling tools to analyze vast amounts of data quickly, identifying patterns and anomalies that might otherwise go unnoticed by human analysts. With AI-driven algorithms, organizations can predict possible attack vectors more accurately and assess security risks in real time, improving response times and mitigating potential damage. Moreover, AI can continually learn from evolving attack tactics, making the tools more adaptive and efficient in recognizing new vulnerabilities. This integration not only strengthens security measures but also reduces manual intervention, driving the adoption of these sophisticated tools across various industries in the wake of increasing cybersecurity threats.
-
The Escalating Sophistication of Cybersecurity Threats and Increasing Data Breaches are Urging the Adoption of Advanced Threat Modeling Tools
As cyberattacks grow more sophisticated, organizations are increasingly turning to advanced threat modeling tools to predict, prevent, and mitigate potential security risks. The complexity of modern attacks requires proactive and innovative security measures, driving the demand for tools that can simulate and analyze vulnerabilities before they are exploited. Additionally, the rise in high-profile data breaches underscores the critical need for early identification and resolution of security weaknesses. These incidents highlight the importance of addressing vulnerabilities early in the development cycle, making threat modeling an essential part of a company’s cybersecurity strategy. By integrating these tools into their security framework, businesses can more effectively safeguard against evolving threats and reduce the likelihood of data breaches, making them indispensable in today’s rapidly changing digital landscape.
Restraints
-
The High Initial and Ongoing Costs of Advanced Threat Modeling Tools Pose Challenges for Widespread Adoption
The high initial investment and ongoing maintenance costs of advanced threat modeling tools present significant challenges, particularly for small to mid-sized organizations. These businesses often struggle to allocate the necessary budget for sophisticated cybersecurity solutions, which can be prohibitively expensive when factoring in both the upfront purchase and the ongoing costs associated with updates, support, and training. Additionally, implementing these tools requires skilled professionals, which further increases the overall cost. For smaller organizations with limited resources, the financial burden of adopting these tools can outweigh the perceived benefits, limiting their ability to secure their systems effectively. As a result, many companies may either delay adoption or opt for less comprehensive, lower-cost alternatives, hindering the overall market growth and limiting the reach of threat modeling solutions across different business segments.
-
Organizational Resistance to Adopting New Threat Modeling Tools and Changing Established Security Processes
Many organizations face challenges in transitioning to new threat modeling tools due to resistance to change, especially if they are accustomed to traditional methods of threat detection and mitigation. Established security processes, even if less advanced, are often deeply ingrained in the company’s culture and operations. The perceived disruption that comes with integrating new tools, combined with a lack of immediate clarity on their benefits, makes some organizations hesitant to adopt them. Additionally, the learning curve associated with new technologies can be daunting, particularly for teams with limited experience or training in cutting-edge cybersecurity practices. As a result, companies may continue relying on older, more familiar security methods, delaying or avoiding the adoption of more effective, modern threat modeling tools, thereby hindering the market’s potential for growth.
Segment Analysis
By Component
In 2023, the Solution segment dominated the Threat Modeling Tools Market with a substantial revenue share of approximately 73%. This dominance is largely attributed to the growing demand for comprehensive, automated threat modeling solutions that provide businesses with scalable and effective protection against evolving cyber threats. As organizations increasingly rely on advanced technologies for risk assessment, these solutions offer enhanced security measures that address vulnerabilities early in the development cycle, making them integral to modern cybersecurity strategies.
The Services segment is expected to grow at the fastest CAGR of 17.24% from 2024 to 2032. This rapid expansion is driven by the increasing demand for expert consultation, implementation support, and ongoing maintenance of threat modeling tools. As businesses continue to adopt these tools, the need for specialized services to optimize their integration and ensure effective utilization becomes paramount, propelling the growth of the services sector within the market.
By Platform
In 2023, the Web-Based segment led the Threat Modeling Tools Market with a dominant revenue share of approximately 54%. This dominance is primarily driven by the increasing adoption of web-based platforms, which offer easy accessibility, scalability, and flexibility for businesses. These solutions allow organizations to seamlessly integrate threat modeling into their existing security infrastructures, providing real-time vulnerability detection without the need for significant hardware investments or complex installations, making them an attractive choice for businesses of all sizes.
The Cloud-Based segment is expected to grow at the fastest CAGR of 16.76% from 2024 to 2032. This rapid expansion is fueled by the growing preference for cloud solutions, which offer cost-efficiency, remote accessibility, and enhanced collaboration across geographically dispersed teams. As organizations increasingly move their operations to the cloud, the demand for cloud-based threat modeling tools that ensure secure, scalable, and flexible cybersecurity solutions is expected to rise, further accelerating market growth in this segment.
By Type
In 2023, the Static Analysis Tools segment dominated the Threat Modeling Tools Market, capturing a significant revenue share of approximately 48%. This leadership can be attributed to the effectiveness of static analysis in detecting vulnerabilities early in the development process, before the software is even run. Static analysis tools allow businesses to identify issues in the code structure and logic, making them a crucial part of the software development lifecycle and a preferred choice for organizations aiming to reduce risks before deployment.
The Hybrid Analysis Tools segment is expected grow at the fastest CAGR of 17.58% from 2024 to 2032. This growth is driven by the increasing need for more comprehensive threat detection solutions that combine both static and dynamic analysis techniques. Hybrid tools offer the advantages of analyzing both the code and its behavior during runtime, providing a more thorough understanding of potential threats. As cybersecurity needs evolve, businesses are seeking these versatile tools to ensure a robust defense across multiple attack vectors, propelling the market’s rapid expansion.
Regional Analysis
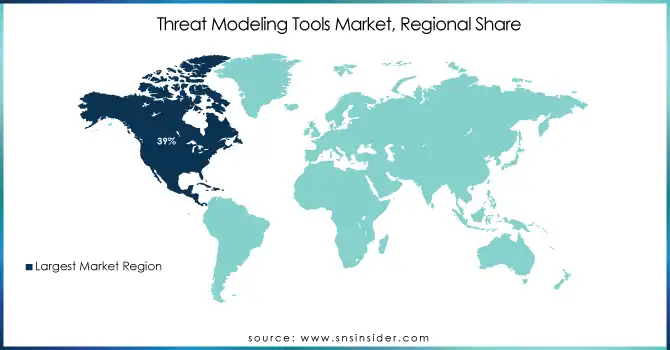
In 2023, North America dominated the Threat Modeling Tools Market, securing the largest revenue share of approximately 39%. This market leadership is driven by the region's strong emphasis on cybersecurity across both public and private sectors, particularly in the United States and Canada. The increasing frequency of cyberattacks and stringent regulatory requirements for data protection have prompted businesses to invest heavily in advanced threat modeling tools, ensuring comprehensive risk management and compliance with evolving security standards.
The Asia Pacific region is expected to grow at the fastest CAGR of 17.34% from 2024 to 2032. This rapid expansion is fueled by the region's increasing digital transformation and heightened awareness of cybersecurity risks. As businesses across industries such as finance, healthcare, and manufacturing embrace advanced security solutions, the demand for threat modeling tools is surging. Additionally, favorable government initiatives and investments in technology infrastructure are driving the growth of the cybersecurity market in this rapidly developing region.
Do You Need any Customization Research on Threat Modeling Tools Market - Enquire Now
Key Players
-
Cisco Systems, Inc. (Cisco Threat Response, Cisco SecureX)
-
Sparx Systems Pty Ltd. (Enterprise Architect, Pro Cloud Server)
-
Varonis Systems Inc. (DatAdvantage, Data Classification Engine)
-
Mandiant (Mandiant Advantage, Mandiant Threat Intelligence)
-
Intel Corporation (Intel Security Innovation Platform, Intel Threat Detection Technology)
-
Kroll, LLC. (Kroll Responder, Kroll Cyber Risk Management)
-
Synopsys (Black Duck, Coverity)
-
IBM Corporation (IBM Security QRadar, IBM Guardium)
-
Microsoft Corporation (Microsoft Sentinel, Microsoft Defender)
-
Coalfire Systems, Inc. (CoalfireOne, Coalfire GRC)
-
Avocado Systems (Avocado Security, Avocado Enterprise Security)
-
ThreatModeler (ThreatModeler, ThreatModeler Cloud)
-
Secure Engineering (Secure Design Studio, Secure Risk)
-
Rogue Wave Software (Klocwork, Protect)
-
Aquila (Aquila Threat Modeling, Aquila Risk Manager)
-
RiskSense (RiskSense Platform, RiskSense Threat Intelligence)
-
Immersive Labs (Immersive Labs Cyber Range, Immersive Labs Threat Intelligence)
-
Nozomi Networks (Nozomi Networks Guardian, Nozomi Networks SCADAguardian)
-
ThreatQuotient (ThreatQ, ThreatQ Threat Intelligence Platform)
-
Zylo (Zylo Threat Modeling, Zylo Risk Analysis)
-
Palo Alto Networks (Cortex XSOAR, Cortex XDR)
Recent Developments:
-
In January 2025, Cisco unveiled its AI Defense solution to secure the AI transformation of enterprises, safeguarding AI applications from evolving threats such as data leakage and model misuse. The solution integrates advanced security features to help enterprises develop, deploy, and manage AI applications securely, addressing new risks beyond the capabilities of traditional security solutions.
-
Varonis introduced new data security tools at Dreamforce 2024 to enhance the protection of sensitive data across organizations, focusing on advanced detection and response capabilities to mitigate risks associated with data breaches and insider threats.
| Report Attributes | Details |
| Market Size in 2023 | USD 0.95 Billion |
| Market Size by 2032 | USD 3.37 Billion |
| CAGR | CAGR of 15.17% From 2024 to 2032 |
| Base Year | 2023 |
| Forecast Period | 2024-2032 |
| Historical Data | 2020-2022 |
| Report Scope & Coverage | Market Size, Segments Analysis, Competitive Landscape, Regional Analysis, DROC & SWOT Analysis, Forecast Outlook |
| Key Segments | • By Component (Solution, Services) • By Platform (Web-Based, Cloud-Based, Desktop-Based) • By Enterprise Size (Large Enterprise, Small and Medium Size Enterprise) • By Type (Static Analysis Tools, Dynamic Analysis Tools, Hybrid Analysis Tools) • By Application (IT & Telecom, BFSI, Healthcare, Manufacturing, Utilities) |
| Regional Analysis/Coverage | North America (US, Canada, Mexico), Europe (Eastern Europe [Poland, Romania, Hungary, Turkey, Rest of Eastern Europe] Western Europe] Germany, France, UK, Italy, Spain, Netherlands, Switzerland, Austria, Rest of Western Europe]), Asia Pacific (China, India, Japan, South Korea, Vietnam, Singapore, Australia, Rest of Asia Pacific), Middle East & Africa (Middle East [UAE, Egypt, Saudi Arabia, Qatar, Rest of Middle East], Africa [Nigeria, South Africa, Rest of Africa], Latin America (Brazil, Argentina, Colombia, Rest of Latin America) |
| Company Profiles | Cisco Systems, Inc., Sparx Systems Pty Ltd., Varonis Systems Inc., Mandiant, Intel Corporation, Kroll, LLC., Synopsys, IBM Corporation, Microsoft Corporation, Coalfire Systems, Inc., Avocado Systems, ThreatModeler, Secure Engineering, Rogue Wave Software, Aquila, RiskSense, Immersive Labs, Nozomi Networks, ThreatQuotient, Zylo, Palo Alto Networks. |
| Key Drivers | • The Integration of Advanced Analytics and AI in Threat Modeling Tools is Revolutionizing Cybersecurity Strategies • The Escalating Sophistication of Cybersecurity Threats and Increasing Data Breaches are Urging the Adoption of Advanced Threat Modeling Tools |
| RESTRAINTS | • The High Initial and Ongoing Costs of Advanced Threat Modeling Tools Pose Challenges for Widespread Adoption • Organizational Resistance to Adopting New Threat Modeling Tools and Changing Established Security Processes |
Frequently Asked Questions
Ans. The Solution segment dominated the market with approximately 73% revenue share in 2023.
Ans. The Static Analysis Tools segment dominated the market with a 48% revenue share in 2023.
Ans. The Asia Pacific region is expected to grow at the fastest CAGR of 17.34% from 2024 to 2032.
Ans. North America dominated the market with a 39% revenue share in 2023.
Ans. Threat Modeling Tools Market was valued at USD 0.95 billion in 2023 and is expected to reach USD 3.37 billion by 2032, growing at a CAGR of 15.17% from 2024-2032.
Get in Touch
