AI-Driven Travel Experience Personalization Market Report Scope & Overview:
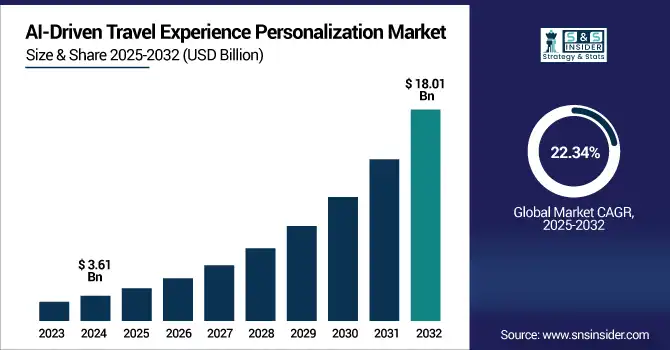
AI-Driven Travel Experience Personalization Market was valued at USD 3.61 billion in 2024 and is expected to reach USD 18.01 billion by 2032, growing at a CAGR of 22.34% from 2025-2032.
To Get more information on AI-Driven-Travel-Experience-Personalization-Market - Request Free Sample Report
The AI-Driven Travel Experience Personalization Market growth is due to rising demand for customized travel solutions, increasing adoption of AI and machine learning in the travel industry, and the surge in digital transformation across travel agencies, airlines, and online platforms.
In 2024, approximately 40% of global travelers already use AI in their travel planning, with over 60% open to adopting it adoption among Millennials and Gen Z reaches as high as 62%. Travelers now expect real-time, tailored recommendations for flights, hotels, and experiences based on behavior, preferences, and past bookings. The expansion of mobile and voice-enabled assistants, coupled with advancements in natural language processing and predictive analytics, enhances customer engagement and satisfaction.
Companies are leveraging AI for large-scale personalization Adobe’s 2025 Summit spotlighted how Marriott uses Adobe Experience Platform to generate tens of millions of content variations, cutting time-to-market by 70%. Meanwhile, Google and American Airlines launched Project Contrails, using AI to optimize flight paths, reduce fuel use, and lower carbon emissions. Additionally, increased competition among travel providers is driving innovation and investment in AI-powered personalization technologies.
Market Size and Forecast
-
Market Size in 2024: USD 3.61 Billion
-
Market Size by 2032: USD 18.01 Billion
-
CAGR: 22.34% from 2025 to 2032
-
Base Year: 2024
-
Forecast Period: 2025–2032
-
Historical Data: 2021–2023
AI-Driven Travel Experience Personalization Market Trends
-
Rising demand for personalized travel experiences is driving the AI-driven travel experience personalization market.
-
Integration of AI, machine learning, and big data analytics is enhancing itinerary planning, recommendations, and customer engagement.
-
Growing adoption by airlines, hotels, and travel platforms is boosting market growth.
-
Expansion of mobile apps, chatbots, and virtual assistants is improving real-time communication and service delivery.
-
Increasing focus on predictive insights, dynamic pricing, and targeted marketing is shaping adoption trends.
-
Growth of online bookings, experiential travel, and loyalty programs is fueling demand.
-
Collaborations between travel companies, AI technology providers, and analytics firms are accelerating innovation and deployment.
U.S. AI-Driven Travel Experience Personalization Market was valued at USD 0.91 billion in 2024 and is expected to reach USD 4.47 billion by 2032, growing at a CAGR of 22.07% from 2025-2032.
The U.S. market is growing due to increasing demand for hyper-personalized travel services, rising use of AI in booking and customer support, and widespread digital adoption. Travel companies are leveraging data-driven insights to enhance user experience, while consumer expectations for tailored, real-time recommendations continue to accelerate AI integration.
AI-Driven Travel Experience Personalization Market Growth Drivers:
-
Rapid Growth In Digital Tourism Platforms Is Increasing Demand For Hyper-Personalized Travel Experiences Through AI-Based Content And Itinerary Solutions.
The increasing consumer demand for personalized and memorable travel experiences is compelling travel platforms to embrace AI-powered personalization solutions. Services such as Expedia, Airbnb and Booking. com is using Machine learning to analyze preferences, past behaviors and real-time interactions to suggest personalized travel experiences. AI enhances itinerary creation, hotel suggestions and real-time pricing. AI algorithms ensure effortless cross-device experiences as users expect on-demand personalisation and contextual information. Such a swift change is transforming digital tourism, expediting mass deployment of AI across entire customer journeys, while improving conversion and retention rates for ever-diversifying traveller types around the world.
Expedia reports that its in‑app conversational trip planner (built with ChatGPT) considers 1.26 quadrillion variables from hotel location and room types to date ranges and price points using AI and ML to deliver personalized, relevant trip options.
Booking.com reveals that 66 % of neurodivergent travelers are interested in AI assistance during travel, while 68 % request sensory‑friendly rooms and 74 % seek noise‑canceling options. Additionally, 66 % of travelers overall are keen on AI tools that deliver real‑time updates, delay alerts, and quieter alternative suggestions.
AI-Driven Travel Experience Personalization Market Restraints:
-
High Data Privacy Concerns And Regulatory Challenges Are Hindering AI-Based Personalization Initiatives In The Global Travel Ecosystem.
Continuous user data collection and analysis, such as location, behavior, and preferences are necessary for personalization which leads to huge privacy concerns. Demands to fill data processing requests are increasing, particularly in data law heavy regions like GDPR in Europe or CCPA in California, and travelers are becoming more sensitive to how their data is stored and utilized. There is growing pressure within the travel industry to guarantee compliance without sacrificing personalization. Ambiguous consent requirements and fear of legal liability slow down the adoption of AI. This mix of privacy concerns and lack of consistency in the regulation from market to market is a real restraint on global travel platforms scaling AI-driven personalization.
AI-Driven Travel Experience Personalization Market Opportunities:
-
Integration Of Generative AI And Conversational Agents Is Revolutionizing How Travelers Plan, Book, And Customize Their Journeys In Real Time.
The rise of generative AI and conversational interfaces, such as AI-powered travel planners or chatbots also brings new, more personalized features. Platforms are now capable of imitating human conversations, answering obscure questions, and generating itineraries on the fly. Travelers are getting personalized recommendations based not only on the data of the past, but the conversation of the moment. This interaction layer has humanized and attracts engagement and loyalty among users. Travel brands using AI agents as integrated into WhatsApp, Messenger, or branded apps gain a competitive advantage, being able to offer a 24/7 personalized assistant. That's a huge opportunity to improve travel planning experience and convert bookings.
For instance, brands on WhatsApp see strong engagement 66 % of users have transacted after interacting with a business, and 83 % log in daily, spending an average of 34 minutes.
Travel companies like Pelago (by Singapore Airlines) resolve queries in under 30 seconds, reduce support tickets by 60 %, and offer round-the-clock support. Additionally, Microsoft’s WhatsApp Travel Chatbot claims 99 % booking accuracy, delivering real-time updates, multilingual assistance, and seamless hotel and flight bookings.
AI-Driven Travel Experience Personalization Market Challenges
-
Bias in AI algorithms limits personalization effectiveness and may reinforce stereotypes in travel recommendations, impacting user trust.
The nature of AI models they can only be as good as the data they are fed If historical data is biased towards certain destinations, accommodation types, or types of travelers, then AI may only perpetuate these biases in its output. Consequently, the recommendations become biased and might not cater to diverse traveler requirements. For example, suggestions for the niche travel groups may be not appropriate or travel options with niche purpose may get less visibility. To solve this needs non-stop auditing and comprehensive data. Not doing so may erode, reputational damage, and regulatory scrutiny which makes it difficult for AI to be deployed in sensitive use cases for personalization.
A 2024 OECD/G7 policy paper on “Artificial Intelligence and Tourism” highlights serious risks of AI without inclusive data oversight, algorithms can create skewed or exclusionary personalization, underscoring the need for robust consumer protection and auditing protocols.
AI-Driven Travel Experience Personalization Market Segment Analysis
By Component, software segment dominates the AI-Driven Travel Experience Personalization Market, while the services segment is expected to grow fastest
The software segment dominated the AI-Driven Travel Experience Personalization Market with a 69% revenue share in 2024 due to its ability to offer scalable, flexible, and real-time solutions across booking, itinerary planning, and customer support functions. Travel providers heavily invest in AI-based platforms and applications that automate personalization, increase conversion rates, and enhance user satisfaction across multiple devices, enabling seamless integration with existing enterprise systems.
The services segment is projected to grow at the fastest CAGR of 24.21% from 2025 to 2032, driven by the increasing demand for AI consulting, system integration, and managed services among travel companies. As firms adopt complex AI tools, they rely more on specialized service providers to ensure successful deployment, customization, and ongoing optimization of personalized travel experiences, particularly across customer-facing interfaces and backend analytics systems.
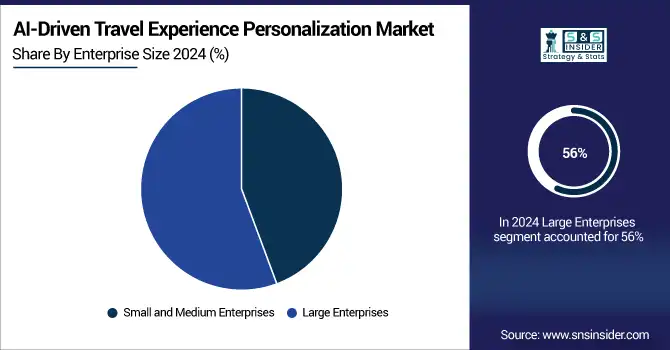
By Enterprise Size, Large enterprises lead the market due to higher AI adoption and infrastructure. SMEs are projected to grow fastest
Large enterprises dominated the AI-Driven Travel Experience Personalization Market with a 56% revenue share in 2024 because of their strong technological infrastructure and higher AI adoption budgets. These organizations prioritize advanced personalization to enhance customer retention, streamline operations, and improve brand competitiveness. Their global scale also allows them to leverage AI across diverse markets and customer segments, creating measurable returns from AI-driven personalization strategies.
Small and medium enterprises are expected to grow at the fastest CAGR of 23.42% from 2025 to 2032, as cloud-based and low-code AI tools become more accessible. These businesses increasingly adopt AI-driven personalization to compete with larger players, enhance customer engagement, and offer niche travel experiences. Affordable, scalable solutions enable SMEs to deliver targeted, data-driven services without heavy infrastructure investments, boosting their growth in the personalization market.
By Application, Flight booking holds the highest revenue share, Recommendation engines are expected to grow fastest
Flight booking held the highest revenue share of 22% in 2024 in the AI-Driven Travel Experience Personalization Market, owing to the high volume of transactions and increasing consumer demand for dynamic pricing, seat customization, and predictive travel assistance. Airlines and travel aggregators deploy AI tools to optimize fare suggestions, enhance booking speed, and deliver tailored promotions, significantly enhancing conversion and loyalty.
Recommendation engines are expected to grow at the fastest CAGR of 23.44% from 2025 to 2032, fueled by rising expectations for hyper-personalized travel suggestions based on user behavior, preferences, and real-time contextual data. As travelers seek more meaningful and curated experiences, AI-powered engines are becoming central to delivering destination, accommodation, and activity recommendations, improving engagement and satisfaction across travel apps and platforms.
By End-User, Online travel platforms dominate the market and are expected to grow fastest
Online travel platforms accounted for the highest revenue share of about 29% in 2024 and are expected to grow at the fastest CAGR of 24.32% from 2025 to 2032 due to their role as centralized ecosystems for planning, booking, and managing travel. These platforms leverage AI to deliver hyper-personalized user experiences, real-time updates, and dynamic pricing. Their global reach, large user bases, and integration with multiple services make them ideal for deploying scalable AI-driven personalization tools that enhance engagement and booking conversions.
By Deployment Mode, Cloud-based deployment leads the market and is projected to grow fastest
The cloud-based segment dominated the AI-Driven Travel Experience Personalization Market with a 75% revenue share in 2024 and is projected to grow at a CAGR of 22.76% from 2025 to 2032, driven by its low-cost deployment, scalability, and accessibility across geographies. Travel providers prefer cloud infrastructure to integrate AI solutions quickly without heavy hardware investment. Cloud systems support real-time data processing and seamless service delivery across devices, making them ideal for delivering continuous, adaptive personalization throughout the traveler’s journey.
AI-Driven Travel Experience Personalization Market Regional Analysis
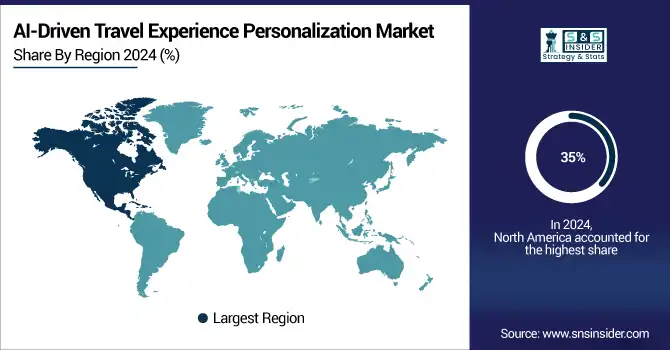
North America AI-Driven Travel Experience Personalization Market Insights
North America dominated the AI-Driven Travel Experience Personalization Market with a 35% revenue share in 2024 due to its mature digital infrastructure, high consumer demand for personalized services, and strong presence of leading travel tech companies. Early adoption of AI tools across airlines, OTAs, and hospitality chains, combined with significant investment in innovation and data analytics, has positioned the region at the forefront of personalized travel experiences.
Notably, nearly 75% of North American airlines report actively training their own AI models compared to just 28% globally underscoring the region’s leadership in AI-driven personalization technologies.
The United States is dominating the AI-Driven Travel Experience Personalization Market due to advanced digital infrastructure, high AI adoption, and major travel tech company presence.
Asia Pacific AI-Driven Travel Experience Personalization Market Insights
Asia Pacific is expected to grow at the fastest CAGR of 24.98% from 2025 to 2032, driven by rapid digital transformation, rising smartphone penetration, and increasing disposable income among a growing middle-class traveler base.
Mobile connections in China reached 1.87 billion in early 2025 equivalent to 132% of its population highlighting the region’s strong foundation for mobile-first travel services. Governments and travel providers across countries like China, India, and Southeast Asia are investing heavily in AI and cloud infrastructure.
For instance, in December 2024, Malaysia launched its National AI Office with a 5-year roadmap and attracted major investments from Amazon, Google, and Microsoft, totaling nearly RM 71.1 billion in data centers and cloud services. These initiatives are solidifying Asia Pacific as a key hotspot for AI-driven travel personalization growth in the coming years.
China is dominating the AI-Driven Travel Experience Personalization Market in Asia Pacific due to its massive traveler base, AI innovation leadership, and strong digital ecosystem.
Europe AI-Driven Travel Experience Personalization Market Insights
Europe is a significant player in the AI-Driven Travel Experience Personalization Market, driven by widespread digital adoption, strong tourism infrastructure, and supportive regulations. Countries like the UK, Germany, and France are leading innovation in personalized travel through AI integration. The United Kingdom is dominating the AI-Driven Travel Experience Personalization Market in Europe due to strong tech adoption, a mature travel sector, and high digital spending.
Since mid-2024, the UK has attracted an average of USD 256 million per day in private AI investment, totaling over USD 17.9 B in just 48 hours following the launch of the government's AI Opportunities Action Plan further reinforcing its leadership in AI infrastructure and personalized travel technology
The United Kingdom is dominating the AI-Driven Travel Experience Personalization Market in Europe due to strong tech adoption, mature travel sector, and high digital spending.
Middle East & Africa and Latin America AI-Driven Travel Experience Personalization Market Insights
The Middle East & Africa and Latin America are emerging markets in AI-Driven Travel Experience Personalization, driven by rising tourism, smartphone penetration, and digital investments. Regional players are adopting AI to enhance traveler engagement and improve service personalization.
Get Customized Report as per Your Business Requirement - Enquiry Now
AI-Driven Travel Experience Personalization Market Competitive Landscape:
Expedia Group
Expedia Group, founded in 1996 and headquartered in Seattle, USA, is a leading online travel platform providing booking services for flights, hotels, vacation rentals, and experiences worldwide. The company leverages AI, machine learning, and data analytics to enhance travel planning, personalization, and customer engagement. Expedia focuses on delivering seamless, real-time travel experiences by integrating advanced technologies into its platform, enabling users to efficiently discover, plan, and book trips while optimizing convenience and personalization.
-
2024: Expedia launched Romie, an AI travel buddy that plans, shops, books, and monitors trips in real time via group-chat integration and adaptive itinerary updates.
-
2025: Expedia introduced Trip Matching, a GenAI tool that transforms Instagram Reels into personalized travel recommendations and itineraries, integrating with OpenAI and Microsoft Copilot for enhanced trip discovery.
Booking Holdings / Booking.com
Booking Holdings, founded in 1996 and headquartered in Norwalk, USA, operates Booking.com and other travel platforms, providing hotel reservations, flights, car rentals, and vacation packages worldwide. The company emphasizes digital innovation, personalized recommendations, and AI-driven tools to streamline travel planning. By leveraging advanced analytics and user data, Booking Holdings enhances booking efficiency, customer engagement, and trip satisfaction while supporting travelers with easy-to-use platforms that simplify the entire journey from planning to booking.
-
October 2024: Booking.com introduced Smart Filter, Property Q&A, and Review Summaries, simplifying trip planning with AI-powered features.
Airbnb
Airbnb, founded in 2008 and headquartered in San Francisco, USA, is a global online marketplace for short-term lodging, vacation rentals, and experiences. The company focuses on personalized travel experiences, community-driven accommodations, and innovative technology integration. Airbnb leverages AI and data analytics to improve customer service, optimize bookings, and enhance user engagement, providing travelers with seamless experiences and hosts with tools to manage properties effectively while expanding its platform across global markets.
-
August 2025: Airbnb launched an AI agent built on 13 different models to enhance customer service within its app.
Trip.com Group
Trip.com Group, headquartered in Shanghai, China, is a leading online travel service provider offering flights, hotels, tours, and corporate travel solutions globally. The company emphasizes AI-driven personalization, mobile convenience, and real-time travel assistance to enhance customer experiences. Trip.com Group integrates advanced technologies into its platform to facilitate efficient trip planning, booking, and itinerary management, supporting both leisure and business travelers with innovative tools tailored to individual preferences.
-
August 2025: Trip.com unveiled an AI-powered trip planner to help travelers build personalized trips.
Sabre Corporation
Sabre Corporation, founded in 1960 and headquartered in Southlake, Texas, USA, provides technology solutions for the global travel industry, including airlines, hotels, and travel agencies. Sabre specializes in booking, reservation, and distribution systems, leveraging AI and agentic platforms to automate travel services at scale. Its solutions enhance efficiency, accuracy, and personalization, enabling industry partners to optimize operations, improve customer engagement, and deliver seamless travel experiences through intelligent automation and integrated software platforms.
-
2025: Sabre introduced comprehensive agentic APIs for AI-powered shopping, booking, and servicing in the travel sector.
Google Travel
Google Travel, part of Alphabet Inc., headquartered in Mountain View, California, USA, provides search, booking, and planning tools for flights, hotels, and vacation packages. Google Travel integrates AI and machine learning to deliver personalized recommendations, real-time pricing alerts, and itinerary management, simplifying trip planning for users worldwide. The platform focuses on predictive analytics, seamless user experience, and AI-driven automation to help travelers make informed decisions and optimize both time and cost when planning trips.
-
May 2025: Google introduced an AI-powered itinerary planner and hotel price drop alerts to enhance travel planning.
Key Players
AI-Driven Travel Experience Personalization Market Companies are
-
Expedia Group
-
Booking Holdings
-
Airbnb
-
Trip.com Group
-
Amadeus IT Group
-
Sabre Corporation
-
Travelport
-
Google Travel
-
IBM
-
Microsoft
-
TravelPerk
-
Kayak
-
Skyscanner
-
Trivago
-
Priceline
-
Hopper
-
Cleartrip
-
MakeMyTrip
-
OYO
-
CWT
| Report Attributes | Details |
|---|---|
| Market Size in 2024 | USD 3.61 Billion |
| Market Size by 2032 | USD 18.01 Billion |
| CAGR | CAGR of 22.34% From 2025 to 2032 |
| Base Year | 2024 |
| Forecast Period | 2025-2032 |
| Historical Data | 2021-2023 |
| Report Scope & Coverage | Market Size, Segments Analysis, Competitive Landscape, Regional Analysis, DROC & SWOT Analysis, Forecast Outlook |
| Key Segments | • By Component (Software, Services) • By Application (Flight Booking, Hotel Booking, Trip Planning, Customer Support, Recommendation Engines, Others) • By Deployment Mode (Cloud, On-Premises) • By End-User (Travel Agencies, Airlines, Hotels & Resorts, Online Travel Platforms, Others) • By Enterprise Size (Small and Medium Enterprises, Large Enterprises) |
| Regional Analysis/Coverage | North America (US, Canada, Mexico), Europe (Germany, France, UK, Italy, Spain, Poland, Turkey, Rest of Europe), Asia Pacific (China, India, Japan, South Korea, Singapore, Australia, Rest of Asia Pacific), Middle East & Africa (UAE, Saudi Arabia, Qatar, South Africa, Rest of Middle East & Africa), Latin America (Brazil, Argentina, Rest of Latin America) |
| Company Profiles | Expedia Group, Booking Holdings, Airbnb, Trip.com Group, Amadeus IT Group, Sabre Corporation, Travelport, Google Travel, IBM, Microsoft, TravelPerk, Kayak, Skyscanner, Trivago, Priceline, Hopper, Cleartrip, MakeMyTrip, OYO, CWT |
Get in Touch
