Analytics as a Service Market Key Insights:
To Get More Information on Analytics as a Service (AaaS) Market - Request Sample Report
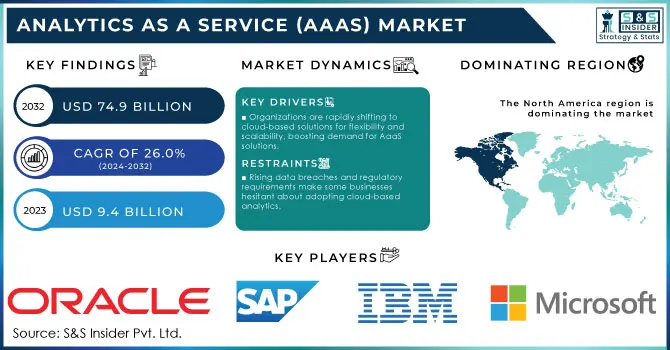
The Analytics as a Service (AaaS) Market size was valued at USD 9.4 Billion in 2023 and is expected to reach USD 74.9 Billion by 2032 and growing at a CAGR of 26.0% over the forecast period of 2024-2032.
The Analytics as a Service (AaaS) market is witnessing significant growth, driven by increasing governmental emphasis on data-driven decision-making and digital transformation initiatives across various sectors. For instance, according to a recent report by the U.S. Bureau of Economic Analysis (BEA), government spending on information technology grew by 7% in 2023, aimed at enhancing data analytics capabilities in public institutions. This aligns with global efforts, as per the OECD's 2023 report, where 60% of member countries have allocated increased funding to advanced analytics solutions to support data transparency and efficiency in public services. Furthermore, the European Commission’s Digital Strategy aims to ensure that 75% of European businesses use cloud-based services, big data, and artificial intelligence (AI) by 2030, a move expected to further bolster the AaaS market. The rising demand for real-time analytics and the push for regulatory compliance highlighted by GDPR in Europe and HIPAA in the U.S. also drive adoption across sectors. According to the U.S. Bureau of Labor Statistics, over 90% of large-scale firms are anticipated to have implemented advanced data analytics capabilities by 2025, underscoring the central role of AaaS in the global economy.
At the same time, leveraging advanced technologies for better data democratization tends to open up a large opportunity for the Analytics as a Service (AaaS) market. AaaS providers enable access to more data and insights, allowing next-generation solutions that empower organization members of all stripes to make data-driven decisions. This technology enables the creation of intuitive applications that allow non-technical users to engage with data in a meaningful way, such as interactive chatbots that deliver clear explanations and visual representations.
Additionally, it can automate various processes, retain insights over time, and perform actions based on user-defined parameters, simplifying data analysis and decision-making. The ability to convert data into multiple languages and formats also improves global sharing capabilities while identifying and reducing biases in data to ensure fair and impartial insights. This transformative strategy aligns with the increasing demand for democratized data access, propelling the evolution and expansion of the AaaS market. Recent research indicates that a significant portion of Chief Marketing Officers are already leveraging these technologies, underscoring their value and swift adoption across sectors. The recognition of their impact on market research, particularly in generating insights, highlights their role as a crucial tool for gaining a competitive advantage. Furthermore, their effectiveness in collecting diverse data sets, organizing extensive datasets, and uncovering hidden patterns within complex information emphasizes their potential to drive innovation and growth in the analytics sector.
Market Dynamics
Drivers
-
Organizations are rapidly shifting to cloud-based solutions for flexibility and scalability, boosting demand for AaaS solutions.
-
Businesses are prioritizing data insights to enhance operational efficiency and customer experience, driving adoption of AaaS platforms.
-
The rise in IoT devices and Big Data generation requires advanced analytics solutions, fueling the growth of AaaS offerings.
The rapid development of cloud computing solutions is one of the key factors that drives the growth of analytics as a service market. Organizations from different industries are moving towards cloud-based platforms for their scalability, flexibility, and cost efficiency. One recent report estimated that global spending for public cloud systems is expected to hit $600 billion in 2023, indicating a clear ongoing shift toward the use of cloud technologies.
A major factor is that businesses now have to process huge amounts of data efficiently and derive real-time insights. For instance, a recent survey indicated that 90% of executives reported that their organizations are prioritizing digital transformation initiatives, with data analytics being a critical component. For instance, leader companies like Netflix and Amazon have successfully increased the numbers that help you use cloud analytics to improve customer experience and optimize operations. A common use case for AaaS is Netflix the streaming giant that assesses viewer data to provide tailored recommendations as well as develop content based on user taste preference. Additionally, the AaaS model provides flexibility to scale analytics in line with business needs without having to deal with complex on-premises infrastructure. AaaS adoption has been steady for several years, as organizations increasingly understand the benefits of cloud-based analytics to drive data-driven decision-making and more recently work from home policies heightened the need.
Restraints
-
Rising data breaches and regulatory requirements make some businesses hesitant about adopting cloud-based analytics.
-
For smaller companies, the cost of implementing and maintaining AaaS solutions can be a financial constraint.
The data privacy and security issues related to cloud-based solutions are an important restraint for Analytics as a Service (AaaS) market across the globe. With the growing adoption of AaaS, organizations are shifting towards using AaaS to handle and analyze this critical and sensitive data; with this shift comes a higher risk associated with data breaches and unauthorized access. The prevalence of cyberattacks and stringent regulations, such as GDPR and CCPA, have made businesses wary of transferring critical data to the cloud. Organizations are concerned about the potential for data leaks, loss of control over sensitive information, and the implications of non-compliance with data protection laws. As a result, many companies are apprehensive about the adoption of AaaS solutions and would rather resort to on-premises analytics systems as they feel they have more control over their data security. As a result, the risk of data integrity and privacy breaches is one of the major reasons that AaaS has not seen widespread adoption in heavily regulated industries like finance and healthcare.
Segment Analysis
By Organizational Size
In 2023, the Large Enterprises segment accounted for a large share 72% of revenue in the AaaS market. Large corporations that operate with a more complex structure have gradually been adopting analytic solutions to gain competitive benefits. Based on the 2023 U.S. Census Bureau data, there are indications that 80% of large enterprises now consider analytics part of their core business strategy due to government policies aiding digitalization efforts in large corporations. Those enterprises look to extract maximum value out of operational efficiency, decision-making, and customer engagement by harnessing the power of advanced analytics.
By Component
The solution segment held the largest share about 63% in 2023, due to its application in data management and insights generation. On the other hand, the services segment is projected to grow at the highest CAGR during the forecast period as they require a high degree of specialized expertise and managed analytics services. As the 2023 U.S. Government Accountability Office (GAO) report defines, nearly half of public sector organizations are planning to spend more on analytics-related professional services to gain better data-driven insights and operational efficiency.
By Industry
In 2023, the Banking, Financial Services and Insurance (BFSI) sector held the largest share of about 22%. The substantial adoption rate in BFSI is largely due to the sector’s prioritization of risk management, fraud detection, and personalized customer services all of which heavily rely on analytics solutions. Further government data, including the 2022 report from the Federal Reserve, shows that financial organizations are experiencing a greater quantity of regulatory rules than before and that more than 60% of U.S.-based banks have enhanced their investment in analytics solutions to stay compliant with laws and regulations. The push towards digitization in this sector supported by government schemes is undoubtedly one of the major reasons for this dominant position in the market.
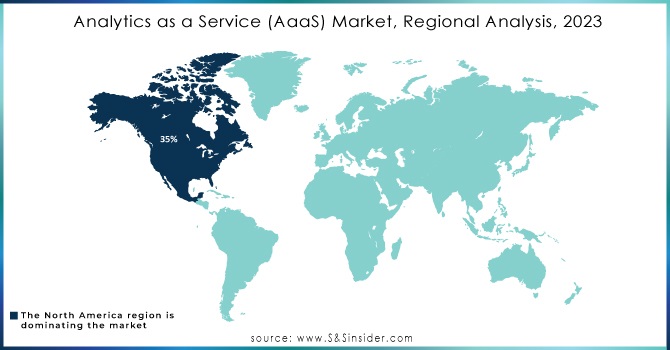
Regional Analysis
North America dominated the market which captured over 35% of global Analytics as a Service (AaaS) market in 2023. The widespread adoption of analytics solutions across industries, specifically among technology and financial firms, can be attributed to this dominance. Statistics Canada data and U.S. Bureau of Economic Analysis figures show North American companies have consistently ranked among the largest consumers of analytics services. This trend is heavily supported by federal and local policies that emphasize digital transformation initiatives, giving decision-makers easier access to data science solutions and integrating advanced analytics deeper into organizations.
The Asia-Pacific region is expected to achieve the fastest compound annual growth rate (CAGR) in the forecast period. Several government initiatives also drive this growth, including India Digital India. These aim to strengthen the digital landscape by increasing access to cloud computing and analytics services. AaaS solutions are gaining tremendous traction with businesses in the region due to China’s strategic push toward artificial intelligence and data-driven technologies. Both public and private sector services will be promoted through these initiatives, which in turn are expected to spur considerable growth and innovation throughout the Asia-Pacific region by driving up demand for cloud-based analytics services.
Do You Need any Customization Research on Analytics as a Service (AaaS) Market - Inquire Now
Recent News and Developments
-
In April 2024, The U.S. Department of Commerce introduced a $500 million data modernization grant program that would help businesses upgrade analytics capabilities.
-
Supporting generative AI, cloud computing, and accelerated processing for healthcare and life sciences organizations through the expanded Microsoft-NVIDIA partnership announced in March 2024. It pairs the global scale and security of Microsoft Azure with NVIDIA DGX Cloud and the suite of tools needed to develop accelerated computing applications for healthcare, aka the NVIDIA Clara suite. Stability AI also furthered its partnership with Amazon to give global startups, academics, and businesses access to its open-source tools and models.
-
Azure Stream Analytics upgraded its no-code editor with better handling of input data and defined window parameters, as well as debugging functionalities and support for complex queries in January 2024. With these updates, users can access an easy experience for streaming data processing pipelines for cloud analytics applications.
Key Players
Key Service Providers/Manufacturers:
-
IBM (IBM Watson Analytics, IBM Cognos Analytics)
-
Microsoft (Power BI, Azure Synapse Analytics)
-
SAP (SAP Analytics Cloud, SAP BusinessObjects)
-
Oracle (Oracle Analytics Cloud, Oracle BI)
-
Google Cloud (BigQuery, Looker)
-
Tableau (Tableau Online, Tableau Server)
-
SAS (SAS Visual Analytics, SAS Viya)
-
Qlik (Qlik Sense, QlikView)
-
Domo (Domo Business Cloud, Domo Data Apps)
-
Snowflake (Snowflake Data Cloud, Snowpipe)
Users of Analytics as a Service
-
Wells Fargo
-
JPMorgan Chase
-
Amazon
-
Netflix
-
Procter & Gamble
-
Coca-Cola
-
Unilever
-
Delta Air Lines
-
Pfizer
-
Ford Motor Company
| Report Attributes | Details |
|---|---|
| Market Size in 2023 | USD 9.4 Billion |
| Market Size by 2032 | USD 74.9 Billion |
| CAGR | CAGR of 26.0% From 2024 to 2032 |
| Base Year | 2023 |
| Forecast Period | 2024-2032 |
| Historical Data | 2020-2022 |
| Report Scope & Coverage | Market Size, Segments Analysis, Competitive Landscape, Regional Analysis, DROC & SWOT Analysis, Forecast Outlook |
| Key Segments | • By Component (Solution, Services) • By Data Type (Structured, Unstructured) • By Analytics Type (Predictive, Diagnostic, Descriptive, Prescriptive) • By Enterprise Type (Large Enterprises, Small & Medium Enterprises) • By Industry (BFSI, IT & Telecommunication, Retail & E-commerce, Manufacturing, Transportation & Logistics, Government & Public Sector, Others) |
| Regional Analysis/Coverage | North America (US, Canada, Mexico), Europe (Eastern Europe [Poland, Romania, Hungary, Turkey, Rest of Eastern Europe] Western Europe] Germany, France, UK, Italy, Spain, Netherlands, Switzerland, Austria, Rest of Western Europe]), Asia Pacific (China, India, Japan, South Korea, Vietnam, Singapore, Australia, Rest of Asia Pacific), Middle East & Africa (Middle East [UAE, Egypt, Saudi Arabia, Qatar, Rest of Middle East], Africa [Nigeria, South Africa, Rest of Africa], Latin America (Brazil, Argentina, Colombia, Rest of Latin America) |
| Company Profiles | IBM, Microsoft, SAP, Oracle, Google Cloud, Tableau, SAS, Qlik, Domo, Snowflake |
| Key Drivers | • Organizations are rapidly shifting to cloud-based solutions for flexibility and scalability, boosting demand for AaaS solutions. • Businesses are prioritizing data insights to enhance operational efficiency and customer experience, driving adoption of AaaS platforms. |
| RESTRAINTS | • Rising data breaches and regulatory requirements make some businesses hesitant about adopting cloud-based analytics. |
Frequently Asked Questions
Ans. Analytics as a service is a deployment model in which a third-party vendor provides analytical solutions through a cloud platform. This allows organizations to access advanced analytics tools and infrastructure without having to invest in expensive on-premise solutions.
Ans: The Analytics as a Service Market size was valued at US$ 9.4 billion in 2023.
Ans: The Analytics as a Service Market is to grow at a CAGR of 26.0% Over the Forecast Period 2024-2032.
Ans: The solutions component segment dominated the Analytics as a Service (AaaS) Market.
Ans: The North American region dominated the Analytics as a Service (AaaS) Market in 2023.
Get in Touch
