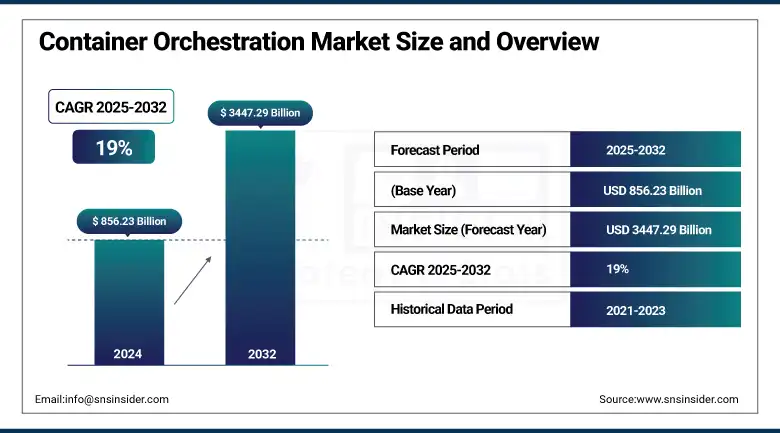
The Container Orchestration Market size was valued at USD 856.23 billion in 2024 and is projected to reach USD 3447.29 billion by 2032, growing at a CAGR of 19% from 2025 to 2032.
Its scale and digital transformation are indirectly impacting healthcare and IT infrastructure. With pharmaceutical firms and healthcare organisations increasingly using digital technologies to handle data-rich drug development and distribution, the demand for scalable, automated, and secure IT systems increases. This trend is driving demand for container orchestration platforms that help simplify deployment, enhance system reliability, and enable regulatory compliance across intricate, cloud-native healthcare landscapes.
According to resources 87% see significant value in leveraging cloud analytics for improved clinical trial design, pricing strategies, and fraud detection.
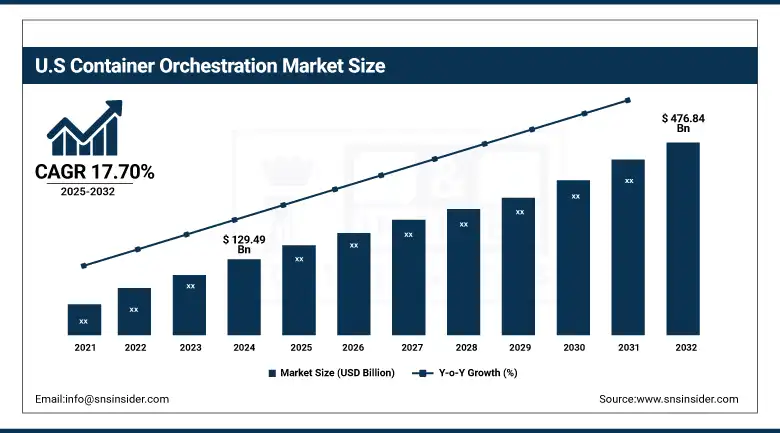
The U.S Container Orchestration Market reached USD 129.49 billion in 2024 and is expected to reach USD 476.84 billion by the end of 2032 at a CAGR of 17.70% from 2025 to 2032.
The strong growth is fueled by the extensive use of microservices, DevOps, and hybrid cloud strategies in large industries. The U.S. leads the world in terms of market share because of its sophisticated IT infrastructure, high rate of cloud adoption, and robust presence of major players like Google, Amazon, and Red Hat, which promotes ongoing innovation in orchestration technologies.
Drivers
Surging demand for hybrid and multi-cloud deployments accelerates adoption of container orchestration platforms
The increasing complexity of IT landscapes has driven companies towards hybrid and multi-cloud strategies to enhance scalability, flexibility, and resilience. Container orchestration facilitates effective application management across such infrastructures, enhancing operational agility. Top platforms such as Kubernetes are being extended with AI-based automation for real-time resource provisioning. Recent innovation includes Google's integration of Gemini AI into GKE and Red Hat OpenShift's edge-oriented enhancements, signaling a wider industry trend towards smart orchestration in distributed environments.
Restraints
Security and compliance challenges in containerized ecosystems hinder widespread adoption of orchestration solutions
Though advantageous, containers present new threats with their distributed and dynamic nature. Workload security, identity and access management, and meeting worldwide regulations continue to be top challenges. Security and compliance challenges are often exacerbated by inconsistent visibility across diverse container orchestration tools used within enterprise ecosystems. With the advent of container security platforms like Aqua Security and Sysdig, lack of end-to-end, standardized security frameworks is hindering adoption and necessitating cautious approaches to implementation.
Opportunities
Integration with edge computing opens new frontiers for orchestrated application deployment across remote environments
Edge computing is picking up momentum with the increasing demand for edge processing of data. Edge container orchestration facilitates handling light payloads near the end-users, reducing latency and bandwidth consumption. Vendors now optimize platforms for edge deployments like K3s from Rancher for low-resource environments. This creates huge opportunities in manufacturing, healthcare, and logistics sectors where uptime and real-time insights are paramount. Integration with edge computing is expanding the capabilities of container orchestration technologies by enabling lightweight deployments in latency-sensitive environments.
Challenges
Lack of skilled professionals restricts the effective implementation of advanced orchestration architectures
Container orchestration platform deployment and management known for its specialized skills in DevOps, networking, and cloud-native technologies. A talent shortage is an ongoing issue, though. Most organizations are unable to scale their container projects because of inadequate in-house talent. Efforts to provide training are in overdrive, with entities such as CNCF and cloud vendors developing certifications and learning platforms.
By Component
The platform segment accounted a 56.27% revenue share in 2024 due to the rampant adoption of Kubernetes and other orchestration platforms. Businesses are trusting these solutions for simplified container management, automated deployments, and improved scalability. Container orchestration market companies such as Google, AWS, and Red Hat are introducing advanced features that support enterprise-level scalability and security. These features add to platform supremacy, particularly in enterprise use cases where scalability and reliability matter.
The services segment is expanding at the fastest CAGR of 20.26% during the forecasting period as there is rising demand for managed services, consulting, and training. Organizations are collaborating with vendors such as Accenture, IBM, and Capgemini for smooth orchestration deployment and lifecycle management. With the increased complexity in orchestration solutions, the importance of expert-driven services in ensuring successful implementation, ongoing optimization, and cost management becomes more pivotal, particularly for digitally transforming businesses.
By Organization Size
Large enterprises held a 46.42% revenue share in 2024, utilizing container orchestration to streamline high-scale deployments across hybrid and multi-cloud environments. Their emphasis on microservices-based architectures, DevOps pipelines, and real-time analytics necessitates scalable and fault-tolerant orchestration platforms. Industry giants Microsoft and IBM continue to fine-tune their products to these requirements, including improved automation, policy management, and integration with enterprise-level security frameworks ensuring their place in large business environments.
SMEs are experiencing fastest growth at a CAGR of 18.58% due to growing adoption of streamlined orchestration solutions and cloud services. The cost-friendly distributions of Docker Swarm and K3s provide an economic on-ramp for these organizations. Vendors aim at this space with cost-friendly, simple-to-deploy offerings, and managed orchestration services reduce the technical hurdle. These trends enable SMEs to enhance application deployment responsiveness, lower infrastructure expenses, and stay ahead in dynamic markets.
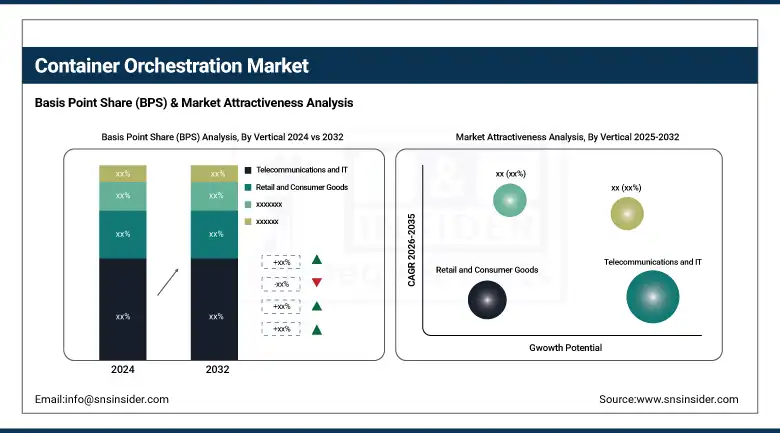
By Vertical
Telecom and IT accounted for a 19.98% share in 2024, led by the trend toward network function virtualization and 5G rollout. Orchestration platforms enable fast service provisioning, minimize operational overhead, and enhance network agility. Vendors such as Ericsson and Cisco are integrating orchestration capabilities into telecom infrastructure offerings. With data-intensive workloads and continuous innovation cycles, this industry requires agile deployment mechanisms, and hence, orchestration technologies are pivotal to digital network transformation.
The retail and consumer goods industry is expected to advance at a CAGR of 20.47%, indicative of increasing investment in e-commerce sites, automated supply chains, and customized experiences. Orchestration facilitates dynamic scaling of applications to manage seasonal traffic and accommodates integration with customer analytics solutions. Retailers such as Walmart and Target are utilizing containerized microservices for omnichannel capabilities.
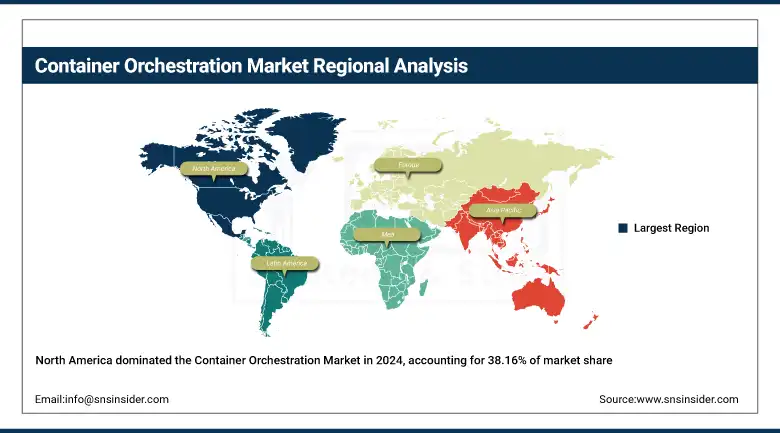
North America held a 38.16% container orchestration market share in 2024 due to the region's dominance in cloud adoption and digital innovation. The U.S. and Canadian enterprises are quickly adopting DevOps and microservices patterns, backed by robust cloud-native ecosystems. Key players like AWS, Microsoft Azure, and Google Cloud are headquartered here and keep upgrading their orchestration services with AI and security-centric features. Robust R&D activity and enterprise IT investments further support the region's dominance.
United States dominates the region because it has a superior cloud infrastructure, early Kubernetes adoption, and leadership in AI-driven orchestration platforms via AWS and Google Cloud.
Europe is observing steady growth in container orchestration fueled by industry-wide digital transformation, robust data regulations, and rising cloud investment. Western European nations are adopting orchestration as part of cybersecurity and edge computing to provide safe, scalable deployment of applications, particularly in financial services, healthcare, and governments.
Germany is leading the region through high enterprise cloud adoption, a rise in the number of containerized projects across automotive and manufacturing, and alliances with global orchestration platform providers.
Asia Pacific is the fastest growing region in the market with 19.89% CAGR, for container orchestration based on swift digital transformation, modernization of SMEs, and high demand for scalable cloud-native applications. Nations such as India, China, and Australia are investing heavily in hybrid cloud and microservices-based development environments, and this contributes immensely to container orchestration adoption.
China leads through strong cloud infrastructure, huge digital innovation across industries, and inorganic investment by local tech players such as Alibaba Cloud and Tencent Cloud in container orchestration technology.
Middle East & Africa and Latin America are experiencing increasing adoption of container orchestration, fueled by digital government programs, smart city initiatives, cloud infrastructure growth, and modernization in industries such as banking, logistics, oil & gas, and public services.
The major key players of Container Orchestration Market are, Kubernetes, Docker, Red Hat, AWS, Google, Microsoft, Rancher Labs, Hashicorp, Cisco, Oracle and others.
In April 2025, researchers introduced KubeFence, a security framework that enhances Kubernetes by reducing its attack surface through fine-grained API filtering, outperforming traditional RBAC in threat prevention.
In January 2025, Microsoft announced plans to invest approximately $80 billion in AI-enabled data centers for fiscal year 2025, with over half allocated to U.S. projects. This investment aimed to bolster the company's AI infrastructure to meet the growing demand for AI and cloud-based applications.
Report Attributes | Details |
---|---|
Market Size in 2024 | USD 856.23 Million |
Market Size by 2032 | USD 3447.29 Million |
CAGR | CAGR of 19.0% From 2025 to 2032 |
Base Year | 2024 |
Forecast Period | 2025-2032 |
Historical Data | 2021-2023 |
Report Scope & Coverage | Market Size, Segments Analysis, Competitive Landscape, Regional Analysis, DROC & SWOT Analysis, Forecast Outlook |
Key Segments | By Component (Platform, Services) By Organization Size (Small and Medium-sized Enterprises (SMEs), Large Enterprises) By Vertical (Telecommunications and IT, BFSI, Government and Public Sector, Healthcare, Retail and Consumer Goods, Manufacturing, Others) |
Regional Analysis/Coverage | North America (US, Canada, Mexico), Europe (Germany, France, UK, Italy, Spain, Poland, Turkey, Rest of Europe), Asia Pacific (China, India, Japan, South Korea, Singapore, Australia, Rest of Asia Pacific), Middle East & Africa (UAE, Saudi Arabia, Qatar, South Africa, Rest of Middle East & Africa), Latin America (Brazil, Argentina, Rest of Latin America) |
Company Profiles | Kubernetes, Docker, Red Hat, AWS, Google, Microsoft, Rancher Labs, Hashicorp, Cisco, Oracle |
Ans: The market was valued at USD 856.23 billion in 2024, with strong growth expected due to increasing cloud-native and hybrid IT deployments.
Ans: The platform segment led with 56.27% revenue share in 2024, due to Kubernetes adoption and enterprise demand for automated container management.
Ans: The sector is projected to grow at a CAGR of 20.47%, due to investments in e-commerce, supply chain automation, and omnichannel experiences.
Ans: North America held a 38.16% market share in 2024, driven by early Kubernetes adoption and dominant cloud providers.
Ans: Healthcare and pharmaceuticals are key drivers, needing secure, scalable systems to manage complex, data-rich drug development and distribution environments.
Table of Contents
1. Introduction
1.1 Market Definition
1.2 Scope (Inclusion and Exclusions)
1.3 Research Assumptions
2. Executive Summary
2.1 Market Overview
2.2 Regional Synopsis
2.3 Competitive Summary
3. Research Methodology
3.1 Top-Down Approach
3.2 Bottom-up Approach
3.3. Data Validation
3.4 Primary Interviews
4. Market Dynamics Impact Analysis
4.1 Market Driving Factors Analysis
4.1.1 Drivers
4.1.2 Restraints
4.1.3 Opportunities
4.1.4 Challenges
4.2 PESTLE Analysis
4.3 Porter’s Five Forces Model
5. Statistical Insights and Trends Reporting
5.1 Orchestration Platform Downtime Metrics
5.2 Compliance Readiness Impact
5.3 Container Lifecycle Automation Level
5.4 Time to Production (TTP)
6. Competitive Landscape
6.1 List of Major Companies, By Region
6.2 Market Share Analysis, By Region
6.3 Product Benchmarking
6.3.1 Product specifications and features
6.3.2 Pricing
6.4 Strategic Initiatives
6.4.1 Marketing and promotional activities
6.4.2 Distribution and Supply Chain Strategies
6.4.3 Expansion plans and new Product launches
6.4.4 Strategic partnerships and collaborations
6.5 Technological Advancements
6.6 Market Positioning and Branding
7. Container Orchestration Market Segmentation By Component
7.1 Chapter Overview
7.2 Platform
7.2.1 Platform Market Trends Analysis (2020-2032)
7.2.2 Platform Market Size Estimates and Forecasts to 2032 (USD Million)
7.3 Services
7.3.1 Services Market Trends Analysis (2020-2032)
7.3.2 Services Market Size Estimates and Forecasts to 2032 (USD Million)
8. Container Orchestration Market Segmentation By Organization Size
8.1 Chapter Overview
8.2 Small and Medium-sized Enterprises (SMEs)
8.2.1 Small and Medium-sized Enterprises (SMEs) Market Trend Analysis (2020-2032)
8.2.2 Small and Medium-sized Enterprises (SMEs) Market Size Estimates and Forecasts to 2032 (USD Million)
8.3 Large Enterprises
8.3.1 Large Enterprises Market Trends Analysis (2020-2032)
8.3.2 Large Enterprises Market Size Estimates and Forecasts to 2032 (USD Million)
9. Container Orchestration Market Segmentation By Vertical
9.1 Chapter Overview
9.2 Telecommunications and IT
9.2.1 Telecommunications and IT Market Trends Analysis (2020-2032)
9.2.2 Telecommunications and IT Market Size Estimates and Forecasts to 2032 (USD Million)
9.3 BFSI
9.3.1 BFSI Market Trends Analysis (2020-2032)
9.3.2 BFSI Market Size Estimates and Forecasts to 2032 (USD Million)
9.4 Government and Public Sector
9.4.1 Government and Public Sector Market Trends Analysis (2020-2032)
9.4.2 Government and Public Sector Market Size Estimates and Forecasts to 2032 (USD Million)
9.5 Healthcare
9.5.1 Healthcare Market Trends Analysis (2020-2032)
9.5.2 Healthcare Market Size Estimates and Forecasts to 2032 (USD Million)
9.6 Retail and Consumer Goods
9.6.1 Retail and Consumer Goods Market Trends Analysis (2020-2032)
9.6.2 Retail and Consumer Goods Market Size Estimates and Forecasts to 2032 (USD Million)
9.6 Manufacturing
9.6.1 Manufacturing Market Trends Analysis (2020-2032)
9.6.2 Manufacturing Market Size Estimates and Forecasts to 2032 (USD Million)
9.6 Others
9.6.1 Others Market Trends Analysis (2020-2032)
9.6.2 Others Market Size Estimates and Forecasts to 2032 (USD Million)
10. Regional Analysis
10.1 Chapter Overview
10.2 North America
10.2.1 Trends Analysis
10.2.2 North America Container Orchestration Market Estimates and Forecasts, by Country (2020-2032) (USD Million)
10.2.3 North America Container Orchestration Market Estimates and Forecasts, By Component (2020-2032) (USD Million)
10.2.4 North America Container Orchestration Market Estimates and Forecasts, By Organization Size (2020-2032) (USD Million)
10.2.5 North America Container Orchestration Market Estimates and Forecasts, By Vertical (2020-2032) (USD Million)
10.2.6 USA
10.2.6.1 USA Container Orchestration Market Estimates and Forecasts, By Component (2020-2032) (USD Million)
10.2.6.2 USA Container Orchestration Market Estimates and Forecasts, By Organization Size (2020-2032) (USD Million)
10.2.6.3 USA Container Orchestration Market Estimates and Forecasts, By Vertical (2020-2032) (USD Million)
10.2.7 Canada
10.2.7.1 Canada Container Orchestration Market Estimates and Forecasts, By Component (2020-2032) (USD Million)
10.2.7.2 Canada Container Orchestration Market Estimates and Forecasts, By Organization Size (2020-2032) (USD Million)
10.2.7.3 Canada Container Orchestration Market Estimates and Forecasts, By Vertical (2020-2032) (USD Million)
10.2.8 Mexico
10.2.8.1 Mexico Container Orchestration Market Estimates and Forecasts, By Component (2020-2032) (USD Million)
10.2.8.2 Mexico Container Orchestration Market Estimates and Forecasts, By Organization Size (2020-2032) (USD Million)
10.2.8.3 Mexico Container Orchestration Market Estimates and Forecasts, By Vertical (2020-2032) (USD Million)
10.3 Europe
10.3.1 Trends Analysis
10.3.2 Europe Container Orchestration Market Estimates and Forecasts, by Country (2020-2032) (USD Million)
10.3.3 Europe Container Orchestration Market Estimates and Forecasts, By Component (2020-2032) (USD Million)
10.3.4 Europe Container Orchestration Market Estimates and Forecasts, By Organization Size (2020-2032) (USD Million)
10.3.5 Europe Container Orchestration Market Estimates and Forecasts, By Vertical (2020-2032) (USD Million)
10.3.6 Germany
10.3.1.6.1 Germany Container Orchestration Market Estimates and Forecasts, By Component (2020-2032) (USD Million)
10.3.1.6.2 Germany Container Orchestration Market Estimates and Forecasts, By Organization Size (2020-2032) (USD Million)
10.3.1.6.3 Germany Container Orchestration Market Estimates and Forecasts, By Vertical (2020-2032) (USD Million)
10.3.7 France
10.3.7.1 France Container Orchestration Market Estimates and Forecasts, By Component (2020-2032) (USD Million)
10.3.7.2 France a Container Orchestration Market Estimates and Forecasts, By Organization Size (2020-2032) (USD Million)
10.3.7.3 France Container Orchestration Market Estimates and Forecasts, By Vertical (2020-2032) (USD Million)
10.3.8 UK
10.3.8.1 UK Container Orchestration Market Estimates and Forecasts, By Component (2020-2032) (USD Million)
10.3.8.2 UK Container Orchestration Market Estimates and Forecasts, By Organization Size (2020-2032) (USD Million)
10.3.8.3 UK Container Orchestration Market Estimates and Forecasts, By Vertical (2020-2032) (USD Million)
10.3.9 Italy
10.3.9.1 Italy Container Orchestration Market Estimates and Forecasts, By Component (2020-2032) (USD Million)
10.3.9.2 Italy Container Orchestration Market Estimates and Forecasts, By Organization Size (2020-2032) (USD Million)
10.3.9.3 Italy Container Orchestration Market Estimates and Forecasts, By Vertical (2020-2032) (USD Million)
10.3.10 Spain
10.3.10.1 Spain Container Orchestration Market Estimates and Forecasts, By Component (2020-2032) (USD Million)
10.3.10.2 Spain Container Orchestration Market Estimates and Forecasts, By Organization Size (2020-2032) (USD Million)
10.3.10.3 Spain Container Orchestration Market Estimates and Forecasts, By Vertical (2020-2032) (USD Million)
10.3.12 Poland
10.3.12.1 Poland Container Orchestration Market Estimates and Forecasts, by Country (2020-2032) (USD Million)
10.3.12.1 Poland Container Orchestration Market Estimates and Forecasts, By Component (2020-2032) (USD Million)
10.3.12.3 Poland Container Orchestration Market Estimates and Forecasts, By Organization Size (2020-2032) (USD Million)
10.3.12.3 Poland Container Orchestration Market Estimates and Forecasts, By Vertical (2020-2032) (USD Million)
10.3.13 Turkey
10.3.13.1 Turkey Container Orchestration Market Estimates and Forecasts, By Component (2020-2032) (USD Million)
10.3.13.2 Turkey Container Orchestration Market Estimates and Forecasts, By Organization Size (2020-2032) (USD Million)
10.3.13.3 Turkey Container Orchestration Market Estimates and Forecasts, By Vertical (2020-2032) (USD Million)
10.3.14 Rest of Europe
10.3.14.1 Rest of Europe Container Orchestration Market Estimates and Forecasts, By Component (2020-2032) (USD Million)
10.3.14.2 Rest of Europe Container Orchestration Market Estimates and Forecasts, By Organization Size (2020-2032) (USD Million)
10.3.14.3 Rest of Europe Container Orchestration Market Estimates and Forecasts, By Vertical (2020-2032) (USD Million)
10.4 Asia-Pacific
10.4.1 Trends Analysis
10.4.2 Asia-Pacific Container Orchestration Market Estimates and Forecasts, by Country (2020-2032) (USD Million)
10.4.3 Asia-Pacific Container Orchestration Market Estimates and Forecasts, By Component (2020-2032) (USD Million)
10.4.4 Asia-Pacific Container Orchestration Market Estimates and Forecasts, By Organization Size (2020-2032) (USD Million)
10.4.5 Asia-Pacific Container Orchestration Market Estimates and Forecasts, By Vertical (2020-2032) (USD Million)
10.4.6 China
10.4.6.1 China Container Orchestration Market Estimates and Forecasts, By Component (2020-2032) (USD Million)
10.4.6.2 China Container Orchestration Market Estimates and Forecasts, By Organization Size (2020-2032) (USD Million)
10.4.6.3 China Container Orchestration Market Estimates and Forecasts, By Vertical (2020-2032) (USD Million)
10.4.7 India
10.4.7.1 India Container Orchestration Market Estimates and Forecasts, By Component (2020-2032) (USD Million)
10.4.7.2 India Container Orchestration Market Estimates and Forecasts, By Organization Size (2020-2032) (USD Million)
10.4.7.3 India Container Orchestration Market Estimates and Forecasts, By Vertical (2020-2032) (USD Million)
10.4.8 Japan
10.4.8.1 Japan Container Orchestration Market Estimates and Forecasts, By Component (2020-2032) (USD Million)
10.4.8.2 Japan Container Orchestration Market Estimates and Forecasts, By Organization Size (2020-2032) (USD Million)
10.4.8.3 Japan Container Orchestration Market Estimates and Forecasts, By Vertical (2020-2032) (USD Million)
10.4.9 South Korea
10.4.9.1 South Korea Container Orchestration Market Estimates and Forecasts, By Component (2020-2032) (USD Million)
10.4.9.2 South Korea Container Orchestration Market Estimates and Forecasts, By Organization Size (2020-2032) (USD Million)
10.4.9.3 South Korea Container Orchestration Market Estimates and Forecasts, By Vertical (2020-2032) (USD Million)
10.4.10 Singapore
10.4.10.1 Singapore Container Orchestration Market Estimates and Forecasts, By Component (2020-2032) (USD Million)
10.4.10.2 Singapore Container Orchestration Market Estimates and Forecasts, By Organization Size (2020-2032) (USD Million)
10.4.10.3 Singapore Container Orchestration Market Estimates and Forecasts, By Vertical (2020-2032) (USD Million)
10.4.11 Australia
10.4.11.1 Australia Container Orchestration Market Estimates and Forecasts, By Component (2020-2032) (USD Million)
10.4.11.2 Australia Container Orchestration Market Estimates and Forecasts, By Organization Size (2020-2032) (USD Million)
10.4.11.3 Australia Container Orchestration Market Estimates and Forecasts, By Vertical (2020-2032) (USD Million)
10.4.12 Taiwan
10.4.12.1 Taiwan Container Orchestration Market Estimates and Forecasts, By Component (2020-2032) (USD Million)
10.4.12.2 Taiwan Container Orchestration Market Estimates and Forecasts, By Organization Size (2020-2032) (USD Million)
10.4.12.3 Taiwan Container Orchestration Market Estimates and Forecasts, By Vertical (2020-2032) (USD Million)
10.4.13 Rest of Asia-Pacific
10.4.13.1 Rest of Asia-Pacific Container Orchestration Market Estimates and Forecasts, By Component (2020-2032) (USD Million)
10.4.13.2 Rest of Asia-Pacific Container Orchestration Market Estimates and Forecasts, By Organization Size (2020-2032) (USD Million)
10.4.13.3 Rest of Asia-Pacific Container Orchestration Market Estimates and Forecasts, By Vertical (2020-2032) (USD Million)
10.5 Middle East and Africa
10.5.1 Trends Analysis
10.5.2 Middle East and Africa East Container Orchestration Market Estimates and Forecasts, by Country (2020-2032) (USD Million)
10.5.3Middle East and Africa Container Orchestration Market Estimates and Forecasts, By Component (2020-2032) (USD Million)
10.5.4 Middle East and Africa Container Orchestration Market Estimates and Forecasts, By Organization Size (2020-2032) (USD Million)
10.5.5 Middle East and Africa Container Orchestration Market Estimates and Forecasts, By Vertical (2020-2032) (USD Million)
10.5.6 UAE
10.5.6.1 UAE Container Orchestration Market Estimates and Forecasts, By Component (2020-2032) (USD Million)
10.5.6.2 UAE Container Orchestration Market Estimates and Forecasts, By Organization Size (2020-2032) (USD Million)
10.5.6.3 UAE Container Orchestration Market Estimates and Forecasts, By Vertical (2020-2032) (USD Million)
10.5.7 Saudi Arabia
10.5.7.1 Saudi Arabia Container Orchestration Market Estimates and Forecasts, By Component (2020-2032) (USD Million)
10.5.7.2 Saudi Arabia Container Orchestration Market Estimates and Forecasts, By Organization Size (2020-2032) (USD Million)
10.5.7.3 Saudi Arabia Container Orchestration Market Estimates and Forecasts, By Vertical (2020-2032) (USD Million)
10.5.8 Qatar
10.5.8.1 Qatar Container Orchestration Market Estimates and Forecasts, By Component (2020-2032) (USD Million)
10.5.8.2 Qatar Container Orchestration Market Estimates and Forecasts, By Organization Size (2020-2032) (USD Million)
10.5.8.3 Qatar Container Orchestration Market Estimates and Forecasts, By Vertical (2020-2032) (USD Million)
10.5.9 South Africa
10.5.9 1 South Africa Container Orchestration Market Estimates and Forecasts, By Component (2020-2032) (USD Million)
10.5.9 2 South Africa Container Orchestration Market Estimates and Forecasts By Organization Size (2020-2032) (USD Million)
10.5.9 3 South Africa Container Orchestration Market Estimates and Forecasts, By Vertical (2020-2032) (USD Million)
10.5.10 Rest of Middle East & Africa
10.5.10.1 Rest of Middle East & Africa Container Orchestration Market Estimates and Forecasts, By Component (2020-2032) (USD Million)
10.5.10.2 Rest of Middle East & Africa Container Orchestration Market Estimates and Forecasts, By Organization Size (2020-2032) (USD Million)
10.5.10.3 Rest of Middle East & Africa Container Orchestration Market Estimates and Forecasts, By Vertical (2020-2032) (USD Million)
10.6 Latin America
10.6.1 Trends Analysis
10.6.2 Latin America Container Orchestration Market Estimates and Forecasts, by Country (2020-2032) (USD Million)
10.6.3 Latin America Container Orchestration Market Estimates and Forecasts, By Component (2020-2032) (USD Million)
10.6.4 Latin America Container Orchestration Market Estimates and Forecasts, By Organization Size (2020-2032) (USD Million)
10.6.5 Latin America Container Orchestration Market Estimates and Forecasts, By Vertical (2020-2032) (USD Million)
10.6.6 Brazil
10.6.6.1 Brazil Container Orchestration Market Estimates and Forecasts, By Component (2020-2032) (USD Million)
10.6.6.2 Brazil Container Orchestration Market Estimates and Forecasts, By Organization Size (2020-2032) (USD Million)
10.6.6.3 Brazil Container Orchestration Market Estimates and Forecasts, By Vertical (2020-2032) (USD Million)
10.6.7 Argentina
10.6.7.1 Argentina Container Orchestration Market Estimates and Forecasts, By Component (2020-2032) (USD Million)
10.6.7.2 Argentina Container Orchestration Market Estimates and Forecasts, By Organization Size (2020-2032) (USD Million)
10.6.7.3 Argentina Container Orchestration Market Estimates and Forecasts, By Vertical (2020-2032) (USD Million)
10.6.8 Rest of Latin America
10.6.8.1 Rest of Latin America Container Orchestration Market Estimates and Forecasts, By Component (2020-2032) (USD Million)
10.6.8.2 Rest of Latin America Container Orchestration Market Estimates and Forecasts, By Organization Size (2020-2032) (USD Million)
10.6.8.3 Rest of Latin America Container Orchestration Market Estimates and Forecasts, By Vertical (2020-2032) (USD Million)
11. Company Profiles
11.1 Kubernetes
11.1.1 Company Overview
11.1.2 Financial
11.1.3 Product/ Services Offered
11.1.4 SWOT Analysis
11.2 Docker
11.2.1 Company Overview
11.2.2 Financial
11.2.3 Product/ Services Offered
11.2.4 SWOT Analysis
11.3 Red Hat
11.3.1 Company Overview
11.3.2 Financial
11.3.3 Product/ Services Offered
11.3.4 SWOT Analysis
11.4 AWS
11.4.1 Company Overview
11.4.2 Financial
11.4.3 Product/ Services Offered
11.4.4 SWOT Analysis
11.5 Google
11.5.1 Company Overview
11.5.2 Financial
11.5.3 Product/ Services Offered
11.5.4 SWOT Analysis
11.6 Microsoft
11.6.1 Company Overview
11.6.2 Financial
11.6.3 Product/ Services Offered
11.6.4 SWOT Analysis
11.7 Rancher Labs
11.7.1 Company Overview
11.7.2 Financial
11.7.3 Product/ Services Offered
11.7.4 SWOT Analysis
11.8 Hashicorp
11.8.1 Company Overview
11.8.2 Financial
11.8.3 Product/ Services Offered
11.8.4 SWOT Analysis
11.9 Cisco
11.9.1 Company Overview
11.9.2 Financial
11.9.3 Product/ Services Offered
11.9.4 SWOT Analysis
11.10 Oracle
11.10.1 Company Overview
11.10.2 Financial
11.10.3 Product/ Services Offered
11.10.4 SWOT Analysis
12. Use Cases and Best Practices
13. Conclusion
An accurate research report requires proper strategizing as well as implementation. There are multiple factors involved in the completion of good and accurate research report and selecting the best methodology to compete the research is the toughest part. Since the research reports we provide play a crucial role in any company’s decision-making process, therefore we at SNS Insider always believe that we should choose the best method which gives us results closer to reality. This allows us to reach at a stage wherein we can provide our clients best and accurate investment to output ratio.
Each report that we prepare takes a timeframe of 350-400 business hours for production. Starting from the selection of titles through a couple of in-depth brain storming session to the final QC process before uploading our titles on our website we dedicate around 350 working hours. The titles are selected based on their current market cap and the foreseen CAGR and growth.
The 5 steps process:
Step 1: Secondary Research:
Secondary Research or Desk Research is as the name suggests is a research process wherein, we collect data through the readily available information. In this process we use various paid and unpaid databases which our team has access to and gather data through the same. This includes examining of listed companies’ annual reports, Journals, SEC filling etc. Apart from this our team has access to various associations across the globe across different industries. Lastly, we have exchange relationships with various university as well as individual libraries.
Step 2: Primary Research
When we talk about primary research, it is a type of study in which the researchers collect relevant data samples directly, rather than relying on previously collected data. This type of research is focused on gaining content specific facts that can be sued to solve specific problems. Since the collected data is fresh and first hand therefore it makes the study more accurate and genuine.
We at SNS Insider have divided Primary Research into 2 parts.
Part 1 wherein we interview the KOLs of major players as well as the upcoming ones across various geographic regions. This allows us to have their view over the market scenario and acts as an important tool to come closer to the accurate market numbers. As many as 45 paid and unpaid primary interviews are taken from both the demand and supply side of the industry to make sure we land at an accurate judgement and analysis of the market.
This step involves the triangulation of data wherein our team analyses the interview transcripts, online survey responses and observation of on filed participants. The below mentioned chart should give a better understanding of the part 1 of the primary interview.
Part 2: In this part of primary research the data collected via secondary research and the part 1 of the primary research is validated with the interviews from individual consultants and subject matter experts.
Consultants are those set of people who have at least 12 years of experience and expertise within the industry whereas Subject Matter Experts are those with at least 15 years of experience behind their back within the same space. The data with the help of two main processes i.e., FGDs (Focused Group Discussions) and IDs (Individual Discussions). This gives us a 3rd party nonbiased primary view of the market scenario making it a more dependable one while collation of the data pointers.
Step 3: Data Bank Validation
Once all the information is collected via primary and secondary sources, we run that information for data validation. At our intelligence centre our research heads track a lot of information related to the market which includes the quarterly reports, the daily stock prices, and other relevant information. Our data bank server gets updated every fortnight and that is how the information which we collected using our primary and secondary information is revalidated in real time.
Step 4: QA/QC Process
After all the data collection and validation our team does a final level of quality check and quality assurance to get rid of any unwanted or undesired mistakes. This might include but not limited to getting rid of the any typos, duplication of numbers or missing of any important information. The people involved in this process include technical content writers, research heads and graphics people. Once this process is completed the title gets uploader on our platform for our clients to read it.
Step 5: Final QC/QA Process:
This is the last process and comes when the client has ordered the study. In this process a final QA/QC is done before the study is emailed to the client. Since we believe in giving our clients a good experience of our research studies, therefore, to make sure that we do not lack at our end in any way humanly possible we do a final round of quality check and then dispatch the study to the client.
Key Segments:
By Component
Platform
Services
By Organization Size
Small and Medium-sized Enterprises (SMEs)
Large Enterprises
By Vertical
Telecommunications and IT
BFSI
Government and Public Sector
Healthcare
Retail and Consumer Goods
Manufacturing
Others
Request for Segment Customization as per your Business Requirement: Segment Customization Request
Regional Coverage:
North America
US
Canada
Mexico
Europe
Germany
France
UK
Italy
Spain
Poland
Turkey
Rest of Europe
Asia Pacific
China
India
Japan
South Korea
Singapore
Australia
Rest of Asia Pacific
Middle East & Africa
UAE
Saudi Arabia
Qatar
South Africa
Rest of Middle East & Africa
Latin America
Brazil
Argentina
Rest of Latin America
Request for Country Level Research Report: Country Level Customization Request
Available Customization
With the given market data, SNS Insider offers customization as per the company’s specific needs. The following customization options are available for the report:
Detailed Volume Analysis
Criss-Cross segment analysis (e.g. Product X Application)
Competitive Product Benchmarking
Geographic Analysis
Additional countries in any of the regions
Customized Data Representation
Detailed analysis and profiling of additional market players
The Sports Analytics Market Size was valued at USD 3.53 billion in 2023 and is witnessed to reach USD 20.48 billion by 2032 and grow at a CAGR of 22.51% over the forecast period 2024-2032.
The Computer Aided Engineering Market was valued at USD 9.4 Billion in 2023 and is expected to reach USD 23.6 Billion by 2032, growing at a CAGR of 10.80% from 2024-2032.
The Digital Rights Management Market size was USD 4.9 Billion in 2023, will reach to USD 15.2 Billion by 2032 and grow at a CAGR of 14% by 2024-2032.
The Cloud AI Market was valued at USD 59.6 billion in 2023 and is expected to reach USD 847.8 Billion by 2032, growing at a CAGR of 34.34% from 2024-2032.
Hybrid Cloud Market was valued at USD 96.78 billion in 2023 and is expected to reach USD 405.62 billion by 2032, growing at a CAGR of 17.31% by 2032.
The Analytics as a Service (AaaS) Market size was valued at USD 9.4 Billion in 2023 and is expected to reach USD 74.9 Billion by 2032 and growing at a CAGR of 26.0% over the forecast period of 2024-2032.
Hi! Click one of our member below to chat on Phone