image

Artificial Turf Market Report Scope & Overview:

Artificial Turf Market Revenue Analysis

Get More Information on Artificial Turf Market - Request Sample Report

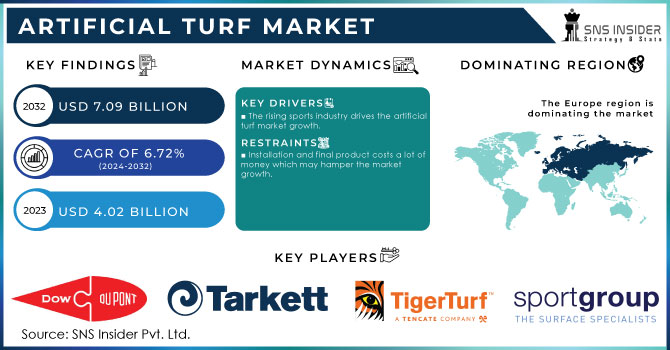
The Artificial Turf Market Size was valued at USD 4.02 billion in 2023 and is expected to reach USD 7.09 billion by 2032 and grow at a CAGR of 6.72% over the forecast period 2024-2032.

The increasing popularity of artificial turf in sports fields and playgrounds can be attributed to its strong resistance and long-lasting quality. Crafted to withstand significant foot traffic and harsh weather conditions, contemporary synthetic turf can last some years. This durability makes it a money-saving choice for extended use, decreasing the necessity for frequent replacements.

According to the U.S. Environmental Protection Agency data shows that artificial turf decreases the necessity of lawn chemicals, consequently reducing the environmental footprint during its lifetime. Furthermore, the EPA points out that using fake grass in public areas helps achieve notable water conservation, especially in areas susceptible to drought.

Moreover, the increasing demand for artificial turf is largely due to its contribution to water conservation, particularly in dry regions or places with limited water resources. Artificial turf eliminates the need for frequent watering, resulting in noteworthy water conservation compared to real grass. This environmental advantage is especially important in areas where saving water is a top concern.

In 2023, Tarkett Sports launched a new collection of synthetic turf known as "Ecocept," featuring recycled materials and reduced water usage during manufacturing. This advancement is in line with worldwide sustainability objectives and offers extra water-saving advantages when implemented.

Furthermore, contemporary synthetic grass is created to imitate natural grass in both appearance and texture, giving a green, lush look all year. The visual attractiveness of something increases the desire for it in residential landscaping and commercial uses.

Market Dynamics:

Drivers

The rising sports industry drives the artificial turf market growth.

The rising popularity of sports like soccer, American football, and baseball has greatly increased the need for artificial turf, particularly in stadiums and training centers. Sports organizations prefer artificial turf because of its uniform surface quality, guaranteeing a consistent playing experience and lowering the chances of injuries from uneven ground. Moreover, artificial turf is extremely durable, and able to handle intense usage and various weather conditions, making it crucial for facilities that hold regular games and training sessions. It is a cost-effective option for sports facilities due to its low maintenance needs in comparison to natural grass. Artificial turf has become the preferred playing surface for numerous sports organizations worldwide due to a combination of factors and advancements in turf technology that improve player safety and performance.

For instance, in 2023, AstroTurf launched an updated model of its RootZone 3D3 system, merging innovative fiber technology with a patented infill layer. This advancement enhances impact cushioning and energy rebound, making it well-suited for American football and baseball fields. The system's increasing popularity is evident in its installation in many college and professional stadiums throughout the U.S.

Restrain

Installation and final product costs a lot of money which may hamper the market growth.

The significant obstacle to the widespread use of artificial turf is the high initial investment and ongoing maintenance expenses. The cost of installing artificial turf is significant, including payments for ground preparation, drainage setups, specific tools, and the turf material. Smaller sports facilities, schools, or residential projects with constrained budgets may find these expenses especially challenging. Moreover, despite the cost savings and reduced water usage that comes with artificial turf, some potential buyers are deterred by the initial high cost if they lack the necessary capital. Even following installation, there may be expenses linked to fixing, changing infill materials, and regular maintenance, increasing the total financial load. The high initial costs of artificial turf create a financial obstacle that prevents its wider adoption beyond those who can afford it, despite its numerous advantages.

Market segmentation

By Material

Polyethylene, materials held the largest market share market and held a share of around 43.45% in 2023. It dominates the artificial turf industry's market because of its excellent mix of strength, adaptability, and safety. Polyethylene fibers have high durability and are perfect for heavily used spaces such as sports fields and playgrounds. They provide a gentler, more organic sensation in contrast to materials like nylon, resulting in increased player satisfaction and decreased chances of abrasions from falling. Furthermore, the UV resistance of polyethylene guarantees that the artificial grass will retain its color and quality, even when exposed to sunlight for extended periods. Manufacturers and consumers both prefer polyethylene, making it the dominant choice in the artificial turf market due to these characteristics.
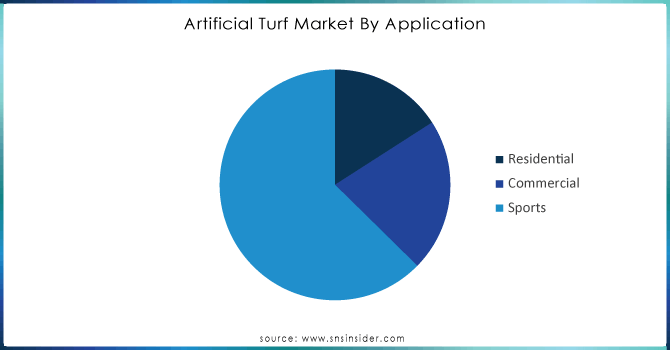
By Application

In the application segment sports segment held the largest market share around 62.63% in 2023. The growing interest in different sports, such as soccer, American football, and baseball, has led to a high demand for artificial turf in stadiums, training centers, and sports complexes. Sports organizations choose artificial turf over natural grass for its even playing surface, longevity, and reduced upkeep expenses. It is perfect for sports applications due to its durability and ability to withstand harsh weather conditions, ensuring a safe and reliable surface for athletes. The increasing popularity of professional and amateur sports leagues globally is driving the demand for artificial turf in the sports industry, making it the leading application segment in the market.

Artificial-Turf-Market-By-Application

Get Customized Report as per your Business Requirement - Request For Customized Report
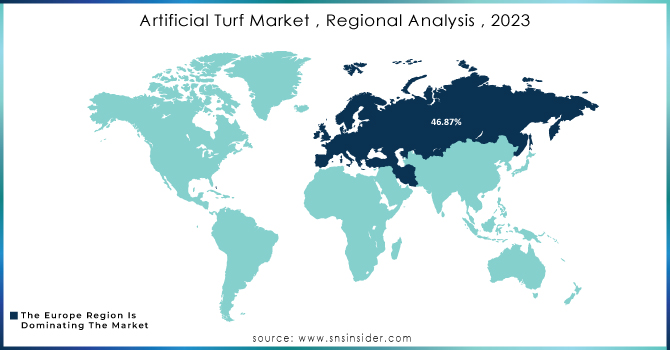
Regional Analysis:

Europe held the largest market share in the artificial turf market about 46.87% in 2023. This dominance can be attributed to the well-developed industrial base, and the market for Artificial Turf thrives alongside domestic industrial growth. Specific sectors within North America are experiencing particularly explosive growth. The communication industry is a prime example. Fueled by continuous technological advancements and significant investments in communication infrastructure, this sector is driving a surge in demand for Artificial Turf.

Asia Pacific is the fastest-growing region in the artificial turf market. With the growth of urban areas, the need for low-maintenance and water-efficient options like artificial turf is increasing to improve public areas and commercial properties. Furthermore, the growing sports scene in the area, along with major funding for stadiums and sports facilities, continues to fuel the need for top-notch synthetic turf. Government actions supporting sustainable development and water conservation are also driving the growth of the Asia-Pacific artificial turf market, making it a dynamic and quickly expanding sector in the global industry.

Artificial-Turf-Market--Regional-Analysis--2023

Key Players

Dow dupont, Sport Group, Tigerturf, Matrix Turf, Tarkett, Shaw Industries, Victoria PLC, Controlled Products, ACT Globall, SIS Pitches, and other players.

Recent Development:

  • In 2024, Polytan launched the new Polytan LigaTurf collection, with a focus on eco-friendly materials and improved safety features for sports purposes. The company additionally made investments in modernizing its production plants in Germany to integrate new technologies and enhance manufacturing efficiency.

  • In 2023, Shaw Sports Turf introduced the Shaw Sports Turf Prestige series, which includes enhanced fiber technology for better durability and player comfort. The company invested in improving its manufacturing capacity in the U.S. and Asia to meet the growing global demand.

Artificial Turf Market Report Scope:

Report Attributes Details
Market Size in 2023 US$ 4.02 Billion
Market Size by 2032 US$ 7.09 Billion
CAGR CAGR of 6.72% From 2024 to 2032
Base Year 2023
Forecast Period 2024-2032
Historical Data 2020-2022
Report Scope & Coverage Market Size, Segments Analysis, Competitive  Landscape, Regional Analysis, DROC & SWOT Analysis, Forecast Outlook
Key Segments • By Material (Polyamides, Polypropylene, Polyethylene, Nylon, Sand Plant Infill Material)
• By Application (Residential, Commercial, Sports)
Regional Analysis/Coverage North America (USA, Canada, Mexico), Europe
(Germany, UK, France, Italy, Spain, Netherlands,
Rest of Europe), Asia-Pacific (Japan, South Korea,
China, India, Australia, Rest of Asia-Pacific), The
Middle East & Africa (Israel, UAE, South Africa,
Rest of Middle East & Africa), Latin America (Brazil, Argentina, Rest of Latin America)
Company Profiles Dow dupont, Sport Group, Tigerturf, Matrix Turf, Tarkett, Shaw Industries, Victoria PLC, Controlled Products, ACT Globall, SIS Pitches, and other players.
DRIVERS • The rising sports industry drives the artifical turf market growth. 
Restraints
• Installation and final product costs a lot of money which may hamper the market growth.
 

Frequently Asked Questions

Ans: Manufacturers, Consultant, aftermarket players, association, Research institute, private and universities libraries, suppliers and distributors of the product.


Ans: We are constantly monitoring and updating reports on the political and economic unrest caused by Russia's invasion of Ukraine. Negative consequences are expected globally, particularly in Eastern Europe, the European Union, Eastern and Central Asia, and the United States. This dispute has had a significant impact on people's lives and livelihoods, as well as causing significant trade disruptions. The world economy is anticipated to suffer as a result of the prolonged war and uncertainty in Eastern Europe, with Russia bearing the brunt of the consequences in the long run.


Ans: COVID-19 is a global public health concern that has affected almost every firm, and its long-term consequences are expected to have an impact on industry growth during the forecast period. Our ongoing research is aimed at improving our research methodology in order to address the most pressing COVID-19 issues and potential solutions. COVID-19 is being studied in light of changes in supply chain rerouting, market dynamics, purchasing patterns, consumer behaviour and demand,  government involvement COVID-19's impact on the market is examined in this which includes insights, estimates, and forecasts, revised report, analyses.

Ans: High cost of turf, The installation and final product costs a lot of money and Technical limitations of the product are the restraints for Artificial Turf Market.

Ans: The Artificial Turf Market Size was valued at USD 4.02 billion in 2023, and is expected to reach USD 7.09 billion by 2032, and grow at a CAGR of 6.72% over the forecast period 2024-2032. 


Table of Content

1. Introduction

1.1 Market Definition

1.2 Scope (Inclusion and Exclusions)

1.3 Research Assumptions

2. Executive Summary

2.1 Market Overview

2.2 Regional Synopsis

2.3 Competitive Summary

3. Research Methodology

3.1 Top-Down Approach

3.2 Bottom-up Approach

3.3. Data Validation

3.4 Primary Interviews

4. Market Dynamics Impact Analysis

4.1 Market Driving Factors Analysis

4.1.2 Drivers

4.1.2 Restraints

4.1.3 Opportunities

4.1.4 Challenges

4.2 PESTLE Analysis

4.3 Porter’s Five Forces Model

5. Statistical Insights and Trends Reporting

5.1 Production Capacity and Utilization, by Country, by Type, 2023

5.2 Feedstock Prices, by Country, by Type, 2023

5.3   Regulatory Impact, by  Country, by Type, 2023.

5.4 Environmental Metrics: Emissions Data, Waste Management Practices, and     Sustainability Initiatives, by Region

5.5 Innovation and R&D, by Type 2023

6. Competitive Landscape

6.1 List of Major Companies, By Region

6.2 Market Share Analysis, By Region

6.3 Product Benchmarking

6.3.1 Product specifications and features

6.3.2 Pricing

6.4 Strategic Initiatives

6.4.1 Marketing and promotional activities

6.4.2 Distribution and supply chain strategies

6.4.3 Expansion plans and new Type launches

6.4.4 Strategic partnerships and collaborations

6.5 Technological Advancements

6.6 Market Positioning and Branding

7. Artificial Turf Market Segmentation, by Material

7.1 Chapter Overview

7.2 Polyamides

7.2.1 Polyamides Market Trends Analysis (2020-2032)

7.2.2 Polyamides Market Size Estimates and Forecasts to 2032 (USD Billion)

7.3 Polypropylene

7.3.1 Polypropylene Market Trends Analysis (2020-2032)

7.3.2 Polypropylene Market Size Estimates and Forecasts to 2032 (USD Billion)

7.4 Polyethylene

7.4.1 Polyethylene Market Trends Analysis (2020-2032)

7.4.2 Polyethylene Market Size Estimates and Forecasts to 2032 (USD Billion)

7.5 Nylon

7.5.1 Nylon Market Trends Analysis (2020-2032)

7.5.2 Nylon Market Size Estimates and Forecasts to 2032 (USD Billion)

7.6 Sand Plant Infill Material

7.6.1 Sand Plant Infill Material Market Trends Analysis (2020-2032)

7.6.2 Sand Plant Infill Material Market Size Estimates and Forecasts to 2032 (USD Billion)

8. Artificial Turf Market Segmentation, by Application

8.1 Chapter Overview

8.2 Residential

8.2.1 Residential Market Trends Analysis (2020-2032)

8.2.2 Residential Market Size Estimates and Forecasts to 2032 (USD Billion)

8.3 Commercial

8.3.1 Commercial Market Trends Analysis (2020-2032)

8.3.2 Commercial Market Size Estimates and Forecasts to 2032 (USD Billion)

8.4 Sports

8.4.1 Sports Market Trends Analysis (2020-2032)

8.4.2 Sports Market Size Estimates and Forecasts to 2032 (USD Billion)

9. Regional Analysis

9.1 Chapter Overview

9.2 North America

9.2.1 Trends Analysis

9.2.2 North America Artificial Turf Market Estimates and Forecasts, by Country (2020-2032) (USD Billion)

9.2.3 North America Artificial Turf Market Estimates and Forecasts, by Material (2020-2032) (USD Billion) 

9.2.4 North America Artificial Turf Market Estimates and Forecasts, by Application (2020-2032) (USD Billion)

9.2.5 USA

9.2.5.1 USA Artificial Turf Market Estimates and Forecasts, by Material (2020-2032) (USD Billion)

9.2.5.2 USA Artificial Turf Market Estimates and Forecasts, by Application (2020-2032) (USD Billion)

9.2.6 Canada

9.2.6.1 Canada Artificial Turf Market Estimates and Forecasts, by Material (2020-2032) (USD Billion)

9.2.6.2 Canada Artificial Turf Market Estimates and Forecasts, by Application (2020-2032) (USD Billion)

9.2.7 Mexico

9.2.7.1 Mexico Artificial Turf Market Estimates and Forecasts, by Material (2020-2032) (USD Billion)

9.2.7.2 Mexico Artificial Turf Market Estimates and Forecasts, by Application (2020-2032) (USD Billion)

9.3 Europe

9.3.1 Eastern Europe

9.3.1.1 Trends Analysis

9.3.1.2 Eastern Europe Artificial Turf Market Estimates and Forecasts, by Country (2020-2032) (USD Billion)

9.3.1.3 Eastern Europe Artificial Turf Market Estimates and Forecasts, by Material (2020-2032) (USD Billion) 

9.3.1.4 Eastern Europe Artificial Turf Market Estimates and Forecasts, by Application (2020-2032) (USD Billion)

9.3.1.5 Poland

9.3.1.5.1 Poland Artificial Turf Market Estimates and Forecasts, by Material (2020-2032) (USD Billion)

9.3.1.5.2 Poland Artificial Turf Market Estimates and Forecasts, by Application (2020-2032) (USD Billion)

9.3.1.6 Romania

9.3.1.6.1 Romania Artificial Turf Market Estimates and Forecasts, by Material (2020-2032) (USD Billion)

9.3.1.6.2 Romania Artificial Turf Market Estimates and Forecasts, by Application (2020-2032) (USD Billion)

9.3.1.7 Hungary

9.3.1.7.1 Hungary Artificial Turf Market Estimates and Forecasts, by Material (2020-2032) (USD Billion)

9.3.1.7.2 Hungary Artificial Turf Market Estimates and Forecasts, by Application (2020-2032) (USD Billion)

9.3.1.8 Turkey

9.3.1.8.1 Turkey Artificial Turf Market Estimates and Forecasts, by Material (2020-2032) (USD Billion)

9.3.1.8.2 Turkey Artificial Turf Market Estimates and Forecasts, by Application (2020-2032) (USD Billion)

9.3.1.9 Rest of Eastern Europe

9.3.1.9.1 Rest of Eastern Europe Artificial Turf Market Estimates and Forecasts, by Material (2020-2032) (USD Billion)

9.3.1.9.2 Rest of Eastern Europe Artificial Turf Market Estimates and Forecasts, by Application (2020-2032) (USD Billion)

9.3.2 Western Europe

9.3.2.1 Trends Analysis

9.3.2.2 Western Europe Artificial Turf Market Estimates and Forecasts, by Country (2020-2032) (USD Billion)

9.3.2.3 Western Europe Artificial Turf Market Estimates and Forecasts, by Material (2020-2032) (USD Billion) 

9.3.2.4 Western Europe Artificial Turf Market Estimates and Forecasts, by Application (2020-2032) (USD Billion)

9.3.2.5 Germany

9.3.2.5.1 Germany Artificial Turf Market Estimates and Forecasts, by Material (2020-2032) (USD Billion)

9.3.2.5.2 Germany Artificial Turf Market Estimates and Forecasts, by Application (2020-2032) (USD Billion)

9.3.2.6 France

9.3.2.6.1 France Artificial Turf Market Estimates and Forecasts, by Material (2020-2032) (USD Billion)

9.3.2.6.2 France Artificial Turf Market Estimates and Forecasts, by Application (2020-2032) (USD Billion)

9.3.2.7 UK

9.3.2.7.1 UK Artificial Turf Market Estimates and Forecasts, by Material (2020-2032) (USD Billion)

9.3.2.7.2 UK Artificial Turf Market Estimates and Forecasts, by Application (2020-2032) (USD Billion)

9.3.2.8 Italy

9.3.2.8.1 Italy Artificial Turf Market Estimates and Forecasts, by Material (2020-2032) (USD Billion)

9.3.2.8.2 Italy Artificial Turf Market Estimates and Forecasts, by Application (2020-2032) (USD Billion)

9.3.2.9 Spain

9.3.2.9.1 Spain Artificial Turf Market Estimates and Forecasts, by Material (2020-2032) (USD Billion)

9.3.2.9.2 Spain Artificial Turf Market Estimates and Forecasts, by Application (2020-2032) (USD Billion)

9.3.2.10 Netherlands

9.3.2.10.1 Netherlands Artificial Turf Market Estimates and Forecasts, by Material (2020-2032) (USD Billion)

9.3.2.10.2 Netherlands Artificial Turf Market Estimates and Forecasts, by Application (2020-2032) (USD Billion)

9.3.2.11 Switzerland

9.3.2.11.1 Switzerland Artificial Turf Market Estimates and Forecasts, by Material (2020-2032) (USD Billion)

9.3.2.11.2 Switzerland Artificial Turf Market Estimates and Forecasts, by Application (2020-2032) (USD Billion)

9.3.2.12 Austria

9.3.2.12.1 Austria Artificial Turf Market Estimates and Forecasts, by Material (2020-2032) (USD Billion)

9.3.2.12.2 Austria Artificial Turf Market Estimates and Forecasts, by Application (2020-2032) (USD Billion)

9.3.2.13 Rest of Western Europe

9.3.2.13.1 Rest of Western Europe Artificial Turf Market Estimates and Forecasts, by Material (2020-2032) (USD Billion)

9.3.2.13.2 Rest of Western Europe Artificial Turf Market Estimates and Forecasts, by Application (2020-2032) (USD Billion)

9.4 Asia Pacific

9.4.1 Trends Analysis

9.4.2 Asia Pacific Artificial Turf Market Estimates and Forecasts, by Country (2020-2032) (USD Billion)

9.4.3 Asia Pacific Artificial Turf Market Estimates and Forecasts, by Material (2020-2032) (USD Billion) 

9.4.4 Asia Pacific Artificial Turf Market Estimates and Forecasts, by Application (2020-2032) (USD Billion)

9.4.5 China

9.4.5.1 China Artificial Turf Market Estimates and Forecasts, by Material (2020-2032) (USD Billion)

9.4.5.2 China Artificial Turf Market Estimates and Forecasts, by Application (2020-2032) (USD Billion)

9.4.6 India

9.4.5.1 India Artificial Turf Market Estimates and Forecasts, by Material (2020-2032) (USD Billion)

9.4.5.2 India Artificial Turf Market Estimates and Forecasts, by Application (2020-2032) (USD Billion)

9.4.5 Japan

9.4.5.1 Japan Artificial Turf Market Estimates and Forecasts, by Material (2020-2032) (USD Billion)

9.4.5.2 Japan Artificial Turf Market Estimates and Forecasts, by Application (2020-2032) (USD Billion)

9.4.6 South Korea

9.4.6.1 South Korea Artificial Turf Market Estimates and Forecasts, by Material (2020-2032) (USD Billion)

9.4.6.2 South Korea Artificial Turf Market Estimates and Forecasts, by Application (2020-2032) (USD Billion)

9.4.7 Vietnam

9.4.7.1 Vietnam Artificial Turf Market Estimates and Forecasts, by Material (2020-2032) (USD Billion)

9.2.7.2 Vietnam Artificial Turf Market Estimates and Forecasts, by Application (2020-2032) (USD Billion)

9.4.8 Singapore

9.4.8.1 Singapore Artificial Turf Market Estimates and Forecasts, by Material (2020-2032) (USD Billion)

9.4.8.2 Singapore Artificial Turf Market Estimates and Forecasts, by Application (2020-2032) (USD Billion)

9.4.9 Australia

9.4.9.1 Australia Artificial Turf Market Estimates and Forecasts, by Material (2020-2032) (USD Billion)

9.4.9.2 Australia Artificial Turf Market Estimates and Forecasts, by Application (2020-2032) (USD Billion)

9.4.10 Rest of Asia Pacific

9.4.10.1 Rest of Asia Pacific Artificial Turf Market Estimates and Forecasts, by Material (2020-2032) (USD Billion)

9.4.10.2 Rest of Asia Pacific Artificial Turf Market Estimates and Forecasts, by Application (2020-2032) (USD Billion)

9.5 Middle East and Africa

9.5.1 Middle East

9.5.1.1 Trends Analysis

9.5.1.2 Middle East Artificial Turf Market Estimates and Forecasts, by Country (2020-2032) (USD Billion)

9.5.1.3 Middle East Artificial Turf Market Estimates and Forecasts, by Material (2020-2032) (USD Billion) 

9.5.1.4 Middle East Artificial Turf Market Estimates and Forecasts, by Application (2020-2032) (USD Billion)

9.5.1.5 UAE

9.5.1.5.1 UAE Artificial Turf Market Estimates and Forecasts, by Material (2020-2032) (USD Billion)

9.5.1.5.2 UAE Artificial Turf Market Estimates and Forecasts, by Application (2020-2032) (USD Billion)

9.5.1.6 Egypt

9.5.1.6.1 Egypt Artificial Turf Market Estimates and Forecasts, by Material (2020-2032) (USD Billion)

9.5.1.6.2 Egypt Artificial Turf Market Estimates and Forecasts, by Application (2020-2032) (USD Billion)

9.5.1.7 Saudi Arabia

9.5.1.7.1 Saudi Arabia Artificial Turf Market Estimates and Forecasts, by Material (2020-2032) (USD Billion)

9.5.1.7.2 Saudi Arabia Artificial Turf Market Estimates and Forecasts, by Application (2020-2032) (USD Billion)

9.5.1.8 Qatar

9.5.1.8.1 Qatar Artificial Turf Market Estimates and Forecasts, by Material (2020-2032) (USD Billion)

9.5.1.8.2 Qatar Artificial Turf Market Estimates and Forecasts, by Application (2020-2032) (USD Billion)

9.5.1.9 Rest of Middle East

9.5.1.9.1 Rest of Middle East Artificial Turf Market Estimates and Forecasts, by Material (2020-2032) (USD Billion)

9.5.1.9.2 Rest of Middle East Artificial Turf Market Estimates and Forecasts, by Application (2020-2032) (USD Billion)

9.5.2 Africa

9.5.2.1 Trends Analysis

9.5.2.2 Africa Artificial Turf Market Estimates and Forecasts, by Country (2020-2032) (USD Billion)

9.5.2.3 Africa Artificial Turf Market Estimates and Forecasts, by Material (2020-2032) (USD Billion) 

9.5.2.4 Africa Artificial Turf Market Estimates and Forecasts, by Application (2020-2032) (USD Billion)

9.5.2.5 South Africa

9.5.2.5.1 South Africa Artificial Turf Market Estimates and Forecasts, by Material (2020-2032) (USD Billion)

9.5.2.5.2 South Africa Artificial Turf Market Estimates and Forecasts, by Application (2020-2032) (USD Billion)

9.5.2.6 Nigeria

9.5.2.6.1 Nigeria Artificial Turf Market Estimates and Forecasts, by Material (2020-2032) (USD Billion)

9.5.2.6.2 Nigeria Artificial Turf Market Estimates and Forecasts, by Application (2020-2032) (USD Billion)

9.5.2.7 Rest of Africa

9.5.2.7.1 Rest of Africa Artificial Turf Market Estimates and Forecasts, by Component (2020-2032) (USD Billion)

9.5.2.7.2 Rest of Africa Artificial Turf Market Estimates and Forecasts, by Technology  (2020-2032) (USD Billion)

9.6 Latin America

9.6.1 Trends Analysis

9.6.2 Latin America Artificial Turf Market Estimates and Forecasts, by Country (2020-2032) (USD Billion)

9.6.3 Latin America Artificial Turf Market Estimates and Forecasts, by Material (2020-2032) (USD Billion) 

9.6.4 Latin America Artificial Turf Market Estimates and Forecasts, by Application (2020-2032) (USD Billion)

9.6.5 Brazil

9.6.5.1 Brazil Artificial Turf Market Estimates and Forecasts, by Material (2020-2032) (USD Billion)

9.6.5.2 Brazil Artificial Turf Market Estimates and Forecasts, by Application (2020-2032) (USD Billion)

9.6.6 Argentina

9.6.6.1 Argentina Artificial Turf Market Estimates and Forecasts, by Material (2020-2032) (USD Billion)

9.6.6.2 Argentina Artificial Turf Market Estimates and Forecasts, by Application (2020-2032) (USD Billion)

9.6.7 Colombia

9.6.7.1 Colombia Artificial Turf Market Estimates and Forecasts, by Material (2020-2032) (USD Billion)

9.6.7.2 Colombia Artificial Turf Market Estimates and Forecasts, by Application (2020-2032) (USD Billion)

9.6.8 Rest of Latin America

9.6.8.1 Rest of Latin America Artificial Turf Market Estimates and Forecasts, by Material (2020-2032) (USD Billion)

9.6.8.2 Rest of Latin America Artificial Turf Market Estimates and Forecasts, by Application (2020-2032) (USD Billion)

10. Company Profiles

           10.1 Dow dupont

                          10.1.1 Company Overview

10.1.2 Financial

10.1.3 Products/ Services Offered

10.1.4 SWOT Analysis

           10.2 Sport Group

10.2.1 Company Overview

10.2.2 Financial

10.2.3 Products/ Services Offered

10.2.4 SWOT Analysis

10.3 Tigerturf

10.3.1 Company Overview

10.3.2 Financial

10.3.3 Products/ Services Offered

10.3.4 SWOT Analysis

10.4 , Matrix Turf

10.4.1 Company Overview

10.4.2 Financial

10.4.3 Products/ Services Offered

10.4.4 SWOT Analysis

10.5 Tarkett

             10.5.1 Company Overview

10.5.2 Financial

10.5.3 Products/ Services Offered

10.5.4 SWOT Analysis

10.6 Shaw Industries

             10.6.1 Company Overview

10.6.2 Financial

10.6.3 Products/ Services Offered

10.6.4 SWOT Analysis

10.7 Victoria PLC

             10.7.1 Company Overview

10.7.2 Financial

10.7.3 Products/ Services Offered

10.7.4 SWOT Analysis

10.8 Controlled Products

             10.8.1 Company Overview

10.8.2 Financial

10.8.3 Products/ Services Offered

10.8.4 SWOT Analysis

10.9 ACT Globall

             10.9.1 Company Overview

10.9.2 Financial

10.9.3 Products/ Services Offered

10.9.4 SWOT Analysis

10.10 SIS Pitches

             10.10.1 Company Overview

10.10.2 Financial

10.10.3 Products/ Services Offered

10.10.4 SWOT Analysis

11. Use Cases and Best Practices

12. Conclusion


An accurate research report requires proper strategizing as well as implementation. There are multiple factors involved in the completion of good and accurate research report and selecting the best methodology to compete the research is the toughest part. Since the research reports we provide play a crucial role in any company’s decision-making process, therefore we at SNS Insider always believe that we should choose the best method which gives us results closer to reality. This allows us to reach at a stage wherein we can provide our clients best and accurate investment to output ratio.

Each report that we prepare takes a timeframe of 350-400 business hours for production. Starting from the selection of titles through a couple of in-depth brain storming session to the final QC process before uploading our titles on our website we dedicate around 350 working hours. The titles are selected based on their current market cap and the foreseen CAGR and growth.


The 5 steps process:

Step 1: Secondary Research:

Secondary Research or Desk Research is as the name suggests is a research process wherein, we collect data through the readily available information. In this process we use various paid and unpaid databases which our team has access to and gather data through the same. This includes examining of listed companies’ annual reports, Journals, SEC filling etc. Apart from this our team has access to various associations across the globe across different industries. Lastly, we have exchange relationships with various university as well as individual libraries.

Secondary Research

Step 2: Primary Research

When we talk about primary research, it is a type of study in which the researchers collect relevant data samples directly, rather than relying on previously collected data.  This type of research is focused on gaining content specific facts that can be sued to solve specific problems. Since the collected data is fresh and first hand therefore it makes the study more accurate and genuine.

We at SNS Insider have divided Primary Research into 2 parts.

Part 1 wherein we interview the KOLs of major players as well as the upcoming ones across various geographic regions. This allows us to have their view over the market scenario and acts as an important tool to come closer to the accurate market numbers. As many as 45 paid and unpaid primary interviews are taken from both the demand and supply side of the industry to make sure we land at an accurate judgement and analysis of the market.

This step involves the triangulation of data wherein our team analyses the interview transcripts, online survey responses and observation of on filed participants. The below mentioned chart should give a better understanding of the part 1 of the primary interview.

Primary Research

Part 2: In this part of primary research the data collected via secondary research and the part 1 of the primary research is validated with the interviews from individual consultants and subject matter experts.

Consultants are those set of people who have at least 12 years of experience and expertise within the industry whereas Subject Matter Experts are those with at least 15 years of experience behind their back within the same space. The data with the help of two main processes i.e., FGDs (Focused Group Discussions) and IDs (Individual Discussions). This gives us a 3rd party nonbiased primary view of the market scenario making it a more dependable one while collation of the data pointers.

Step 3: Data Bank Validation

Once all the information is collected via primary and secondary sources, we run that information for data validation. At our intelligence centre our research heads track a lot of information related to the market which includes the quarterly reports, the daily stock prices, and other relevant information. Our data bank server gets updated every fortnight and that is how the information which we collected using our primary and secondary information is revalidated in real time.

Data Bank Validation

Step 4: QA/QC Process

After all the data collection and validation our team does a final level of quality check and quality assurance to get rid of any unwanted or undesired mistakes. This might include but not limited to getting rid of the any typos, duplication of numbers or missing of any important information. The people involved in this process include technical content writers, research heads and graphics people. Once this process is completed the title gets uploader on our platform for our clients to read it.

Step 5: Final QC/QA Process:

This is the last process and comes when the client has ordered the study. In this process a final QA/QC is done before the study is emailed to the client. Since we believe in giving our clients a good experience of our research studies, therefore, to make sure that we do not lack at our end in any way humanly possible we do a final round of quality check and then dispatch the study to the client.

Key Segments:

By Material

  • Polyamides

  • Polypropylene

  • Polyethylene

  • Nylon

  • Sand Plant Infill Material

By Application

  • Residential

  • Commercial

  • Sports

Request for Segment Customization as per your Business Requirement: Segment Customization Request

Regional Coverage:

North America

  • US

  • Canada

  • Mexico

Europe

  • Eastern Europe

    • Poland

    • Romania

    • Hungary

    • Turkey

    • Rest of Eastern Europe

  • Western Europe

    • Germany

    • France

    • UK

    • Italy

    • Spain

    • Netherlands

    • Switzerland

    • Austria

    • Rest of Western Europe

Asia Pacific

  • China

  • India

  • Japan

  • South Korea

  • Vietnam

  • Singapore

  • Australia

  • Rest of Asia Pacific

Middle East & Africa

  • Middle East

    • UAE

    • Egypt

    • Saudi Arabia

    • Qatar

    • Rest of Middle East

  • Africa

    • Nigeria

    • South Africa

    • Rest of Africa

  • Latin America

  • Brazil

  • Argentina

  • Colombia

  • Rest of Latin America

Request for Country Level Research Report: Country Level Customization Request

Available Customization

With the given market data, SNS Insider offers customization as per the company’s specific needs. The following customization options are available for the report:

  • Product Analysis

  • Criss-Cross segment analysis (e.g. Product X Application)

  • Product Matrix which gives a detailed comparison of the product portfolio of each company

  • Geographic Analysis

  • Additional countries in any of the regions

  • Company Information

  • Detailed analysis and profiling of additional market players (Up to five)


  •            5000 (33% Discount)


  •            8950 (40% Discount)


  •            3050 (23% Discount)

Start a Conversation

Hi! Click one of our member below to chat on Phone