Asset Performance Management Market Report Scope & Overview:
Get More Information on Asset Performance Management Market - Request Sample Report
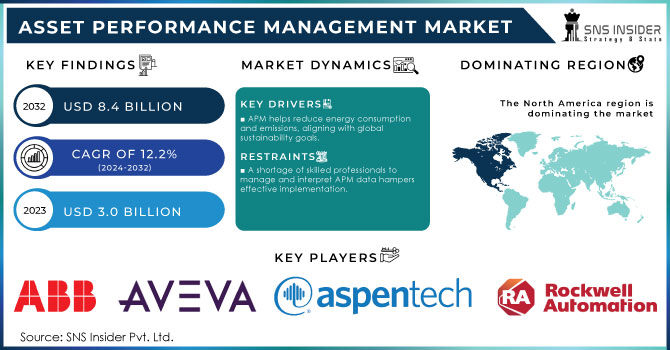
Asset Performance Management Market was valued at USD 3.0 billion in 2023 and is expected to reach USD 8.4 billion by 2032 and grow at a CAGR of 12.2% from 2024-2032.
The Asset Performance Management (APM) market focuses on optimizing the performance and reliability of physical assets through data analytics, machine learning, and predictive maintenance. It plays a crucial role in industries like oil and gas, manufacturing, energy, and utilities, where the need to enhance asset efficiency and reduce operational costs is paramount. APM solutions help organizations monitor asset health, predict failures, and extend the life of critical equipment, leading to improved productivity and safety.
Key drivers of this growth include the increasing adoption of Industrial Internet of Things (IoT) technologies, the rise in cloud-based solutions, and the growing focus on digital transformation across industries. The energy and utilities sector remains the largest market segment due to the high costs associated with equipment failure and maintenance. Additionally, advancements in artificial intelligence (AI) and machine learning (ML) have revolutionized APM by enabling more accurate predictive analytics, which helps organizations make informed decisions regarding asset management. The Asia-Pacific region is expected to witness the fastest growth due to rapid industrialization, technological adoption, and increasing investments in smart manufacturing. Nevertheless, obstacles like high implementation costs and data security concerns could impede market growth.
Market Dynamics
Drivers
-
APM helps reduce energy consumption and emissions, aligning with global sustainability goals.’
-
AI and ML technologies enable more accurate predictions of asset health and performance.
-
Predictive analytics reduce unplanned downtime and maintenance costs, boosting APM adoption.
Predictive analytics in the Asset Performance Management (APM) market leverage data, machine learning, and statistical algorithms to forecast potential asset failures before they occur. This proactive approach is crucial as it helps industries avoid unplanned downtime, which can be costly and disruptive. By analyzing data from sensors and historical performance records, predictive analytics can identify patterns and anomalies that indicate an impending failure.
In traditional maintenance models, equipment is often serviced at fixed intervals or only after a breakdown occurs, leading to either unnecessary maintenance costs or unexpected downtimes that halt operations. Predictive analytics, however, enables condition-based maintenance, allowing companies to perform maintenance only when needed. This greatly lowers maintenance expenses, enhances asset availability, and prolongs the life of essential equipment.
For industries like manufacturing, energy, and utilities, where machinery and equipment are central to operations, the ability to minimize downtime translates into significant cost savings and improved productivity. By optimizing asset performance and reliability, predictive analytics help companies achieve higher efficiency and better resource allocation, which are critical in today’s competitive market. Consequently, the adoption of APM solutions integrated with predictive analytics is accelerating as businesses recognize the value of predictive maintenance in driving operational excellence and reducing total ownership costs.
AI (Artificial Intelligence) and ML (Machine Learning) technologies enhance the accuracy of predicting asset health and performance in the Asset Performance Management (APM) market by analyzing vast amounts of real-time data from sensors and historical records. Unlike traditional methods, AI and ML can detect complex patterns and trends that humans might miss, allowing for early detection of potential issues.
Restraints
-
A shortage of skilled professionals to manage and interpret APM data hampers effective implementation.
-
The use of cloud-based APM solutions raises concerns about data breaches and unauthorized access.
-
Poor data quality or insufficient data can impact the accuracy of predictive analytics in APM.
In the Asset Performance Management (APM) market, the accuracy of predictive analytics heavily relies on high-quality and sufficient data collected from various assets. Poor data quality such as missing, inconsistent, or erroneous data can lead to inaccurate predictions, making it difficult to identify potential equipment failures or performance issues. Insufficient data can also hinder the ability of machine learning models to learn effectively, resulting in less reliable forecasts.
Without accurate and comprehensive data, predictive models may fail to detect critical patterns or anomalies that indicate asset health, leading to unexpected breakdowns and costly downtimes. This diminishes the value of APM solutions, as the primary goal is to enhance asset reliability and optimize maintenance. Ensuring data accuracy and completeness is therefore essential for the successful implementation of APM. Organizations must invest in robust data management practices, including regular data validation, cleansing, and integration, to fully leverage predictive analytics for asset performance optimization.
In the Asset Performance Management (APM) market, the adoption of cloud-based solutions allows organizations to access real-time asset data, predictive analytics, and maintenance insights from anywhere, enhancing operational efficiency. However, this reliance on cloud platforms also introduces significant data security concerns. Sensitive data, including operational details, equipment performance metrics, and maintenance schedules, is stored and transmitted over the Internet, making it vulnerable to cyberattacks, data breaches, and unauthorized access.
Segment Analysis
By Component
In 2023, the Asset Reliability Management segment led the market, holding the largest share of over 33.0%. The increasing need for companies to extend the lifespan of machinery and equipment, along with the desire to reduce high operational and maintenance costs, is driving growth in the asset performance management segment.
However, the predictive asset management segment is projected to experience the highest growth rate, surpassing 14.02% during the forecast period. This growth is fueled by the use of advanced computing tools and techniques, such as risk-based inspection, neural networks, machine learning, safety integrity level analysis, statistical modeling, root cause failure analysis, and algorithms. These technologies enable organizations to gain valuable insights and implement preventive measures to avoid asset failures, enhancing overall performance and reliability.
By Deployment
In 2023, the Hosted systems segment dominated the market and represented over 35.0% market share. As a result of the rising demand for public cloud deployment, It offers a wide range of solutions and computing resources to address the evolving needs of organizations across various sizes and industries. Additionally, the introduction of new features and tools, along with the desire to gain a competitive edge, is driving organizations to adopt public cloud solutions, as cloud providers handle the maintenance and updates of the technical ecosystem in the public cloud model.
However, the need for customization due to the unique requirements of various machinery and equipment in asset-intensive industries, significant adjustments needed in APM systems, and concerns about data security with cloud-based solutions are key reasons why some organizations prefer on-premises APM systems.
By Organization Size
The large enterprises segment dominated the market in 2023 and represented over 54% of the market share. The rising trend of digitalization is expected to drive the demand for asset performance monitoring software, fueled by the increasing needs and substantial budgets of large enterprises.
Additionally, the small and medium-sized enterprise (SME) segment is anticipated to grow rapidly during the forecast period. The introduction of new and advanced cloud-based software is significantly boosting investment by SMEs, enabling them to optimize their asset maintenance and service costs.
By Vertical
In 2023, the energy and utilities sector led the market, capturing the largest share of over 20.0%. This growth is driven by the need to reassess strategies and use advanced technology in company processes. The increasing demand for reliable energy services has led managers to use asset performance management solutions to monitor and maintain assets more effectively. Additionally, the growing emphasis on predictive maintenance is also contributing to the segment's expansion.
The chemical and pharmaceutical industry will grow at the highest CAGR rate during the forecast period. contributes significantly to the global economy each year. Consequently, it is crucial to improve the reliability and maintenance of chemical equipment to ensure optimal production levels. Key challenges in the chemical sector include unexpected downtime of critical equipment, high maintenance and repair costs due to corrosive substances, and safety concerns related to handling hazardous chemicals.
The government and public sector segment is expected to grow quickly during the forecast period. As various firms broaden their operations to reach larger markets, there is an increasing demand for cloud-based solutions and services to help these organizations deliver more efficient solutions to their customers.
Regional Analysis
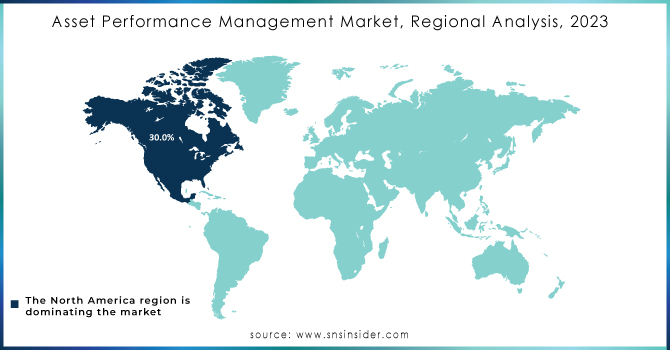
North America led the global market with a share of over 30.0% In 2023. This dominance is driven by the rising demand for high-speed data networks and the significant presence of software vendors in the region. Additionally, increased investments by organizations in IT infrastructure, particularly for developing cloud technologies, are further boosting regional market growth. The rising demand for efficient asset management, sustainable practices, and optimizing total cost of ownership (TCO) has driven the adoption of asset performance management solutions throughout the region. North America is leading in the implementation of these solutions, which are effective in offering early warnings through predictive analytics and diagnosing equipment problems days, weeks, or even months before failures occur.
Asia Pacific is projected to achieve the highest CAGR during the forecast period due to substantial investments by major companies and the adoption of new technologies across various industries. Many organizations are shifting their workloads to the cloud as they emphasize developing their digital transformation strategies through cloud technology.
Need any customization research on Asset Performance Management Market - Enquiry Now
Key Players:
The major key players are ABB Ltd, AVEVA Group plc, Aspen Technology, Inc., Bentley Systems Incorporated, AVEVA Group plc, Rockwell Automation, SAP SE, SAS Institute, Inc., Siemens Energy, DNV GLAS, GE Digital.
Recent development
- In November 2023, ABB Ltd Launched ABBability SmartMaster, this platform is for monitoring and validating the condition of equipment and field devices in industries such as oil and gas, wastewater, and water.
- In January 2023, Schneider Electric acquired AVEVA, allowing both companies to take a comprehensive approach to digital transformation in industrial operations, to reduce energy use, carbon emissions, and resource intensity.
|
Report Attributes |
Details |
|
Market Size in 2023 |
USD 3.0 Bn |
|
Market Size by 2032 |
USD 8.4 Bn |
|
CAGR |
CAGR of 12.2% From 2024 to 2032 |
|
Base Year |
2023 |
|
Forecast Period |
2024-2032 |
|
Historical Data |
2020-2022 |
|
Report Scope & Coverage |
Market Size, Segments Analysis, Competitive Landscape, Regional Analysis, DROC & SWOT Analysis, Forecast Outlook |
|
Key Segments |
• By Component (Solutions,Services) |
|
Regional Analysis/Coverage |
North America (US, Canada, Mexico), Europe (Eastern Europe [Poland, Romania, Hungary, Turkey, Rest of Eastern Europe] Western Europe] Germany, France, UK, Italy, Spain, Netherlands, Switzerland, Austria, Rest of Western Europe]), Asia Pacific (China, India, Japan, South Korea, Vietnam, Singapore, Australia, Rest of Asia Pacific), Middle East & Africa (Middle East [UAE, Egypt, Saudi Arabia, Qatar, Rest of Middle East], Africa [Nigeria, South Africa, Rest of Africa], Latin America (Brazil, Argentina, Colombia Rest of Latin America) |
|
Company Profiles |
ABB Ltd, AVEVA Group plc, Aspen Technology, Inc., Bentley Systems Incorporated, AVEVA Group plc, Rockwell Automation, SAP SE, SAS Institute, Inc., Siemens Energy, DNV GLAS, GE Digital. |
|
Key Drivers |
• APM helps reduce energy consumption and emissions, aligning with global sustainability goals.’ |
|
Market Restraints |
• The use of cloud-based APM solutions raises concerns about data breaches and unauthorized access. |
Frequently Asked Questions
Ans: Four segments are covered in the Asset Performance Management Market Report, By Component, By Deployment mode, By Organization Size, By Vertical.
Ans. The forecast period of the Asset Performance Management Market is 2024-2032.
Ans: There are three options available to purchase this report,
- Single User License USD 4650
Features: A non-printable PDF to be accessed by just one user at a time
- No Excel would be delivered along with the PDF
- 1 complimentary analyst briefing session of 30 minutes to be provided post-purchase and delivery of the study
- 1 complimentary update to be provided after 6 months of purchase
- Additional 80 analyst hours of free customization to add extra slices of information that might be missing from the study
- Enterprise User License: USD 6,450
Features:
- A printable/ sharable and downloadable PDF
- No limit over the number of users
- An Excel spreadsheet would be delivered along with the PDF
- 2 complimentary analyst briefing sessions of 30 minutes each to be provided post-purchase and delivery of the study
- 2 complimentary updates to be provided within 1 year of purchase
- Additional 100 analyst hours of free customization to add extra slices of information that might be missing from the study.
C: Excel Datasheet: USD 2,325
- ME sheet is provided in Excel format.
- 1 complimentary analyst briefing session of 30 minutes to be provided post-purchase and delivery of the study
Ans. The CAGR of the Asset Performance Management Market is 12.2%.
North America Dominated the Asset Performance Management market with a share of over 30.0% In 2023.
Get in Touch
