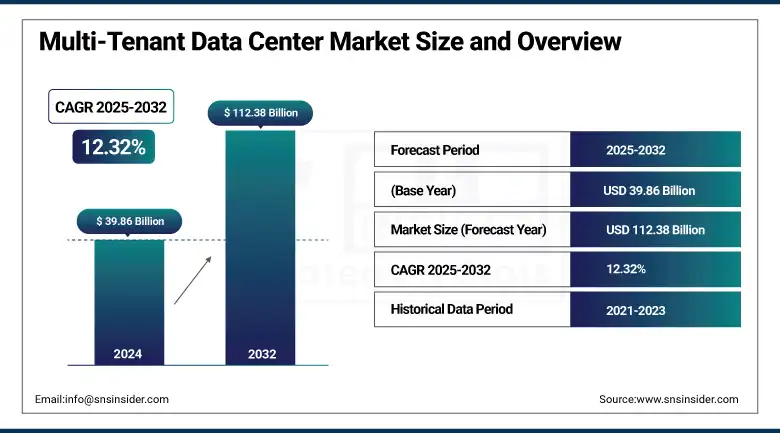
Multi-Tenant Data Center Market size was valued at USD 39.86 billion in 2024 and is anticipated to reach USD 112.38 billion by 2032, growing at a CAGR of 12.32% during 2025-2032.
The Multi-Tenant Data Center Market growth is attributed to the growing demand for cloud services, data storage, and the requirement for a rapidly scalable and agile IT infrastructure across numerous sectors. The market is growing as a result of the demand for secure, affordable, and scalable solutions. The growth of the multi-tenant data center market is also influenced by the adoption of IoT technologies, digital transformation, and an increase in data generation.
For instance, around 402.74 million terabytes of information was generated per day in 2024, and it is expected that around 147 zettabytes of information will be generated in 2025, further boosting the growing need for multi-tenant data center infrastructure.
As per a research, 90% of the global companies report missing crucial storage features including high availability and tamperproof protection, and 54% opt for central or decentralized data centers over public cloud storage. Addition, around 69% of the market players are planning to incorporate AI capabilities in their storage infrastructure for efficiency and automation.
For instance, in 2024, Iron Mountain expanded its data center capacity in Virginia by more than 350 megawatts, bringing its total planned global capacity to over 1.2 gigawatts demonstrating robust industry investment in multi-tenant infrastructure.
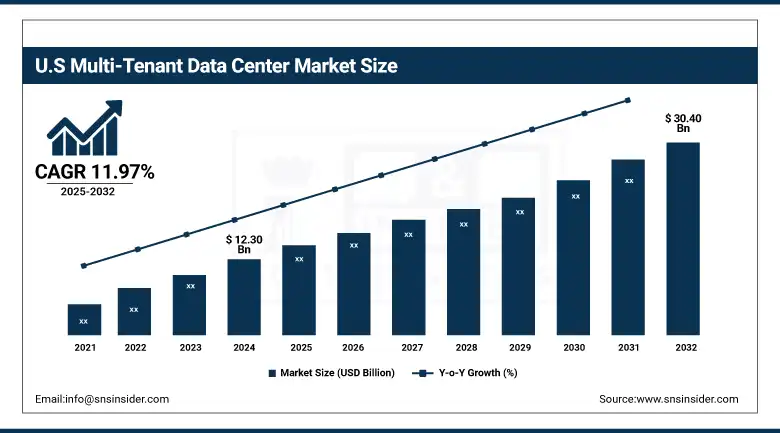
The U.S. multi-tenant data center market size accounted for a valuation of USD 12.30 billion in 2024 and is predicted to grow at a valuation of USD 30.40 billion by 2032, expanding at a CAGR of 11.97% during 2025-2032.
The U.S. multi-tenant data center market is growing due to the high demand for big data, colocation services, and cloud computing globally. During the digital transformation of businesses that have adopted IoT and AI-based technologies, requirements for scalable, secure, and efficient data centers boost market expansion and growth.
In 2024, Equinix has announced a joint venture with GIC and CPP Investments to invest over USD 15 billion in expanding its xScale data center program across the U.S. This initiative aims to address the growing demand for AI and cloud services by adding more than 1.5 gigawatts of capacity.
In 2024, Equinix and PGIM Real Estate launched a USD 600 million joint venture to develop the first xScale data center in the U.S. Located in Silicon Valley, the facility is set to be completed by Q2 2024.
Drivers:
Cloud Adoption Boosts the Demand for Scalable and Cost-Efficient Multi-Tenant Data Center Infrastructure Across Industries Globally
Cloud computing is accelerating growth of multi-tenant data centers as organizations demand scalable and economical data storage solutions. With cloud infrastructures, operations are simplified, so are flexibility, and capital outlay has a minimum with these. Multi-tenant data centers offer companies the ability to scale without the high capital expenditure since they share resources. Increased usage of Software-as-a-Service (SaaS) and platform services further fuels demand, enabling ongoing market expansion for scalable, secure, and efficient data center solutions in industries of all sizes.
According to Google Cloud, in 2023, 41.4% of IT leaders increased their use of cloud-based services and products, 33.4% planned to migrate from legacy enterprise software to cloud-based tools, and over 50% of organizations were hiring or retraining staff to better optimize cloud spending highlighting the accelerating shift toward cloud adoption.
According to Research, in 2024, Amazon Web Services (AWS) led the global cloud infrastructure market with a 30% share, followed by Microsoft Azure at 21% and Google Cloud at 12%.
Restraints:
Shared Infrastructure Heightens Security Risks and Threatens Sensitive Data Protection in Multi-Tenant Data Centers
The multi-tenant data center model based on shared infrastructure presents security issues that can possibly slow down market expansion. Since several organizations share physical hardware, the threat of data compromise and unauthorized entry is present. Even with sophisticated security solutions such as encryption, data and system isolation in such an environment is still challenging, particularly for financial and health organizations whose data has to be protected by stringent data protection laws. Organizations are likely to shy away from embracing multi-tenant data centers unless security issues are comprehensively addressed.
According to research, 74% of all breaches involve human error or misuse. The average data breach cost reached an all-time high of $4.88 million in 2024, marking a 10% increase from 2023. It takes an average of 204 days to identify and 73 days to contain a breach.
Opportunities:
IoT Growth Increases Need for High-Performance, Scalable Data Center Solutions to Support Real-Time Processing
Expansion in IoT technology is making a drastic impact on the multi-tenant data center industry. Organizations trust advanced data centers to offer secure storage, handling, and examination of the incredible volumes of information produced by IoT devices. Multitenant data centers offer high-performance scalable solutions to facilitate IoT applications, especially in industries where timely processing matters, like manufacturing, healthcare, and transportation.
According to research, 83% of healthcare organizations have adopted IoT technologies, leveraging real-time data for improved patient care and operational efficiency. Additionally, the number of IoT devices was recorded to be 15.9 billion in 2023.
Challenges:
Managing Operational Efficiency While Scaling Infrastructure Amid Surging Data Center Demand Remains a Persistent Challenge
Multi-tenant data centers struggle to maintain operational efficiency as they manage increasing resource demands. As the generation of data grows, the data centers have to scale infrastructure, power usage, and cooling systems. Avoiding inefficiencies while expanding is key, as inefficiency can affect operations, increase costs, and slow down services. Coping with these issues while satisfying customer demand is a continuous challenge for multi-tenant data center players.
According to Uptime Institute’s 2023 survey, cooling issues contribute to 13% of impactful outages, highlighting the critical need for efficient thermal management in data centers. Power remains the leading cause of impactful outages, accounting for 54% of such incidents.
Additionally, research from the International Energy Agency (IEA) shows that data centers account for around 1% of global energy use, emphasizing the importance of optimizing power usage and cooling systems.
By Component
The Solutions segment dominated the Multi-Tenant Data Center Market with the highest revenue share of about 74% in 2024 due to its wide spectrum of offerings like cloud services, security solutions, and data storage, which are important for enterprises with large-scale infrastructure. Demand for multi-tenant data centers is rising, as enterprises increasingly depend upon these solutions to ensure scalability, flexibility, and operational efficiency.
The Services segment is expected to grow at the fastest CAGR of 13.71% over the forecasting period 2025-2032 due to the fact that firms are tending to give more importance to managed services, network optimization, and cybersecurity offerings. The boost towards outsourcing of IT functions as well as specifications for niche-level services like disaster recovery and analytics is driving growth in the segment.
By Type
The Retail Colocation segment led the Multi-Tenant Data Center Market with the largest revenue share of approximately 71% in 2024 owing to the fact that companies favor retail colocation as it is cost-saving and scalable. It enables companies to lease space and maintain their own equipment but utilize the data center's infrastructure, thus offering a versatile solution to different industries, particularly small and mid-sized organizations.
The Wholesale Colocation segment is anticipated to grow at the fastest CAGR of approximately 13.59% from 2025-2032, as more demand is expected from large companies and cloud providers that need huge space, power, and cooling capacities. With scaling up of businesses, they opt for wholesale colocation for the fact that it can take large, dedicated infrastructure which grants them more control and a lower-cost solution for massive operations.
By Enterprise Size
Large Enterprises segment dominated the Multi-Tenant Data Center Market with a highest revenue share of around 68% in 2024, as these enterprises require robust, secure, and scalable data infrastructure to manage vast amounts of data and transactions. They heavily depend on multi-tenant data centers due to their cost-effectiveness and flexibility, enabling them to scale operations without a high amount of investment in physical infrastructure.
The SME segment is expected to grow at the fastest CAGR of approximately 14.52% during 2025-2032, supported by mounting digital transformation activities and growing use of cloud-based solutions among small and medium enterprises. With SMEs looking to contain IT infrastructure costs while preserving flexibility and data protection, multi-tenant data centers provide an affordable, scalable option. Also, rising awareness and availability of advanced IT solutions are fueling demand in this segment.
By Industry vertical
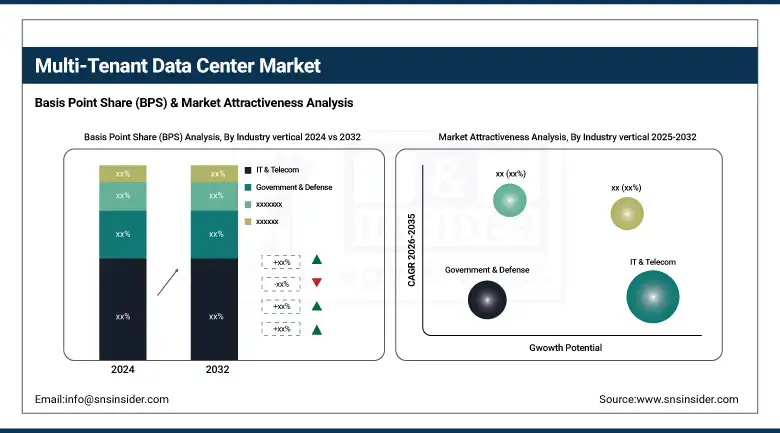
The IT & Telecom industry led the Multi-Tenant Data Center Market Share of around 29% in 2024 due to the fact that these sectors demand a huge data processing and storage capacity to host their growing networks, services, and customer bases. Multi-tenant data centers supply the platform for telecommunication networks and IT services with scalable and secure options for handling sophisticated operations.
The Healthcare segment is expected to grow at the fastest CAGR of around 14.75% between 2025-2032, with the healthcare industry increasingly adopting digital health solutions like electronic health records (EHR), telemedicine, and cloud-based applications. The demand for scalable and secure data storage facilities for patient information and healthcare solutions will drive growth, as healthcare organizations look for data centers with compliance with regulations and high availability.
By Application
The Public Cloud segment dominated the Multi-Tenant Data Center Market with the highest revenue market share of nearly 62% in 2024, owing to the rising adoption of cloud environments among businesses owing to their scalability, cost-effectiveness, and agility. Public cloud services, provided by industry leaders like AWS, Google Cloud, and Microsoft Azure, are finding favor among businesses looking to outsource their data management and IT infrastructure needs.
The Private Cloud segment is growing at the fastest CAGR of approximately 13.69% over 2025-2032, driven by the increasing need for more security, compliance, and control of confidential data. Companies handling sensitive or regulatory-limited information, like in finance and healthcare, are increasingly choosing private cloud offerings, which ensure greater data privacy and security than public cloud offerings.
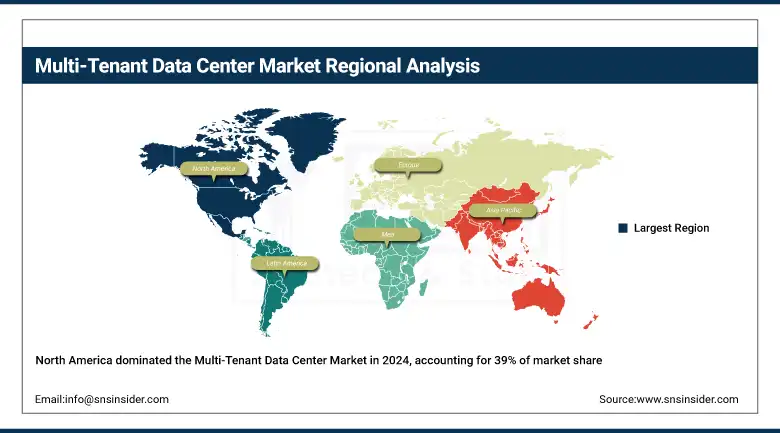
Regional Analysis:
North America dominated the Multi-Tenant Data Center Market with the highest revenue share of about 39% in 2024 due to the region's advanced IT infrastructure, high adoption of cloud computing, and strong presence of major tech companies. Growing demand from the IT, financial, and healthcare sectors for data storage facilities, colocation, and cloud computing solutions is fueling domination of the region, along with major investment towards building and upgrading data centers.
The U.S. led the Multi-Tenant Data Center Market with growing demand for cloud, strong infrastructure, and greater tech adoption.
Asia Pacific is also anticipated to expand at the fastest CAGR of 14.82% during 2025-2032 driven by the accelerated rate of digitalization and cloud service expansion in emerging markets such as China, India, and Southeast Asia. Increased usage of data, increased internet penetration, and entry of global players in the region to establish data centers are fueling its growth, as well as growing demand for cost-effective and scalable IT infrastructure solutions.
China led the Multi-Tenant Data Center Market in 2024 because of accelerated digital transformation, high demand for cloud services, and government encouragement for infrastructure development.
Europe has a strong presence in the Multi-Tenant Data Center Market due to its advanced digital infrastructure, high demand for data storage, robust data protection regulations, and growing adoption of cloud services across industries, driving market growth.
In Europe, Germany led the Multi-Tenant Data Center Market in 2024 because of its robust industrial base, high data center demand, and central location in Europe, making it a hub for cloud services and digital infrastructure.
Middle East & Africa and Latin America are increasingly present in the Multi-Tenant Data Center Market as a result of growing digitalization, rising cloud service demand, infrastructure investments, and the necessity for secure data storage and processing solutions.
Multi-Tenant Data Center Market Companies include Equinix Inc., Digital Realty, NTT Communications Corporation, IBM Corporation, Global Switch Ltd., CenturyLink Inc., Rackspace Inc., Iron Mountain, Telstra International, Eaton Corporation, AT&T, China Telecom, Cisco, DuPont Fabros, and Level 3 Communications.
In 2024, Lumen Technologies entered into a supply agreement with Corning for next-generation fiber-optic cables, reserving 10% of Corning's global fiber capacity over two years to support AI-enabled data centers and expand Lumen's intercity network.
In 2024, Iron Mountain expanded its planned data center capacity in Virginia by acquiring two development sites in Richmond and Manassas, adding over 350 megawatts of future capacity to support growing customer demand
In 2024, NTT Com's Osaka 7 Data Center received certification under the NVIDIA DGX-Ready Data Center program, validating its capability to support high-density AI workloads. The facility is part of NTT's Green Nexcenter initiative, focusing on energy efficiency and sustainability.
In 2023, Digital Realty and Blackstone announced a USD 7 billion joint venture to develop four hyperscale data center campuses across three metro areas in Europe and North America, expected to deliver approximately 500 megawatts of IT capacity.
Report Attributes | Details |
---|---|
Market Size in 2024 | USD 39.86 Billion |
Market Size by 2032 | USD 112.38 Billion |
CAGR | CAGR of 12.32% From 2025 to 2032 |
Base Year | 2024 |
Forecast Period | 2025-2032 |
Historical Data | 2021-2023 |
Report Scope & Coverage | Market Size, Segments Analysis, Competitive Landscape, Regional Analysis, DROC & SWOT Analysis, Forecast Outlook |
Key Segments | • By Component (Solutions, Services) • By Type (Retail Colocation, Wholesale Colocation) • By Enterprise Size (SME, Large Enterprises) • By Application (Public Cloud, Private Cloud) • By Industry Vertical (BFSI, Healthcare, Government & Defense, IT & Telecom, Retail, Manufacturing, Others) |
Regional Analysis/Coverage | North America (US, Canada, Mexico), Europe (Germany, France, UK, Italy, Spain, Poland, Turkey, Rest of Europe), Asia Pacific (China, India, Japan, South Korea, Singapore, Australia, Rest of Asia Pacific), Middle East & Africa (UAE, Saudi Arabia, Qatar, South Africa, Rest of Middle East & Africa), Latin America (Brazil, Argentina, Rest of Latin America) |
Company Profiles | Equinix Inc., Digital Realty, NTT Communications Corporation, IBM Corporation, Global Switch Ltd., CenturyLink Inc., Rackspace Inc., Iron Mountain, Telstra International, Eaton Corporation, AT&T, China Telecom, Cisco, DuPont Fabros, Level 3 Communications |
Ans: Multi-Tenant Data Center Market was valued at USD 39.86 billion in 2024 and is expected to reach USD 112.38 billion by 2032, growing at a CAGR of 12.32% from 2025-2032.
Ans: Growth is driven by cloud adoption, data storage, IT infrastructure needs, digital transformation, and IoT technology integration.
Ans: The Solutions segment dominated with a 74% market share due to cloud services, security solutions, and data storage offerings.
Ans: Retail Colocation led with a 71% market share, offering cost-effective and scalable solutions for businesses, especially small to mid-sized enterprises.
Ans: The IT & Telecom sector led with a 29% market share due to its significant need for data processing and storage capacity for network services.
Table of Contents:
1. Introduction
1.1 Market Definition
1.2 Scope (Inclusion and Exclusions)
1.3 Research Assumptions
2. Executive Summary
2.1 Market Overview
2.2 Regional Synopsis
2.3 Competitive Summary
3. Research Methodology
3.1 Top-Down Approach
3.2 Bottom-up Approach
3.3. Data Validation
3.4 Primary Interviews
4. Market Dynamics Impact Analysis
4.1 Market Driving Factors Analysis
4.1.1 Drivers
4.1.2 Restraints
4.2 PESTLE Analysis
4.3 Porter’s Five Forces Model
5. Statistical Insights and Trends Reporting
5.1 Power Usage Effectiveness (PUE)
5.2 Security Breaches and Data Protection Statistics
5.3 Operational Metrics
5.4 Carbon Footprint and Sustainability Metrics
5.5 Data Center Migration Trends
5.7 Churn Rate in Colocation Services
6. Competitive Landscape
6.1 List of Major Companies, By Region
6.2 Market Share Analysis, By Region
6.3 Product Benchmarking
6.3.1 Product specifications and features
6.3.2 Pricing
6.4 Strategic Initiatives
6.4.1 Marketing and promotional activities
6.4.2 Distribution and supply chain strategies
6.4.3 Expansion plans and new product launches
6.4.4 Strategic partnerships and collaborations
6.5 Technological Advancements
6.6 Market Positioning and Branding
7. Multi-Tenant Data Centers Market Segmentation, By Component
7.1 Chapter Overview
7.2 Solutions
7.2.1 Solutions Market Trends Analysis (2020-2032)
7.2.2 Solutions Market Size Estimates and Forecasts to 2032 (USD Billion)
7.3 Services
7.3.1 Services Market Trends Analysis (2020-2032)
7.3.2 Services Market Size Estimates and Forecasts to 2032 (USD Billion)
8. Multi-Tenant Data Centers Market Segmentation, By Industry vertical
8.1 Chapter Overview
8.2 BFSI
8.2.1 BFSI Market Trends Analysis (2020-2032)
8.2.2 BFSI Market Size Estimates And Forecasts To 2032 (USD Billion)
8.3 Healthcare
8.3.1 Healthcare Market Trends Analysis (2020-2032)
8.3.2 Healthcare Market Size Estimates And Forecasts To 2032 (USD Billion)
8.4 Retail
8.4.1 Retail Market Trends Analysis (2020-2032)
8.4.2 Retail Market Size Estimates And Forecasts To 2032 (USD Billion)
8.5 IT & Telecom
8.5.1 IT & Telecom Market Trends Analysis (2020-2032)
8.5.2 IT & Telecom Market Size Estimates And Forecasts To 2032 (USD Billion)
8. 6 Government & Defense
8.6.1 Government & Defense Market Trends Analysis (2020-2032)
8.6.2 Government & Defense Market Size Estimates And Forecasts To 2032 (USD Billion)
8.7 Manufacturing
8.7.1 Manufacturing Market Trends Analysis (2020-2032)
8.7.2 Manufacturing Market Size Estimates And Forecasts To 2032 (USD Billion)
8.8 Others
8.8.1 Others Market Trends Analysis (2020-2032)
8.8.2 Others Market Size Estimates And Forecasts To 2032 (USD Billion)
9. Multi-Tenant Data Centers Market Segmentation, By Type
9.1 Chapter Overview
9.2 Retail Colocation
9.2.1 Retail Colocation Market Trends Analysis (2020-2032)
9.2.2 Retail Colocation Market Size Estimates And Forecasts To 2032 (USD Billion)
9.3 Wholesale Colocation
9.3.1 Wholesale Colocation Market Trends Analysis (2020-2032)
9.3.2 Wholesale Colocation Market Size Estimates And Forecasts To 2032 (USD Billion)
10. Multi-Tenant Data Centers Market Segmentation, By Application
10.1 Chapter Overview
10.2 Public Cloud
10.2.1 Public Cloud Market Trends Analysis (2020-2032)
10.2.2 Public Cloud Market Size Estimates And Forecasts To 2032 (USD Billion)
10.3 Private Cloud
10.3.1 Private Cloud Market Trends Analysis (2020-2032)
10.3.2 Private Cloud Market Size Estimates And Forecasts To 2032 (USD Billion)
11. Multi-Tenant Data Centers Market Segmentation, By Enterprise Size
11.1 Chapter Overview
11.2 SME
11.2.1 SME Market Trends Analysis (2020-2032)
11.2.2 SME Market Size Estimates And Forecasts To 2032 (USD Billion)
11.3 Large enterprises
11.3.1 Large enterprises Market Trends Analysis (2020-2032)
11.3.2 Large enterprises Market Size Estimates And Forecasts To 2032 (USD Billion)
12. Regional Analysis
12.1 Chapter Overview
12.2 North America
12.2.1 Trends Analysis
12.2.2 North America Multi-Tenant Data Centers Market Estimates And Forecasts, By Country (2020-2032) (USD Billion)
12.2.3 North America Multi-Tenant Data Centers Market Estimates And Forecasts, By Component (2020-2032) (USD Billion)
12.2.4 North America Multi-Tenant Data Centers Market Estimates And Forecasts, By Industry vertical (2020-2032) (USD Billion)
12.2.5 North America Multi-Tenant Data Centers Market Estimates And Forecasts, By Type (2020-2032) (USD Billion)
12.2.6 North America Multi-Tenant Data Centers Market Estimates And Forecasts, By Application (2020-2032) (USD Billion)
12.2.7 North America Multi-Tenant Data Centers Market Estimates And Forecasts, By Enterprise Size (2020-2032) (USD Billion)
12.2.8 USA
12.2.8.1 USA Multi-Tenant Data Centers Market Estimates And Forecasts, By Component (2020-2032) (USD Billion)
12.2.8.2 USA Multi-Tenant Data Centers Market Estimates And Forecasts, By Industry vertical (2020-2032) (USD Billion)
12.2.8.3 USA Multi-Tenant Data Centers Market Estimates And Forecasts, By Type (2020-2032) (USD Billion)
12.2.8.4 USA Multi-Tenant Data Centers Market Estimates And Forecasts, By Application (2020-2032) (USD Billion)
12.2.8.5 USA Multi-Tenant Data Centers Market Estimates And Forecasts, By Enterprise Size (2020-2032) (USD Billion)
12.2.9 Canada
12.2.9.1 Canada Multi-Tenant Data Centers Market Estimates And Forecasts, By Component (2020-2032) (USD Billion)
12.2.9.2 Canada Multi-Tenant Data Centers Market Estimates And Forecasts, By Industry vertical (2020-2032) (USD Billion)
12.2.9.3 Canada Multi-Tenant Data Centers Market Estimates And Forecasts, By Type (2020-2032) (USD Billion)
12.2.9.4 Canada Multi-Tenant Data Centers Market Estimates And Forecasts, By Application (2020-2032) (USD Billion)
12.2.9.5 Canada Multi-Tenant Data Centers Market Estimates And Forecasts, By Enterprise Size (2020-2032) (USD Billion)
12.2.10 Mexico
12.2.10.1 Mexico Multi-Tenant Data Centers Market Estimates And Forecasts, By Component (2020-2032) (USD Billion)
12.2.10.2 Mexico Multi-Tenant Data Centers Market Estimates And Forecasts, By Industry vertical (2020-2032) (USD Billion)
12.2.10.3 Mexico Multi-Tenant Data Centers Market Estimates And Forecasts, By Type (2020-2032) (USD Billion)
12.2.10.4 Mexico Multi-Tenant Data Centers Market Estimates And Forecasts, By Application (2020-2032) (USD Billion)
12.2.10.5 Mexico Multi-Tenant Data Centers Market Estimates And Forecasts, By Enterprise Size (2020-2032) (USD Billion)
12.3 Europe
12.3.1 Trends Analysis
12.3.2 Eastern Europe Multi-Tenant Data Centers Market Estimates And Forecasts, By Country (2020-2032) (USD Billion)
12.3.3 Eastern Europe Multi-Tenant Data Centers Market Estimates And Forecasts, By Component (2020-2032) (USD Billion)
12.3.4 Eastern Europe Multi-Tenant Data Centers Market Estimates And Forecasts, By Industry vertical (2020-2032) (USD Billion)
12.3.5 Eastern Europe Multi-Tenant Data Centers Market Estimates And Forecasts, By Type (2020-2032) (USD Billion)
12.3.6 Eastern Europe Multi-Tenant Data Centers Market Estimates And Forecasts, By Application (2020-2032) (USD Billion)
12.3.7 Eastern Europe Multi-Tenant Data Centers Market Estimates And Forecasts, By Enterprise Size (2020-2032) (USD Billion)
12.3.8 Poland
12.3.8.1 Poland Multi-Tenant Data Centers Market Estimates And Forecasts, By Component (2020-2032) (USD Billion)
12.3.8.2 Poland Multi-Tenant Data Centers Market Estimates And Forecasts, By Industry vertical (2020-2032) (USD Billion)
12.3.8.3 Poland Multi-Tenant Data Centers Market Estimates And Forecasts, By Type (2020-2032) (USD Billion)
12.3.8.4 Poland Multi-Tenant Data Centers Market Estimates And Forecasts, By Application (2020-2032) (USD Billion)
12.3.8.5 Poland Multi-Tenant Data Centers Market Estimates And Forecasts, By Enterprise Size (2020-2032) (USD Billion)
12.3.9 Turkey
12.3.9.1 Turkey Multi-Tenant Data Centers Market Estimates And Forecasts, By Component (2020-2032) (USD Billion)
12.3.9.2 Turkey Multi-Tenant Data Centers Market Estimates And Forecasts, By Industry vertical (2020-2032) (USD Billion)
12.3.9.3 Turkey Multi-Tenant Data Centers Market Estimates And Forecasts, By Type (2020-2032) (USD Billion)
12.3.9.4 Turkey Multi-Tenant Data Centers Market Estimates And Forecasts, By Application (2020-2032) (USD Billion)
12.3.9.5 Turkey Multi-Tenant Data Centers Market Estimates And Forecasts, By Enterprise Size (2020-2032) (USD Billion)
12.3.10 Germany
12.3.10.1 Germany Multi-Tenant Data Centers Market Estimates And Forecasts, By Component (2020-2032) (USD Billion)
12.3.10.2 Germany Multi-Tenant Data Centers Market Estimates And Forecasts, By Industry vertical (2020-2032) (USD Billion)
12.3.10.3 Germany Multi-Tenant Data Centers Market Estimates And Forecasts, By Type (2020-2032) (USD Billion)
12.3.10.4 Germany Multi-Tenant Data Centers Market Estimates And Forecasts, By Application (2020-2032) (USD Billion)
12.3.10.5 Germany Multi-Tenant Data Centers Market Estimates And Forecasts, By Enterprise Size (2020-2032) (USD Billion)
12.3.11 France
12.3.11.1 France Multi-Tenant Data Centers Market Estimates And Forecasts, By Component (2020-2032) (USD Billion)
12.3.11.2 France Multi-Tenant Data Centers Market Estimates And Forecasts, By Industry vertical (2020-2032) (USD Billion)
12.3.11.3 France Multi-Tenant Data Centers Market Estimates And Forecasts, By Type (2020-2032) (USD Billion)
12.3.11.4 France Multi-Tenant Data Centers Market Estimates And Forecasts, By Application (2020-2032) (USD Billion)
12.3.11.5 France Multi-Tenant Data Centers Market Estimates And Forecasts, By Enterprise Size (2020-2032) (USD Billion)
12.3.12 UK
12.3.12.1 UK Multi-Tenant Data Centers Market Estimates And Forecasts, By Component (2020-2032) (USD Billion)
12.3.12.2 UK Multi-Tenant Data Centers Market Estimates And Forecasts, By Industry vertical (2020-2032) (USD Billion)
12.3.12.3 UK Multi-Tenant Data Centers Market Estimates And Forecasts, By Type (2020-2032) (USD Billion)
12.3.12.4 UK Multi-Tenant Data Centers Market Estimates And Forecasts, By Application (2020-2032) (USD Billion)
12.3.12.5 UK Multi-Tenant Data Centers Market Estimates And Forecasts, By Enterprise Size (2020-2032) (USD Billion)
12.3.13 Italy
12.3.13.1 Italy Multi-Tenant Data Centers Market Estimates And Forecasts, By Component (2020-2032) (USD Billion)
12.3.13.2 Italy Multi-Tenant Data Centers Market Estimates And Forecasts, By Industry vertical (2020-2032) (USD Billion)
12.3.13.3 Italy Multi-Tenant Data Centers Market Estimates And Forecasts, By Type (2020-2032) (USD Billion)
12.3.13.4 Italy Multi-Tenant Data Centers Market Estimates And Forecasts, By Application (2020-2032) (USD Billion)
12.3.13.5 Italy Multi-Tenant Data Centers Market Estimates And Forecasts, By Enterprise Size (2020-2032) (USD Billion)
12.3.14 Spain
12.3.14.1 Spain Multi-Tenant Data Centers Market Estimates And Forecasts, By Component (2020-2032) (USD Billion)
12.3.14.2 Spain Multi-Tenant Data Centers Market Estimates And Forecasts, By Industry vertical (2020-2032) (USD Billion)
12.3.14.3 Spain Multi-Tenant Data Centers Market Estimates And Forecasts, By Type (2020-2032) (USD Billion)
12.3.14.4 Spain Multi-Tenant Data Centers Market Estimates And Forecasts, By Application (2020-2032) (USD Billion)
12.3.14.5 Spain Multi-Tenant Data Centers Market Estimates And Forecasts, By Enterprise Size (2020-2032) (USD Billion)
12.3.15 Rest Of Europe
12.3.15.1 Rest Of Western Europe Multi-Tenant Data Centers Market Estimates And Forecasts, By Component (2020-2032) (USD Billion)
12.3.15.2 Rest Of Western Europe Multi-Tenant Data Centers Market Estimates And Forecasts, By Industry vertical (2020-2032) (USD Billion)
12.3.15.3 Rest Of Western Europe Multi-Tenant Data Centers Market Estimates And Forecasts, By Type (2020-2032) (USD Billion)
12.3.15.4 Rest Of Western Europe Multi-Tenant Data Centers Market Estimates And Forecasts, By Application (2020-2032) (USD Billion)
12.3.15.5 Rest Of Western Europe Multi-Tenant Data Centers Market Estimates And Forecasts, By Enterprise Size (2020-2032) (USD Billion)
12.4 Asia Pacific
12.4.1 Trends Analysis
12.4.2 Asia Pacific Multi-Tenant Data Centers Market Estimates And Forecasts, By Country (2020-2032) (USD Billion)
12.4.3 Asia Pacific Multi-Tenant Data Centers Market Estimates And Forecasts, By Component (2020-2032) (USD Billion)
12.4.4 Asia Pacific Multi-Tenant Data Centers Market Estimates And Forecasts, By Industry vertical (2020-2032) (USD Billion)
12.4.5 Asia Pacific Multi-Tenant Data Centers Market Estimates And Forecasts, By Type (2020-2032) (USD Billion)
12.4.6 Asia Pacific Multi-Tenant Data Centers Market Estimates And Forecasts, By Application (2020-2032) (USD Billion)
12.4.7 Asia Pacific Multi-Tenant Data Centers Market Estimates And Forecasts, By Enterprise Size (2020-2032) (USD Billion)
12.4.8 China
12.4.8.1 China Multi-Tenant Data Centers Market Estimates And Forecasts, By Component (2020-2032) (USD Billion)
12.4.8.2 China Multi-Tenant Data Centers Market Estimates And Forecasts, By Industry vertical (2020-2032) (USD Billion)
12.4.8.3 China Multi-Tenant Data Centers Market Estimates And Forecasts, By Type (2020-2032) (USD Billion)
12.4.8.4 China Multi-Tenant Data Centers Market Estimates And Forecasts, By Application (2020-2032) (USD Billion)
12.4.8.5 China Multi-Tenant Data Centers Market Estimates And Forecasts, By Enterprise Size (2020-2032) (USD Billion)
12.4.9 India
12.4.9.1 India Multi-Tenant Data Centers Market Estimates And Forecasts, By Component (2020-2032) (USD Billion)
12.4.9.2 India Multi-Tenant Data Centers Market Estimates And Forecasts, By Industry vertical (2020-2032) (USD Billion)
12.4.9.3 India Multi-Tenant Data Centers Market Estimates And Forecasts, By Type (2020-2032) (USD Billion)
12.4.9.4 India Multi-Tenant Data Centers Market Estimates And Forecasts, By Application (2020-2032) (USD Billion)
12.4.9.5 India Multi-Tenant Data Centers Market Estimates And Forecasts, By Enterprise Size (2020-2032) (USD Billion)
12.4.10 Japan
12.4.10.1 Japan Multi-Tenant Data Centers Market Estimates And Forecasts, By Component (2020-2032) (USD Billion)
12.4.10.2 Japan Multi-Tenant Data Centers Market Estimates And Forecasts, By Industry vertical (2020-2032) (USD Billion)
12.4.10.3 Japan Multi-Tenant Data Centers Market Estimates And Forecasts, By Type (2020-2032) (USD Billion)
12.4.10.4 Japan Multi-Tenant Data Centers Market Estimates And Forecasts, By Application (2020-2032) (USD Billion)
12.4.10.5 Japan Multi-Tenant Data Centers Market Estimates And Forecasts, By Enterprise Size (2020-2032) (USD Billion)
12.4.11 South Korea
12.4.11.1 South Korea Multi-Tenant Data Centers Market Estimates And Forecasts, By Component (2020-2032) (USD Billion)
12.4.11.2 South Korea Multi-Tenant Data Centers Market Estimates And Forecasts, By Industry vertical (2020-2032) (USD Billion)
12.4.11.3 South Korea Multi-Tenant Data Centers Market Estimates And Forecasts, By Type (2020-2032) (USD Billion)
12.4.11.4 South Korea Multi-Tenant Data Centers Market Estimates And Forecasts, By Application (2020-2032) (USD Billion)
12.4.11.5 South Korea Multi-Tenant Data Centers Market Estimates And Forecasts, By Enterprise Size (2020-2032) (USD Billion)
12.4.12 Singapore
12.4.12.1 Singapore Multi-Tenant Data Centers Market Estimates And Forecasts, By Component (2020-2032) (USD Billion)
12.4.12.2 Singapore Multi-Tenant Data Centers Market Estimates And Forecasts, By Industry vertical (2020-2032) (USD Billion)
12.4.12.3 Singapore Multi-Tenant Data Centers Market Estimates And Forecasts, By Type (2020-2032) (USD Billion)
12.4.12.4 Singapore Multi-Tenant Data Centers Market Estimates And Forecasts, By Application (2020-2032) (USD Billion)
12.4.12.5 Singapore Multi-Tenant Data Centers Market Estimates And Forecasts, By Enterprise Size (2020-2032) (USD Billion)
12.4.13 Australia
12.4.13.1 Australia Multi-Tenant Data Centers Market Estimates And Forecasts, By Component (2020-2032) (USD Billion)
12.4.13.2 Australia Multi-Tenant Data Centers Market Estimates And Forecasts, By Industry vertical (2020-2032) (USD Billion)
12.4.13.3 Australia Multi-Tenant Data Centers Market Estimates And Forecasts, By Type (2020-2032) (USD Billion)
12.4.13.4 Australia Multi-Tenant Data Centers Market Estimates And Forecasts, By Application (2020-2032) (USD Billion)
12.4.13.5 Australia Multi-Tenant Data Centers Market Estimates And Forecasts, By Enterprise Size (2020-2032) (USD Billion)
12.4.14 Rest Of Asia Pacific
12.4.14.1 Rest Of Asia Pacific Multi-Tenant Data Centers Market Estimates And Forecasts, By Component (2020-2032) (USD Billion)
12.4.14.2 Rest Of Asia Pacific Multi-Tenant Data Centers Market Estimates And Forecasts, By Industry vertical (2020-2032) (USD Billion)
12.4.14.3 Rest Of Asia Pacific Multi-Tenant Data Centers Market Estimates And Forecasts, By Type (2020-2032) (USD Billion)
12.4.14.4 Rest Of Asia Pacific Multi-Tenant Data Centers Market Estimates And Forecasts, By Application (2020-2032) (USD Billion)
12.4.14.5 Rest Of Asia Pacific Multi-Tenant Data Centers Market Estimates And Forecasts, By Enterprise Size (2020-2032) (USD Billion)
12.5 Middle East And Africa
12.5.1 Trends Analysis
12.5.2 Middle East And Africa Multi-Tenant Data Centers Market Estimates And Forecasts, By Country (2020-2032) (USD Billion)
12.5.3 Middle East And Africa Multi-Tenant Data Centers Market Estimates And Forecasts, By Component (2020-2032) (USD Billion)
12.5.4 Middle East And Africa Multi-Tenant Data Centers Market Estimates And Forecasts, By Industry vertical (2020-2032) (USD Billion)
12.5.5 Middle East And Africa Multi-Tenant Data Centers Market Estimates And Forecasts, By Type (2020-2032) (USD Billion)
12.5.6 Middle East And Africa Multi-Tenant Data Centers Market Estimates And Forecasts, By Application (2020-2032) (USD Billion)
12.5.7 Middle East And Africa Multi-Tenant Data Centers Market Estimates And Forecasts, By Enterprise Size (2020-2032) (USD Billion)
12.5.8 UAE
12.5.8.1 UAE Multi-Tenant Data Centers Market Estimates And Forecasts, By Component (2020-2032) (USD Billion)
12.5.8.2 UAE Multi-Tenant Data Centers Market Estimates And Forecasts, By Industry vertical (2020-2032) (USD Billion)
12.5.8.3 UAE Multi-Tenant Data Centers Market Estimates And Forecasts, By Type (2020-2032) (USD Billion)
12.5.8.4 UAE Multi-Tenant Data Centers Market Estimates And Forecasts, By Application (2020-2032) (USD Billion)
12.5.8.5 UAE Multi-Tenant Data Centers Market Estimates And Forecasts, By Enterprise Size (2020-2032) (USD Billion)
12.5.9 Saudi Arabia
12.5.9.1 Saudi Arabia Multi-Tenant Data Centers Market Estimates And Forecasts, By Component (2020-2032) (USD Billion)
12.5.9.2 Saudi Arabia Multi-Tenant Data Centers Market Estimates And Forecasts, By Industry vertical (2020-2032) (USD Billion)
12.5.9.3 Saudi Arabia Multi-Tenant Data Centers Market Estimates And Forecasts, By Type (2020-2032) (USD Billion)
12.5.9.4 Saudi Arabia Multi-Tenant Data Centers Market Estimates And Forecasts, By Application (2020-2032) (USD Billion)
12.5.9.5 Saudi Arabia Multi-Tenant Data Centers Market Estimates And Forecasts, By Enterprise Size (2020-2032) (USD Billion)
12.5.10 Qatar
12.5.10.1 Qatar Multi-Tenant Data Centers Market Estimates And Forecasts, By Component (2020-2032) (USD Billion)
12.5.10.2 Qatar Multi-Tenant Data Centers Market Estimates And Forecasts, By Industry vertical (2020-2032) (USD Billion)
12.5.10.3 Qatar Multi-Tenant Data Centers Market Estimates And Forecasts, By Type (2020-2032) (USD Billion)
12.5.10.4 Qatar Multi-Tenant Data Centers Market Estimates And Forecasts, By Application (2020-2032) (USD Billion)
12.5.10.5 Qatar Multi-Tenant Data Centers Market Estimates And Forecasts, By Enterprise Size (2020-2032) (USD Billion)
12.5.11 South Africa
12.5.11.1 South Africa Multi-Tenant Data Centers Market Estimates And Forecasts, By Component (2020-2032) (USD Billion)
12.5.11.2 South Africa Multi-Tenant Data Centers Market Estimates And Forecasts, By Industry vertical (2020-2032) (USD Billion)
12.5.11.3 South Africa Multi-Tenant Data Centers Market Estimates And Forecasts, By Type (2020-2032) (USD Billion)
12.5.11.4 South Africa Multi-Tenant Data Centers Market Estimates And Forecasts, By Application (2020-2032) (USD Billion)
12.5.11.5 South Africa Multi-Tenant Data Centers Market Estimates And Forecasts, By Enterprise Size (2020-2032) (USD Billion)
12.5.12 Rest Of Africa
12.5.12.1 Rest Of Africa Multi-Tenant Data Centers Market Estimates And Forecasts, By Component (2020-2032) (USD Billion)
12.5.12.2 Rest Of Africa Multi-Tenant Data Centers Market Estimates And Forecasts, By Industry vertical (2020-2032) (USD Billion)
12.5.12.3 Rest Of Africa Multi-Tenant Data Centers Market Estimates And Forecasts, By Type (2020-2032) (USD Billion)
12.5.12.4 Rest Of Africa Multi-Tenant Data Centers Market Estimates And Forecasts, By Application (2020-2032) (USD Billion)
12.5.12.5 Rest Of Africa Multi-Tenant Data Centers Market Estimates And Forecasts, By Enterprise Size (2020-2032) (USD Billion)
12.6 Latin America
12.6.1 Trends Analysis
12.6.2 Latin America Multi-Tenant Data Centers Market Estimates And Forecasts, By Country (2020-2032) (USD Billion)
12.6.3 Latin America Multi-Tenant Data Centers Market Estimates And Forecasts, By Component (2020-2032) (USD Billion)
12.6.4 Latin America Multi-Tenant Data Centers Market Estimates And Forecasts, By Industry vertical (2020-2032) (USD Billion)
12.6.5 Latin America Multi-Tenant Data Centers Market Estimates And Forecasts, By Type (2020-2032) (USD Billion)
12.6.6 Latin America Multi-Tenant Data Centers Market Estimates And Forecasts, By Application (2020-2032) (USD Billion)
12.6.7 Latin America Multi-Tenant Data Centers Market Estimates And Forecasts, By Enterprise Size (2020-2032) (USD Billion)
12.6.8 Brazil
12.6.8.1 Brazil Multi-Tenant Data Centers Market Estimates And Forecasts, By Component (2020-2032) (USD Billion)
12.6.8.2 Brazil Multi-Tenant Data Centers Market Estimates And Forecasts, By Industry vertical (2020-2032) (USD Billion)
12.6.8.3 Brazil Multi-Tenant Data Centers Market Estimates And Forecasts, By Type (2020-2032) (USD Billion)
12.6.8.4 Brazil Multi-Tenant Data Centers Market Estimates And Forecasts, By Application (2020-2032) (USD Billion)
12.6.8.5 Brazil Multi-Tenant Data Centers Market Estimates And Forecasts, By Enterprise Size (2020-2032) (USD Billion)
12.6.9 Argentina
12.6.9.1 Argentina Multi-Tenant Data Centers Market Estimates And Forecasts, By Component (2020-2032) (USD Billion)
12.6.9.2 Argentina Multi-Tenant Data Centers Market Estimates And Forecasts, By Industry vertical (2020-2032) (USD Billion)
12.6.9.3 Argentina Multi-Tenant Data Centers Market Estimates And Forecasts, By Type (2020-2032) (USD Billion)
12.6.9.4 Argentina Multi-Tenant Data Centers Market Estimates And Forecasts, By Application (2020-2032) (USD Billion)
12.6.9.5 Argentina Multi-Tenant Data Centers Market Estimates And Forecasts, By Enterprise Size (2020-2032) (USD Billion)
12.6.10 Rest Of Latin America
12.6.10.1 Rest Of Latin America Multi-Tenant Data Centers Market Estimates And Forecasts, By Component (2020-2032) (USD Billion)
12.6.10.2 Rest Of Latin America Multi-Tenant Data Centers Market Estimates And Forecasts, By Industry vertical (2020-2032) (USD Billion)
12.6.10.3 Rest Of Latin America Multi-Tenant Data Centers Market Estimates And Forecasts, By Type (2020-2032) (USD Billion)
12.6.10.4 Rest Of Latin America Multi-Tenant Data Centers Market Estimates And Forecasts, By Application (2020-2032) (USD Billion)
12.6.10.5 Rest Of Latin America Multi-Tenant Data Centers Market Estimates And Forecasts, By Enterprise Size (2020-2032) (USD Billion)
13. Company Profiles
13.1 Equinix Inc
13.1.1 Company Overview
13.1.2 Financial
13.1.3 Products/ Services Offered
13.1.4 SWOT Analysis
13.2 Digital Realty
13.2.1 Company Overview
13.2.2 Financial
13.2.3 Products/ Services Offered
13.2.4 SWOT Analysis
13.3 NTT Communications Corporation
13.3.1 Company Overview
13.3.2 Financial
13.3.3 Products/ Services Offered
13.3.4 SWOT Analysis
13.4 IBM Corporation
13.4.1 Company Overview
13.4.2 Financial
13.4.3 Products/ Services Offered
13.4.4 SWOT Analysis
13.5 Global Switch Ltd.
13.5.1 Company Overview
13.5.2 Financial
13.5.3 Products/ Services Offered
13.5.4 SWOT Analysis
13.6 CenturyLink Inc.
13.6.1 Company Overview
13.6.2 Financial
13.6.3 Products/ Services Offered
13.6.4 SWOT Analysis
13.7 Rackspace Inc.
13.7.1 Company Overview
13.7.2 Financial
13.7.3 Products/ Services Offered
13.7.4 SWOT Analysis
13.8 Iron Mountain
13.8.1 Company Overview
13.8.2 Financial
13.8.3 Products/ Services Offered
13.8.4 SWOT Analysis
13.9 Telstra International
13.9.1 Company Overview
13.9.2 Financial
13.9.3 Products/ Services Offered
13.9.4 SWOT Analysis
13.10 Eaton Corporation
13.10.1 Company Overview
13.10.2 Financial
13.10.3 Products/ Services Offered
13.10.4 SWOT Analysis
14. Use Cases and Best Practices
15. Conclusion
An accurate research report requires proper strategizing as well as implementation. There are multiple factors involved in the completion of good and accurate research report and selecting the best methodology to compete the research is the toughest part. Since the research reports we provide play a crucial role in any company’s decision-making process, therefore we at SNS Insider always believe that we should choose the best method which gives us results closer to reality. This allows us to reach at a stage wherein we can provide our clients best and accurate investment to output ratio.
Each report that we prepare takes a timeframe of 350-400 business hours for production. Starting from the selection of titles through a couple of in-depth brain storming session to the final QC process before uploading our titles on our website we dedicate around 350 working hours. The titles are selected based on their current market cap and the foreseen CAGR and growth.
The 5 steps process:
Step 1: Secondary Research:
Secondary Research or Desk Research is as the name suggests is a research process wherein, we collect data through the readily available information. In this process we use various paid and unpaid databases which our team has access to and gather data through the same. This includes examining of listed companies’ annual reports, Journals, SEC filling etc. Apart from this our team has access to various associations across the globe across different industries. Lastly, we have exchange relationships with various university as well as individual libraries.
Step 2: Primary Research
When we talk about primary research, it is a type of study in which the researchers collect relevant data samples directly, rather than relying on previously collected data. This type of research is focused on gaining content specific facts that can be sued to solve specific problems. Since the collected data is fresh and first hand therefore it makes the study more accurate and genuine.
We at SNS Insider have divided Primary Research into 2 parts.
Part 1 wherein we interview the KOLs of major players as well as the upcoming ones across various geographic regions. This allows us to have their view over the market scenario and acts as an important tool to come closer to the accurate market numbers. As many as 45 paid and unpaid primary interviews are taken from both the demand and supply side of the industry to make sure we land at an accurate judgement and analysis of the market.
This step involves the triangulation of data wherein our team analyses the interview transcripts, online survey responses and observation of on filed participants. The below mentioned chart should give a better understanding of the part 1 of the primary interview.
Part 2: In this part of primary research the data collected via secondary research and the part 1 of the primary research is validated with the interviews from individual consultants and subject matter experts.
Consultants are those set of people who have at least 12 years of experience and expertise within the industry whereas Subject Matter Experts are those with at least 15 years of experience behind their back within the same space. The data with the help of two main processes i.e., FGDs (Focused Group Discussions) and IDs (Individual Discussions). This gives us a 3rd party nonbiased primary view of the market scenario making it a more dependable one while collation of the data pointers.
Step 3: Data Bank Validation
Once all the information is collected via primary and secondary sources, we run that information for data validation. At our intelligence centre our research heads track a lot of information related to the market which includes the quarterly reports, the daily stock prices, and other relevant information. Our data bank server gets updated every fortnight and that is how the information which we collected using our primary and secondary information is revalidated in real time.
Step 4: QA/QC Process
After all the data collection and validation our team does a final level of quality check and quality assurance to get rid of any unwanted or undesired mistakes. This might include but not limited to getting rid of the any typos, duplication of numbers or missing of any important information. The people involved in this process include technical content writers, research heads and graphics people. Once this process is completed the title gets uploader on our platform for our clients to read it.
Step 5: Final QC/QA Process:
This is the last process and comes when the client has ordered the study. In this process a final QA/QC is done before the study is emailed to the client. Since we believe in giving our clients a good experience of our research studies, therefore, to make sure that we do not lack at our end in any way humanly possible we do a final round of quality check and then dispatch the study to the client.
Key Segments:
By Component
Solutions
Services
By Type
Retail Colocation
Wholesale Colocation
By Enterprise Size
SME
Large enterprises
By Application
Public Cloud
Private Cloud
By Industry vertical
BFSI
Healthcare
Government & Defense
IT & Telecom
Retail
Manufacturing
Others
Request for Segment Customization as per your Business Requirement: Segment Customization Request
Regional Coverage:
North America
US
Canada
Mexico
Europe
Germany
France
UK
Italy
Spain
Poland
Turkey
Rest of Europe
Asia Pacific
China
India
Japan
South Korea
Singapore
Australia
Rest of Asia Pacific
Middle East & Africa
UAE
Saudi Arabia
Qatar
South Africa
Rest of Middle East & Africa
Latin America
Brazil
Argentina
Rest of Latin America
Request for Country Level Research Report: Country Level Customization Request
Available Customization
With the given market data, SNS Insider offers customization as per the company’s specific needs. The following customization options are available for the report:
Detailed Volume Analysis
Criss-Cross segment analysis (e.g. Product X Application)
Competitive Product Benchmarking
Geographic Analysis
Additional countries in any of the regions
Customized Data Representation
Detailed analysis and profiling of additional market players
The Cloud Adoption in GCC Market was USD 40.7 billion in 2023 and is expected to reach USD 158.8 Billion by 2032, growing at a CAGR of 14.77% by 2024-2032.
LTE and 5G Broadcast Market was valued at USD 786.8 Million in 2023 and Will reach USD 1828.05 Million by 2032, growing at a CAGR of 9.83% By 2032.
Precision Forestry Market Size was valued at USD 5.40 billion in 2023 and will reach USD 11.72 billion by 2032 and grow at a CAGR of 9.1% by 2032.
The Business Intelligence (BI) software Market size was valued at USD 35.85 billion in 2023 and will grow to USD 112.4 billion and CAGR of 13.6 % by 2032.
Content Intelligence Market was valued at USD 1.54 billion in 2023 and is expected to reach USD 17.59 billion by 2032, growing at a CAGR of 31.15% from 2024-2032.
The Security Orchestration, Automation, and Response (SOAR) Market Size was valued at USD 1.5 Billion in 2023 and is expected to reach USD 5.5 Billion by 2032, growing at a CAGR of 15.5% over the forecast period 2024-2032.
Hi! Click one of our member below to chat on Phone