Telecom Billing and Revenue Management Market Report Scope & Overview:
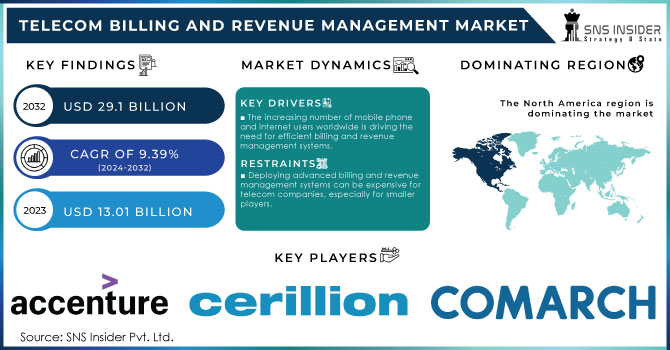
The Telecom Billing and Revenue Management Market was valued at USD 17.24 billion in 2023 and is expected to reach USD 43.03 billion by 2032, growing at a CAGR of 10.73% over the forecast period 2025-2032.
Get more information on Telecom Billing and Revenue Management Market - Request Sample Report
Average billing cycle time reduction was one of the key areas of focus with telecom billing systems as operators aimed at lower billing cycle times for more rapid payment processing. Billing error rates were limited using advanced automation and AI technologies that led to higher accuracy in the invoices which led to reduced customer complaints. We are witnessing a significant move towards billing automation, with more and more telecom operators deploying AI and robotic solution-driven billing to enliven their billing. Telecom companies also improved their fraud detection capabilities, deploying advanced analytics and machine learning algorithms to minimize revenue leakage and improve detection of fraudulent activities.
Market Dynamics
Key Drivers:
-
Rising Mobile Subscriptions and Cloud Adoption Fuel Growth in Telecom Billing and Revenue Management Market
Increasing mobile subscriptions, rapid adoption of cloud-based solutions, and growing demand for real-time customer billing are some of the major factors expected to drive the growth of global telecom billing and revenue management market over the forecast period. With greater complexity in 5G networks and IoT connectivity comes the need for more sophisticated billing, which could serve as a strong growth driver for the market. Furthermore, regulations and the necessity for fraud detection provide the impetus for investing in extensive revenue management systems. In addition, the increasing penetration of digital services including OTT and mobile banking also drives the demand.
Restrain:
-
High Capital Costs and Integration Challenges Hinder Growth of Telecom Billing and Revenue Management Market
High upfront capital and operational costs due to the implementation of advanced billing solution, and availability of open-source billing solution are restraining the growth of this market. The high-cost nature of the telecom business creates a huge financial burden on operators, especially in the small-mid segment, to migrate from legacy systems to next-gen systems that are optimised for an automated environment. Furthermore, integration challenges with current IT infrastructure and multiple other 3rd part applications are also difficult to manage. This takes time and effort to enable interoperability between billing systems, CRM, and network management tools to function smoothly which ultimately results in implementation delays and higher costs.
Opportunity:
-
5G IoT Adoption and Cloud Solutions Create Profitable Opportunities in Telecom Billing and Revenue Management
Due to 5G & IoT adoption and cloud telecom billing solution, there are great market growth opportunities in the telecom billing and revenue management market. Wireless, fibre, fixed-line operators must also be able to capitalise on growing demand for real-time billing, Robo and AI based analytics to improve efficiencies and customer experience. New monetization channels: Evolving digital services like mobile payments, OTT and subscription-based model enable new revenue streams. Moreover, growing telecom infrastructure in developing areas and the transition to converging billing systems represent profitable opportunities.
Challenges:
-
Cyber Threats Fraud Risks and Evolving Services Challenge Telecom Revenue Management in Digital Landscape
Telecom revenue management is also grappling with the problems of a much higher risk of cyber threats and fraud. As more and more operators migrate to cloud billing solutions, security vulnerabilities are one of the biggest concerns as they manage sensitive customer data and financial transactions. Telecom service providers constantly face cyber threats where number of data breaches and leakage of revenue due to frauds like SIM cloning and account takeovers can lead to huge potential loss of money and tarnishing the reputation of the organization. Besides, the emergence of telecom services like 5G and IoT in the ever-evolving digital landscape pose a continuous challenge of innovating subscription billing models to keep pace with the demands of the consumers, forcing operators to adapt their services in real-time.
Segment Analysis
By Solution
In 2023, software dominated the telecom billing and revenue management market with a 62.3% of share, owing to the necessity of having software to automate the complexity of billing processes, support the real-time processing of large transaction volumes, and sustain new business models. Telecom operators have been increasingly driven towards software solution as they need to seamlessly integrate with the existing telecom infrastructure and also provide instant billing and data. Software, being scalable, flexible, efficient, a natural choice for large style telecoms to drive many operations, and thus the reason for market overview.
Services are anticipated to have the highest CAGR during the forecast period (2024-2032) as telecom operators look to streamline and tailor their billing systems. As technology such as 5G, IoT, cloud computing is rapidly advancing, telecom companies need focused consulting, implementation & maintenance services for smooth integration and operation. The growing complexity of the telecom services and also the requirement for checking regulation and detecting fraud, increases the demand for these services. Moreover, the growing adoption of managed services by operators to lower costs, enable better scalability, and improve customer experience will also continue to aid the growth of the services segment.
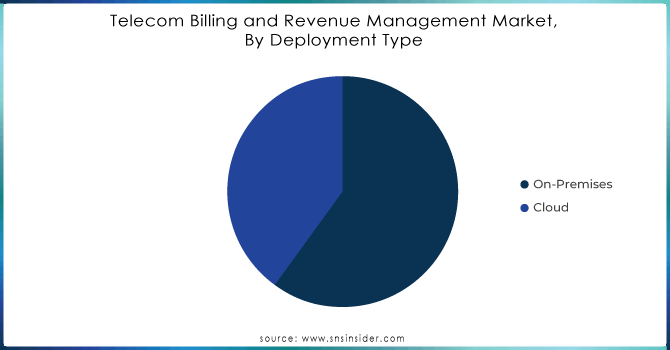
By Deployment Type
In 2023, on-premises deployment dominated the telecom billing and revenue management market with a 65.8% of share, due to its proven security features, control over infrastructure, systems can be customized as per specific organization needs, etc. On-premises solutions are a favorite of telecom operators, especially large enterprises, since they provide full control over data and compliance with strict regulatory requirements. Given the classification and sensitivity of the data and the legacy infrastructure that operators have, on-premises systems offer a higher level of security, reliability, and data sovereignty.
The cloud-based solutions are projected to witness the fastest CAGR growth from 2024-2032, attributed to a rising demand for scalability, flexibility, and cost-effectiveness. With the cloud, telecom operators now can now lower the capital expenditure burden and depreciating their set upon maintenance cost by switching to a subscription-based model. Telecoms need more agile billing systems that can meet multiple dynamic demands with ease capabilities that are a breeze to provide in the cloud as 5G and IoT grow. It also offers attractiveness for operators to migrate to the cloud offering real-time data analytics, AI integration, and faster deployment times to expedite operations and improve customer experience.
By Telecom Operator
In 2023, mobile operators dominated the telecom billing and revenue management market with a 61.7% of share. This is primarily attributed to the number of mobile subscriptions worldwide being in the billions, alongside the rising need for data services. The mobile operator is always at large scale, real-time data consumption and complex pricing, hence need an advanced billing system running in the background. The rise of 5G and explosive mobile data traffic growth underscores the need for sophisticated billing and revenue management solutions that ensure accurate billing, revenue assurance and customer satisfaction to maintain operator dominance in the market.
The Internet Service Provider segment is projected to witness the fastest CAGR during the forecast period from 2024 to 2032, due to the penetration of broadband and fiber-optic services. With the number of people and businesses using high-speed internet and data-consuming applications, ISPs need billing solutions that scale subscription-based services, tiered pricing models, and customer segmentation. Moreover, digital services such as OTT, cloud, and e-commerce demand continuous and high-speed internet, making ISPs migrate towards flexible and scalable revenue management systems. As ISPs continue their digital transformation with the provision of next-generation services, continued growth of billing and revenue management solutions in ISPs is to be expected over the next several years.
Need any customization research on Telecom Billing and Revenue Management Market - Enquiry Now
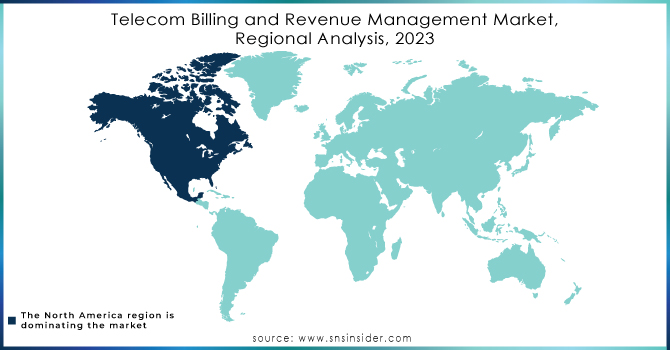
Regional Analysis
North America accounted for 32.4% share in the telecom billing & revenue management market in 2023, due to presence of large telecom service providers such as Verizon, AT&T, T-Mobile, and others. To service a large subscriber base and envisage a differentiated offering, these operators have heavily focused on advanced billing solutions. The advanced pricing models that can charge customers on the basis of complex, real-time data usage and dynamic pricing models necessitating sophisticated billing systems has spurred the demand for sophisticated billing systems in North America, as this region has been leading in the early adoption of 5G, cloud computing, and IoT technologies. Moreover, the regulatory compliance like CCPA and GDPR mandate a strong revenue management solution which leads North America to dominate the market.
The Asia Pacific region is anticipated to experience the fastest growth in the CAGR period of 2024-2032. Cloud-based billing and revenue management systems are being deployed by telecom operators in this region to manage the scale and complexity of their operations as mobile services and broadband continue to penetrate this market, further supported by the emergence of IoT and 5G. Next-gen Billing solutions are being leveraged to enhance customer experience and enable new pricing models in countries such as China, India with companies such as China Mobile, Bharti Airtel, Japan, NTT Group, etc. Telecom Billing Market by Geography (APAC, Europe, MEA, North America, and South America) The increasing middle class, urbanization, and providing internet services in this region offer enormous opportunities for telecom billing growth.
Key players
Some of the major players in the Telecom Billing and Revenue Management Market are:
-
Amdocs (SmartBSS, Amdocs Optima)
-
Ericsson (Ericsson Charging System, Ericsson Revenue Management)
-
Huawei (Billing and Revenue Management, Huawei CloudBSS)
-
Nokia (Cloud Billing, Nokia Revenue Management)
-
CSPi (Access Management, CSPi’s Telecom Billing Solution)
-
Subex (Revenue Assurance, Fraud Management)
-
Comarch (Comarch BSS, Comarch Billing)
-
Tech Mahindra (Revenue Assurance, Cloud Billing Solutions)
-
Tata Consultancy Services (TCS) (BSS Suite, TCS Billing Platform)
-
ZTE Corporation (ZTE Billing, ZTE Revenue Management)
-
NEC Corporation (Billing Solutions, Revenue Management Solutions)
-
Redknee Solutions (Redknee Unified, Redknee Billing)
-
Optiva (Optiva Billing and Revenue Management, Optiva Digital Charging)
-
BSS/OSS Corporation (BSS/OSS Suite, Telecom Billing Systems)
-
Aria Systems (Cloud Billing, Subscription Management)
-
Vubiquity (Billing Solutions, Video Content Monetization)
-
Intec Systems (InterconnecT, Intec Billing Solution)
-
Matrixx Software (Matrixx Charging, Matrixx Revenue Management)
-
BillingPlatform (BillingPlatform, Revenue Recognition)
-
Capgemini (Revenue Assurance, BSS Solutions)
Recent Trends
-
In August 2024, Ericsson and Wipro have transformed Odido's billing experience by migrating 5 million customers to a cloud-native billing platform, enhancing customer service and operational efficiency.
-
In April 2024, KPN and Comarch expanded their 16-year partnership with a new five-year agreement, focusing on SaaS solutions and innovation. The collaboration aims to improve data quality, reduce customer complaints, and accelerate invoice payments.
| Report Attributes | Details |
|---|---|
| Market Size in 2023 | USD 17.24 Billion |
| Market Size by 2032 | USD 43.03 Billion |
| CAGR | CAGR of 10.73% From 2024 to 2032 |
| Base Year | 2023 |
| Forecast Period | 2024-2032 |
| Historical Data | 2020-2022 |
| Report Scope & Coverage | Market Size, Segments Analysis, Competitive Landscape, Regional Analysis, DROC & SWOT Analysis, Forecast Outlook |
| Key Segments | • By Solution (Software, Mediation, Services) • By Deployment Type (On-Premises, Cloud) • By Telecom Operator (Mobile Operators, Internet Service Providers (ISPs)) |
| Regional Analysis/Coverage | North America (US, Canada, Mexico), Europe (Eastern Europe [Poland, Romania, Hungary, Turkey, Rest of Eastern Europe] Western Europe] Germany, France, UK, Italy, Spain, Netherlands, Switzerland, Austria, Rest of Western Europe]), Asia Pacific (China, India, Japan, South Korea, Vietnam, Singapore, Australia, Rest of Asia Pacific), Middle East & Africa (Middle East [UAE, Egypt, Saudi Arabia, Qatar, Rest of Middle East], Africa [Nigeria, South Africa, Rest of Africa], Latin America (Brazil, Argentina, Colombia, Rest of Latin America) |
| Company Profiles | Informatica, Oracle, IBM, Collibra, Alation, SAP, Atlan, Erwin, Alex Solutions, Data3Sixty, Infogix, Adaptive, Orion Governance, Dataedo, Microsoft, Talend, Alteryx, Trifacta, MANTA, OvalEdge. |
Get in Touch
