Augmented and Virtual Reality Contact Lenses Market Report Scope & Overview:
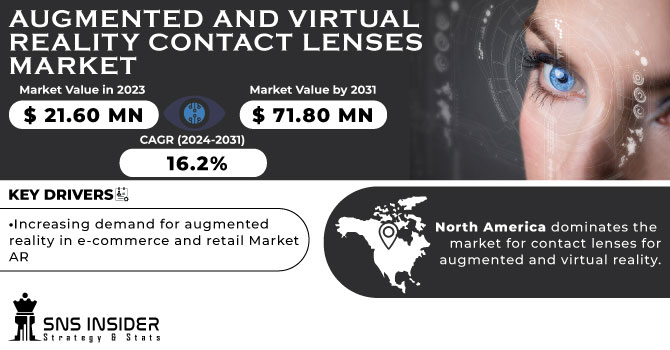
The Augmented and Virtual Reality Contact Lenses Market size was valued at USD 21.60 Million in 2023 and is expected to grow to USD 71.80 Million by 2031 and grow at a CAGR of 16.2 % over the forecast period of 2024-2031.
These lenses are utilized for collaborative experiences in the education sector as well as interactive experiences in the entertainment sector, such as streaming a concert. Mobile applications can employ the lenses for a variety of purposes, including navigation, gaming, education, and healthcare. The market for augmented and virtual reality contact lenses would grow as a result of all these causes.
To Get More Information on Augmented and Virtual Reality Contact Lenses Market - Request Sample Report
The market for augmented and virtual reality contact lenses will be led by the AR contact lens category. The augmented reality market, which is expected to reach US$ 61.39 Bn in 2023, is supporting the AR contact lens market and is expanding quickly. The market for augmented contact lenses is expanding as a result of rising investments from major technological companies. An expanding prospect in the enterprise sector, significant growth in the travel and tourism sector, and increased demand for augmented reality architecture are all contributing to the growth of the AR contact lens market.
MARKET DYNAMICS
KEY DRIVERS:
-
Increasing demand for augmented reality in e-commerce and retail Market AR
Due to the pandemic, online purchasing has suddenly become more popular. Since many websites' return policies were disabled during the pandemic, virtual try-ons for jewelry and cosmetics helped shoppers decide if the product was right for them.
They really fit the merchandise. Their shopping convenience was aided by this. The convenience will result in higher demand in this industry, which would support the market expansion for augmented reality. Augmented reality technologies help to boost consumer satisfaction.
RESTRAIN:
-
There are health risks linked with the excessive use of augmented reality technology.
Games for the augmented reality (AR) market are more involved and keep the player immersed in the game for longer hours, which can lead to problems like anxiety, eye strain, obesity, and lack of attention. Devices were used in experiments by researchers from the National Toxicology Program (NTP), an interagency federal program run by the National Health Institutes (US).
OPPORTUNITY:
-
Uses Of Augmented Reality
There are a ton of chances in enterprise applications. Large-scale expenditures made by businesses in smart manufacturing will be a key factor in the corporate sector's growth in the AR market. Companies with plants in many locations can adopt AR and hire a few engineers to oversee a big setup.
CHALLENGES:
-
Increasing the use of HMDs in virtual reality training
Devices and technologies for virtual reality can be utilized to monitor the factory's workflow, assuring timely activities and production.
The supervisor can use virtual reality technology to protect the safety of the employees by tracking their whereabouts and receiving alerts for potentially hazardous areas. With the use of VR, a manager or supervisor in a factory or industry can also lead training sessions for the employees.
IMPACT OF RUSSIA-UKRAINE WAR
Several months after the start of the Russia-Ukraine War, the ICT industry has been impacted by supply chain interruptions, changes in demand in Eastern Europe, and sanctions against Russia. Many Western technology companies have either closed their headquarters in Russia or suspended operations and sales there, eliminating millions of dollars worth of tech spending there in 2022. Russia will need to become independent and rely on domestic companies or new alliances to get technology items as the Russia-Ukraine War has left it cut off. On the other side, technology for human augmentation has shown to be essential for programs that identify people and visualize conflict information.
The Quarterly Augmented and Virtual Reality Headset Tracker predicts that $220 million less will be spent on AR headsets in 2022 as a result of companies leaving the Russian market. This gap in spending will take a few years to close.
KEY MARKET SEGMENTATION
By Technology
-
AR technology
-
Marker-based AR technology
-
Active marker
-
Passive marker
-
-
Marker less AR technology
-
Model-base tracking
-
Image processing-based tracking
-
Anchor-based AR
-
-
-
VR Technology
-
Non-immersive technology
-
Semi-immersive and fully immersive technology
-
By Offerings
-
Hardware
-
Sensors
-
Accelerometers
-
Gyroscopes
-
Magnetometers
-
-
Semiconductor components
-
Controllers and processors
-
Integrated Circuits
-
-
Display and projectors
-
Position trackers
-
Cameras
-
Others
-
Computers
-
Video generators and combiners
-
-
-
Software
-
Software development kits
-
Cloud-based services
-
By Device
-
AR devices
-
Head-mounted displays
-
AR smart glasses
-
Smart helmets
-
-
-
VR devices
-
Head-mounted displays
-
Gesture-tracking devices
-
Displays and projectors
-
By Enterprise
-
Small Enterprise
-
Medium enterprise
-
Large enterprise
By Application
-
Consumer
-
Gaming
-
Sports
-
Entertainment
-
Theme parks
-
Museums
-
Art exhibitions and galleries
-
-
-
Commercial
-
Retail and e-commerce
-
Beauty and cosmetics
-
Apparel fitting
-
Jewellery
-
Grocery shopping
-
Footwear
-
Furniture
-
-
Travel and tourism
-
E-learning
-
-
Enterprise
-
Manufacturing
-
-
Healthcare
-
Surgery
-
Fitness management
-
Patient care management
-
Pharmacy management
-
Medical training and education
-
Radiology
-
-
Aerospace and Defence
-
Automotive
-
Energy
-
Others
-
Construction
-
Agriculture
-
Telecom/IT services
-
Transportation and Logistics
-
Public Safety
-
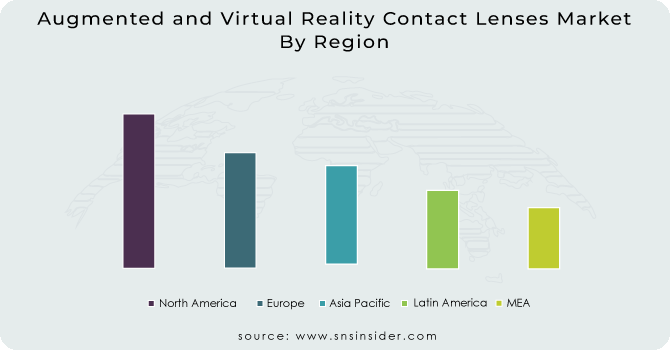
REGIONAL ANALYSIS
North America dominates the market for contact lenses for augmented and virtual reality. The market in this area is primarily driven by the increased use of AR and VR technology and increased R&D spending by major competitors.
The Asia Pacific is expected to grow at the fastest growth rate. In supported by a rising number of technology users in the region, particularly in developing nations like China and India. Additionally, the area will experience industrial growth due to new technology developments, which will further propel the market for contact lenses for augmented and virtual reality. These variables will cause Asia Pacific to experience the highest CAGR of any region during the projection period.
Do You Need any Customization Research on Augmented and Virtual Reality Contact Lenses Market - Enquire Now
REGIONAL COVERAGE:
North America
-
US
-
Canada
-
Mexico
Europe
-
Eastern Europe
-
Poland
-
Romania
-
Hungary
-
Turkey
-
Rest of Eastern Europe
-
-
Western Europe
-
Germany
-
France
-
UK
-
Italy
-
Spain
-
Netherlands
-
Switzerland
-
Austria
-
Rest of Western Europe
-
Asia Pacific
-
China
-
India
-
Japan
-
South Korea
-
Vietnam
-
Singapore
-
Australia
-
Rest of Asia Pacific
Middle East & Africa
-
Middle East
-
UAE
-
Egypt
-
Saudi Arabia
-
Qatar
-
Rest of Middle East
-
-
Africa
-
Nigeria
-
South Africa
-
Rest of Africa
-
Latin America
-
Brazil
-
Argentina
-
Colombia
-
Rest of Latin America
KEY PLAYERS
The major players are Google, Microsoft, Sony Corporation, Samsung Electronics, HTC, Apple Inc., PTC Inc., Seiko Epson, Oculus VR (by Facebook), Lenovo and other players are listed in a final report.
Samsung Electronics (South Korea)-Company Financial Analysis
RECENT DEVELOPMENTS
-
Viveverse, a cross-platform metaverse that is an open-source VR metaverse made up of multiple interactive environments, apps, and games, was introduced by HTC Vive in February 2022. It makes it possible for consumers to switch between different platforms like Vive Sync and Engage.
-
Sony improved an already-existing VR headgear, the PSVR headset, in January 2022. Since the PSVR headset will be directly connected to the PlayStation 5 console, Sony said that it developed it for a better virtual reality experience in PlayStation.
-
HTC released a wrist tracker for the Vive Focus 3 in January 2022. This wearable device aids in tracking by infrared LEDs that are detected optically by the device's built-in camera sensors. Even if the tracker is not visible to the camera, its velocity and trajectory can still be tracked employing advanced kinetic models and high frequency IMU data
-
The development of AR smart glasses, which add more information, animation, videos, and more realistic experiences to users by superimposing computer-generated or digital information on users' actual surroundings, was announced by Google in December 2021.
| Report Attributes | Details |
| Market Size in 2023 | US$ 21.60 Mn |
| Market Size by 2031 | US$ 71.80 Mn |
| CAGR | CAGR of 16.2% From 2024 to 2031 |
| Base Year | 2023 |
| Forecast Period | 2024-2031 |
| Historical Data | 2020-2022 |
| Report Scope & Coverage | Market Size, Segments Analysis, Competitive Landscape, Regional Analysis, DROC & SWOT Analysis, Forecast Outlook |
| Key Segments | • By Technology (AR technology, VR Technology) • By Offerings (Hardware, Software) • By Device (AR devices, VR devices) • By Enterprise (Small enterprise, medium enterprise, large enterprise) • By Application (Consumer, Commercial, Enterprise, Manufacturing, Healthcare, Aerospace and Defence, Automotive, Energy, Others) |
| Regional Analysis/Coverage | North America (US, Canada, Mexico), Europe (Eastern Europe [Poland, Romania, Hungary, Turkey, Rest of Eastern Europe] Western Europe] Germany, France, UK, Italy, Spain, Netherlands, Switzerland, Austria, Rest of Western Europe]). Asia Pacific (China, India, Japan, South Korea, Vietnam, Singapore, Australia, Rest of Asia Pacific), Middle East & Africa (Middle East [UAE, Egypt, Saudi Arabia, Qatar, Rest of Middle East], Africa [Nigeria, South Africa, Rest of Africa], Latin America (Brazil, Argentina, Colombia Rest of Latin America) |
| Company Profiles | Google (US), Microsoft (US), Sony Corporation (Japan), Samsung Electronics (South Korea), HTC (Taiwan), Apple Inc., (US), PTC Inc., (US), Seiko Epson (Japan), Oculus VR (by Facebook (US), Lenovo (China) |
| Key Drivers | • Increasing demand for augmented reality in e-commerce and retail Market AR |
| Market Restraints | • There are health risks linked with excessive use of augmented reality technology. |
Get in Touch
