Mobile Augmented Reality (AR) Market Size & Growth:
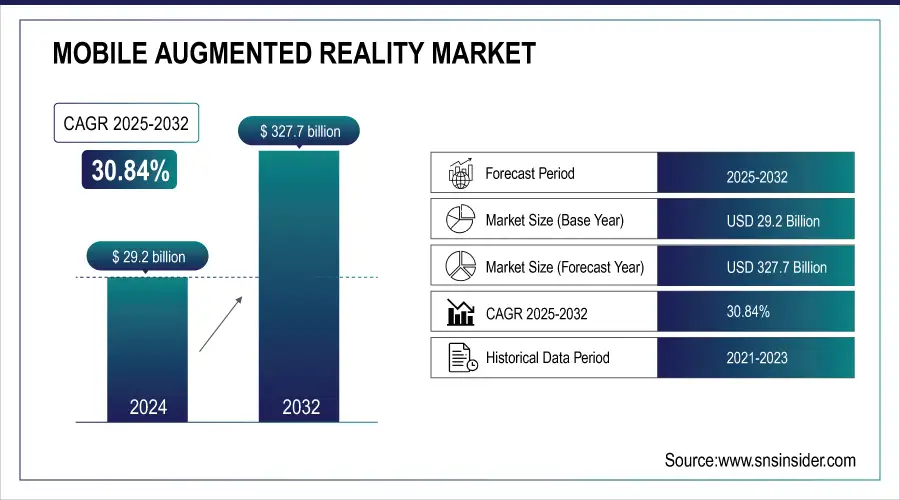
The Mobile Augmented Reality Market size was valued at USD 29.2 Billion in 2024 and is expected to reach USD 327.7 Billion by 2032, growing at a CAGR of 30.84% from 2025-2032. The Mobile Augmented Reality Market saw strong wafer production in Asia-Pacific, with fabs operating at high utilization rates, focusing on advanced nodes (5nm & below) to meet AR chip demand. Chip design trends are shifting toward AI integration and enhanced GPU performance for real-time AR experiences. While supply chain challenges, including chip shortages, impacted the market, strategic partnerships and localized production helped stabilize supply. The report also covers market sizing, competitive landscape, key players' strategies, technological advancements, regulatory aspects, end-user adoption trends, and future growth opportunities.
To Get more information on Mobile Augmented Reality Market - Request Free Sample Report
Mobile AR Market Size and Forecast:
-
Market Size in 2024: USD 29.2 Billion
-
Market Size by 2032: USD 327.7 Billion
-
CAGR: 30.84% from 2025 to 2032
-
Base Year: 2024
-
Forecast Period: 2025–2032
-
Historical Data: 2020–2022
Mobile Augmented Reality Market Drivers:
-
The growing use of AR in gaming, retail, healthcare, and social media is driving market expansion.
The growing penetration of AR technology with mobile devices is a major catalyst for market expansion. AR gaming, for example, Pokémon GO, remains widely popular with millions of users, while AR-powered e-commerce enables virtual try-ons, leading to improved customer experience and increased sales. AR finds its applications in healthcare for diagnostics, medical training, and remote surgeries. Social media apps integrate AR filters and virtual avatars for user engagement. Investor interest and the development of AR software and hardware by major tech corporations like Apple, Google, Meta, etc., are speeding up the expansion of the AR market, bringing mobile AR to a higher level of detail and accessibility.
Mobile Augmented Reality Market Restraints:
-
AR requires advanced hardware and high development costs, limiting its accessibility.
High cost and performance restrictions of AR-ready devices are one of the main hindrances to mobile AR use. Features like powerful processors required to run AR applications, high-resolution cameras, and AI-driven functionalities push the AR-enabled smartphone prices further up. Furthermore, Augmented Reality rendering needs specific skills in 3D model creation, real-time rendering, and Artificial intelligence, which in itself makes the content creation costly. Small businesses and startups usually cannot afford to spend on AR-based applications due to high expenditure. Additionally, mobile AR hardware is particularly cost-sensitive, and the continuous need for hardware upgrades and enhancements makes AR-capable smartphone models a slow crawl toward ubiquity.
Mobile Augmented Reality Market Opportunities:
-
The expansion of 5G and edge computing enhances real-time AR experiences.
With 5G and the availability of new edge computing resources, mobile AR can reach new heights. With ultra-low latency, high bandwidth, and higher data transmission speed, 5G leads to seamless and immersive augmented reality experiences. Data processing using Edge Computing can be done in real-time, closer to the user, reducing mobile device hardware dependency and latency and improving performance. They facilitate multiplayer AR gaming, virtual assistance in real-time, and industrial AR applications. Mobile AR will improve as 5G coverage and edge infrastructure increase worldwide. Telecom companies begin to broaden coverage, and it will be made available to a broader and deeper audience across industries.
Mobile Augmented Reality Market Challenges:
-
AR applications collect vast user data, raising privacy and cybersecurity risks.
This includes the accessing of user data such as location, appearance, and surrounding environment, which gives rise to privacy issues surrounding the use of AR applications. Such practices make it vulnerable for users and businesses at considerable risk through unauthorized data collection, cyber threats, and data breaches. Regulatory frameworks such as GDPR and CCPA impose increasingly stringent data protection policies, compelling an improvement in security policies by AR developers. Cybersecurity challenges are also raised by phishing attacks based on the AR environment, digital manipulation, and unauthorized access to the AR environment. To avoid these concerns, encrypted data transmission, transparent privacy policies, and AI-powered security solutions must be implemented to earn our trust and promote mass adoption of AR technology.
Mobile Augmented Reality Market Segmentation Analysis:
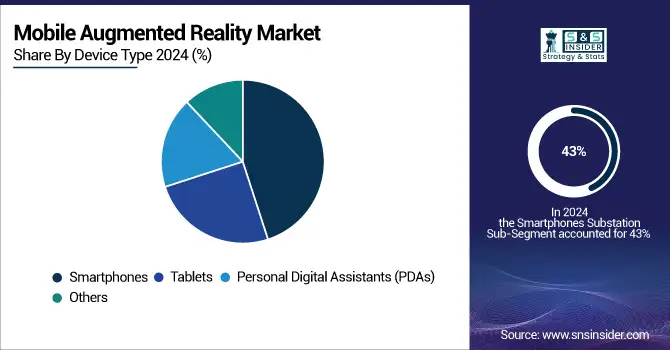
By Device Type, Smartphones Dominate Market Share as Wearables Drive Rapid CAGR
The smartphone segment held the largest market share in 2024, estimated at 43%, due to the widespread availability of AR-capable smartphones and growing consumer adoption. Companies like Apple, Samsung, and Google are integrating AR-specific hardware, including LiDAR sensors and high-performance GPUs, enhancing gaming, virtual shopping, navigation, and social media AR experiences. The expansion of 5G connectivity further supports real-time rendering and cloud-based AR applications, increasing user engagement. The PDAs/wearable AR devices segment is projected to achieve the fastest CAGR of 34% during 2025–2032, driven by adoption in healthcare, logistics, and enterprise applications. AR-enabled smart glasses and head-mounted displays enable hands-free operation, remote collaboration, and real-time data visualization, particularly in industrial AR, manufacturing, and field services.
By Component, Hardware Leads Revenue While Software Registers Fastest Growth in AR Market
The hardware segment dominated the Mobile Augmented Reality Market in 2024, accounting for an estimated 56% share of revenue. This dominance is driven by widespread adoption of AR-enabled smartphones, smart glasses, and headsets. Key hardware components such as 3D cameras, sensors, LiDAR, AI-driven AR chips, and high-end GPUs enable high-quality AR experiences at scale. Leading technology companies like Apple, Google, and Qualcomm continue to invest heavily in AR hardware, pushing innovation and expanding utility across consumer and enterprise applications. The software segment is expected to register the fastest CAGR of 32% from 2025 to 2032, driven by rising demand for AR development platforms, SDKs, and AI-powered AR applications. Growth is fueled by AR-based gaming, social media filters, virtual try-ons, and enterprise solutions. Emerging technologies such as Cloud-based AR, AR-as-a-Service, and WebAR are further accelerating software adoption.
By Application, Consumer Segment Leads Revenue, Healthcare Expected to Grow Fastest
The consumer segment dominated the market in 2024, capturing an estimated 51% of revenue, due to high adoption of AR in gaming, social media, and e-commerce. Popular applications like Pokémon GO, Instagram AR filters, and virtual try-on features for online shopping enhance user engagement. AR-enabled smartphones, coupled with 5G and AI-powered AR, provide highly interactive real-time experiences. The healthcare segment is expected to record the fastest CAGR of 33% from 2025 to 2032, driven by AR applications in medical training, remote surgeries, diagnostics, and patient care. AR-powered surgical visualization, augmented diagnostics, and therapy applications are revolutionizing healthcare delivery, enabling doctors to perform complex procedures with 3D guidance while improving patient understanding and engagement.
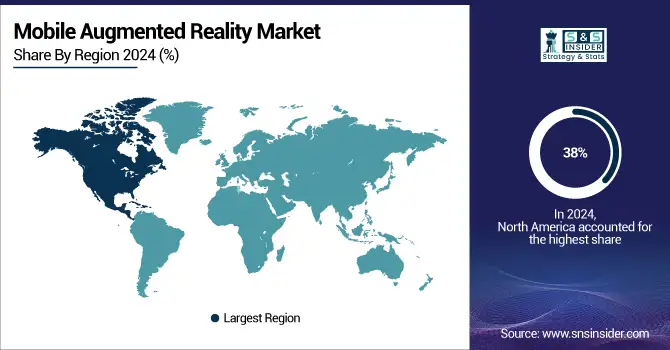
North America Dominates Mobile Augmented Reality Market in 2024
In 2024, North America commands an estimated 38% share of the Mobile Augmented Reality Market, establishing its leadership position. The region’s dominance is driven by strong adoption of AR-enabled smartphones, extensive 5G networks, and substantial investments in AR software and hardware development, which accelerate market growth.
Get Customized Report as per Your Business Requirement - Enquiry Now
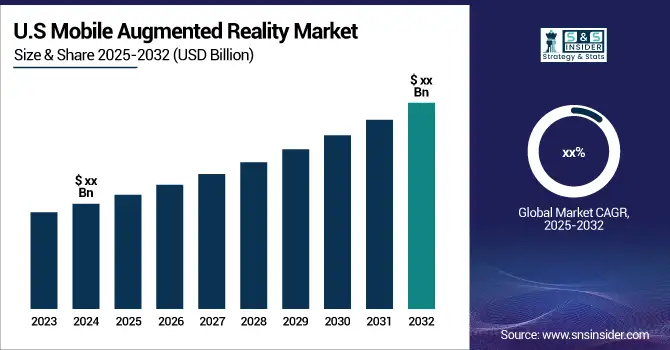
United States Leads North America’s Mobile AR Market
The United States dominates due to its advanced technology ecosystem, high consumer smartphone penetration, and leading AR software companies. Tech giants like Apple, Google, and Microsoft drive innovation in AR hardware, development platforms, and AI-powered applications. Extensive 5G infrastructure supports real-time AR experiences, while venture capital investments fuel AR startups. Strong enterprise adoption in healthcare, retail, and industrial applications further strengthens the U.S. market. With government support for emerging technologies and a large consumer base, the U.S. continues to be the primary driver of North America’s Mobile AR Market in 2024.
Asia-Pacific is the Fastest-Growing Region in Mobile Augmented Reality Market in 2024
The Asia-Pacific Mobile Augmented Reality Market is expected to grow at a CAGR of 36% from 2025 to 2032, driven by rapid smartphone adoption, expanding digital infrastructure, and supportive government initiatives promoting AR innovation. Rising consumer interest in AR gaming, e-commerce, and social media applications, along with enterprise adoption in healthcare, education, and industrial sectors, fuels demand. Investments in AR software platforms, AI-driven AR solutions, and cloud-based AR services further accelerate growth, positioning Asia-Pacific as the fastest-growing region in the global Mobile AR Market.
China Leads Asia-Pacific’s Mobile AR Market
China dominates the Asia-Pacific market due to its vast consumer base, high smartphone penetration, and strong focus on AR-driven industries such as gaming, e-commerce, and education. Leading Chinese technology companies like Huawei, Xiaomi, and Tencent are actively developing AR-enabled devices, applications, and platforms. Government incentives for innovation, combined with rapidly expanding 5G networks, support large-scale AR adoption. Investments in AR content, cloud-based AR services, and AI-driven applications further accelerate market growth. China’s technological leadership and infrastructure capabilities make it the key driver of Asia-Pacific’s Mobile AR Market in 2024.
Europe Mobile Augmented Reality Market Insights, 2024
In 2024, Europe accounted for a significant share of the Mobile Augmented Reality Market, driven by strong adoption across gaming, retail, and enterprise applications. Widespread consumer use of AR-enabled smartphones and wearable devices enhances engagement, while growing interest in AR-based e-commerce and training solutions supports market expansion. Robust digital infrastructure, high smartphone penetration, and government-backed technology initiatives further facilitate development. Investments in AR software platforms, development kits, and AI-driven applications are accelerating adoption, positioning Europe as a key region in the global Mobile AR landscape.
Germany Leads Europe’s Mobile AR Market
Germany dominates due to its advanced technology ecosystem, high smartphone penetration, and strong investment in AR software and hardware development. Government initiatives for digital innovation, combined with enterprise adoption across industrial, healthcare, and retail sectors, accelerate AR deployment. Technology leadership in AI-driven AR applications enhances market expansion, positioning Germany as the central driver of Europe’s Mobile AR Market in 2024.
Middle East & Africa and Latin America Mobile AR Market Insights, 2024
The Mobile AR Market in the Middle East, Africa, and Latin America is witnessing steady growth in 2024, supported by increasing smartphone penetration, growing digital infrastructure, and rising consumer interest in AR applications. In the Middle East, the UAE and Saudi Arabia are leading AR adoption through smart city initiatives. Latin American countries like Brazil and Mexico are investing in AR-enabled e-commerce, gaming, and education solutions. Expansion of 5G networks and government support for technology innovation are expected to drive adoption across these regions.
Mobile Augmented Reality Companies are:
-
Google LLC
-
Microsoft Corporation
-
Meta Platforms, Inc.
-
Qualcomm Technologies, Inc.
-
Sony Corporation
-
Snap Inc.
-
Magic Leap, Inc.
-
Lenovo Group Ltd.
-
Blippar Ltd.
-
Wikitude GmbH
-
PTC Inc.
-
Vuzix Corporation
-
Seiko Epson Corporation
-
RealWear Inc.
-
Unity Technologies
-
Zappar Ltd.
-
8th Wall Inc.
-
Niantic, Inc.
Competitive Landscape for the Mobile Augmented Reality Market:
Apple Inc.
Apple Inc. is a U.S.-based technology leader, specializing in smartphones, tablets, and wearable devices with advanced AR capabilities. With decades of innovation, the company designs, engineers, and integrates AR hardware such as LiDAR scanners and high-performance GPUs, along with ARKit software, to deliver immersive augmented reality experiences across gaming, retail, education, and enterprise applications. Apple operates globally, managing device sales, software updates, and ecosystem services. Its role in the Mobile AR Market is vital, providing seamless AR experiences that combine hardware, software, and AI-driven applications.
-
In 2025, Apple previewed its next-generation iPhone and iPad lineup, featuring enhanced LiDAR sensors, ARKit 2.0 software, and improved GPU performance, elevating AR interaction and precision.
Google LLC
Google LLC, headquartered in the U.S., is a global leader in search, cloud computing, and AR/VR technologies, including ARCore and Google Lens. The company develops AR-enabled smartphones, applications, and platforms to enhance gaming, navigation, retail, and enterprise experiences. Google’s integrated ecosystem supports real-time AR rendering and AI-driven image recognition, providing scalable solutions for both consumers and businesses. Its role in the Mobile AR Market is significant, driving innovation in AR software and platforms, and expanding adoption across multiple industries worldwide.
-
In 2025, Google launched updates to ARCore and Google Lens, offering advanced AR mapping, object recognition, and interactive features to enhance mobile AR applications.
Microsoft Corporation
Microsoft Corporation is a U.S.-based technology giant known for its enterprise software, cloud services, and AR innovations such as HoloLens and Windows Mixed Reality. The company develops AR devices, enterprise solutions, and developer tools that integrate AI, cloud computing, and spatial computing for industrial, healthcare, and educational applications. Its role in the Mobile AR Market is crucial, providing enterprise-grade AR solutions that enable remote collaboration, 3D visualization, and immersive productivity experiences.
-
In 2025, Microsoft introduced HoloLens updates and new AR-enabled collaboration tools, improving real-time 3D visualization, training, and industrial workflow efficiency.
Meta Platforms, Inc.
Meta Platforms, Inc., formerly Facebook, is a U.S.-based social media and AR/VR innovator, focusing on AR glasses, Oculus devices, and the Meta Horizon ecosystem. The company develops mobile AR applications, developer platforms, and social AR experiences, integrating AI and cloud technologies to enhance gaming, social networking, and enterprise engagement. Meta plays a pivotal role in the Mobile AR Market by driving adoption of AR-enabled social and immersive experiences, enabling both consumer and business-focused applications globally.
-
In 2025, Meta launched next-generation AR glasses and enhanced AR software for social interactions, gaming, and enterprise use, supporting real-time tracking and AI-driven AR content.
|
Report Attributes |
Details |
|---|---|
|
Market Size in 2024 |
USD 29.2 Billion |
|
Market Size by 2032 |
USD 327.7 Billion |
|
CAGR |
CAGR of 30.84% From 2025 to 2032 |
|
Base Year |
2024 |
|
Forecast Period |
2025-2032 |
|
Historical Data |
2020-2022 |
|
Report Scope & Coverage |
Market Size, Segments Analysis, Competitive Landscape, Regional Analysis, DROC & SWOT Analysis, Forecast Outlook |
|
Key Segments |
• By Component (Hardware, 3D Camera, Sensors, Processor, Others, Software, Services) |
|
Regional Analysis/Coverage |
North America (US, Canada, Mexico), Europe (Eastern Europe [Poland, Romania, Hungary, Turkey, Rest of Eastern Europe] Western Europe] Germany, France, UK, Italy, Spain, Netherlands, Switzerland, Austria, Rest of Western Europe]), Asia Pacific (China, India, Japan, South Korea, Vietnam, Singapore, Australia, Rest of Asia Pacific), Middle East & Africa (Middle East [UAE, Egypt, Saudi Arabia, Qatar, Rest of Middle East], Africa [Nigeria, South Africa, Rest of Africa], Latin America (Brazil, Argentina, Colombia, Rest of Latin America) |
|
Company Profiles |
Apple Inc., Google LLC, Meta Platforms, Inc., Microsoft Corporation, Snap Inc., Niantic, Inc., Qualcomm Technologies, Inc., Magic Leap, Inc., PTC Inc., Seiko Epson Corporation, Samsung Electronics Co., Ltd., Sony Corporation, Vuzix Corporation, Blippar Ltd., Zappar Ltd. |
Frequently Asked Questions
The Mobile Augmented Reality Market was valued at USD 29.2 Billion in 2024 and is expected to reach USD 327.7 Billion by 2032
The CAGR of the Mobile Augmented Reality Market during the forecast period is 30.84% from 2025-2032.
Asia-Pacific is expected to register the fastest CAGR during the forecast period.
The growing use of AR in gaming, retail, healthcare, and social media is driving market expansion.
AR applications collect vast user data, raising privacy and cybersecurity risks.
Get in Touch
