Augmented Reality In Packaging Market Report Scope And Overview:
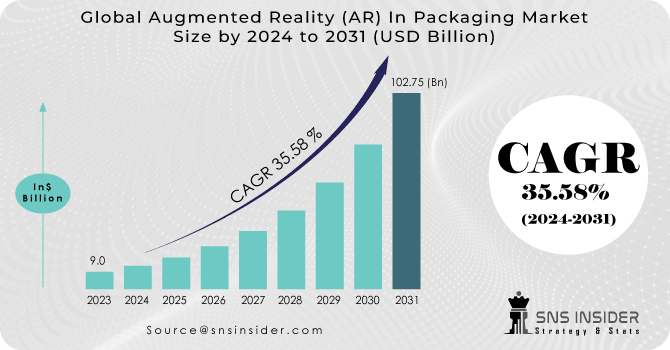
The Augmented Reality (AR) in Packaging Market was valued at USD 9.0 billion in 2023 and is projected to reach USD 139.31 billion by 2032, growing at a CAGR of 35.5% during the forecast period from 2024 to 2032.
The augmented reality (AR) in packaging market is rapidly evolving, propelled by technological advancements and shifting consumer preferences. Augmented reality seamlessly blends digital information with the real world, offering users an enhanced perception of their surroundings. Within the packaging industry, AR introduces an interactive dimension, enabling consumers to interact with products through 3D visuals, animations, and engaging content. An illustration of a company leveraging AR technology is Nestle, which has integrated AR into its baby food product packaging. Through smartphone scanning, consumers gain access to product details such as nutritional information, recipes, and even a virtual tour of the ingredient sourcing farm. This not only offers valuable insights to consumers but also fosters trust in the brand and its offerings.
Get More Information on Augmented Reality (AR) In Packaging Market - Request Sample Report
This integration of AR into packaging is a transformative approach, turning conventional packaging into a dynamic platform for brand storytelling, product details, and interactive experiences. Brands can utilize this innovative channel to directly communicate their values, instructions, and promotional content to consumers, thereby elevating the overall customer experience. AR is additionally utilized to develop innovative packaging forms that offer greater interactivity and engagement. For instance, L'Oréal has introduced an AR-enabled mascara package enabling consumers to virtually experiment with various mascara shades prior to purchase.
MARKET DYNAMICS
KEY DRIVERS:
-
Continuous advancements in AR technologies to drive the market growth.
Continuous advancements in AR technologies, including improved hardware and software capabilities, contribute to a more seamless and immersive user experience. As AR technology evolves, it becomes more accessible and appealing to both brands and consumers.
-
AR offers brands a powerful tool for marketing and promotional activities.
RESTRAIN:
-
Developing and deploying AR applications can be technically complex.
Brands may face challenges in creating seamless and user-friendly AR experiences that work across various devices and platforms, potentially hindering widespread adoption.
OPPORTUNITY:
-
AR in packaging provides an opportunity for brands to engage customers in a more interactive and immersive way.
Brands can create unique experiences, such as virtual try-ons, product demonstrations, or interactive storytelling, fostering a deeper connection with consumers.
-
As the most innovative method for marketers to captivate their target audience, AR packaging has emerged as a favored promotional tool for brand owners.
CHALLENGES:
-
Consumers may not be familiar with or may be hesitant to adopt AR technology in their daily lives.
-
Utilizing new technologies demands proficiency in design, 3D animation, game programming, or other forms of virtual content creation.
Impact of Russia Ukraine War
The Russia-Ukraine crisis has reverberated through global markets, casting indirect effects on the technology and packaging sectors, including augmented reality (AR) in packaging. Widespread disruptions in supply chains have impeded the availability of crucial raw materials for both packaging and AR technologies, causing delays and escalating project costs. The imposition of economic sanctions on Russia has potential repercussions for companies engaged in the AR in packaging market, curtailing opportunities and hindering operations linked to affected regions. Furthermore, the crisis has led to a hesitant investment environment, affecting funding opportunities for emerging technologies like AR. Start-ups and innovative AR packaging initiatives may face difficulties in securing investment amidst increased geopolitical tensions. Global rises in energy prices resulting from the crisis have heightened manufacturing expenses, leading businesses to reassess non-essential innovations such as AR in packaging, especially in markets sensitive to costs.
Consumer spending, influenced by economic uncertainties and inflationary pressures, may shift priorities away from non-essential projects, impacting the momentum of AR in packaging adoption. Additionally, geopolitical tensions could divert resources towards critical needs and industries, potentially slowing down the pace of innovation and adoption in AR packaging. Restricted market access and challenges in entering conflict-affected regions may further limit the growth prospects of AR in packaging. Lastly, impediments to international collaboration and technology transfer pose obstacles to the development and global adoption of AR in packaging solutions.
Impact of Economic Slowdown
The ongoing economic slowdown has introduced a spectrum of challenges for the augmented reality (AR) in packaging market. Budget constraints are prompting companies to reduce marketing spend, potentially impacting investments in AR campaigns and innovative packaging technologies. Essential operations take precedence, leading to the deferral of AR for packaging in favour of more immediate, revenue-focused activities. Altered consumer priorities and increased price sensitivity may diminish the efficacy of AR-enabled packaging for non-essential items during economic downturns.
Supply chain disruptions and cost pressures further compound challenges, affecting the production and distribution of AR-enabled packaging materials. The economic downturn may lead to delayed investments and a heightened focus on short-term return on investment (ROI), potentially scrutinizing the perceived long-term benefits of AR in packaging.
KEY MARKET SEGMENTS
By Packaging Type
-
Labels & Tags
-
Bottles & Cans
-
Boxes & Cartons
By Technology
-
Marker Based AR
-
Marker Less AR
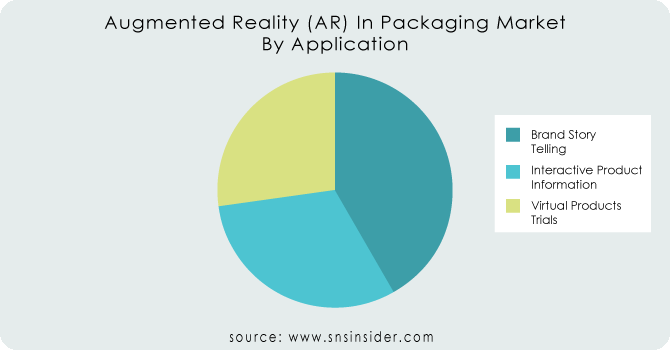
By Application
-
Interactive Product Information
-
Brand Story Telling
-
Virtual Products Trials
Get Customized Report as per Your Business Requirement - Request For Customized Report
By End Use
-
Food & Beverage
-
Cosmetic & Personal Care
-
Healthcare & Pharmaceuticals
-
Others
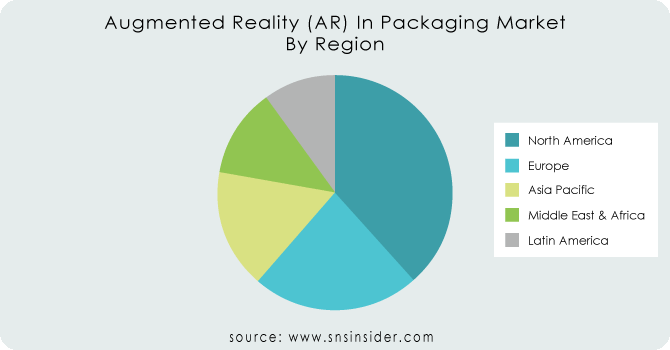
REGIONAL ANALYSIS
In technologically advanced regions like North America and Europe, robust infrastructure supports the integration of AR into packaging, with a focus on enhancing consumer experiences and brand engagement. These markets often witness early adoption and innovation in AR applications for packaging, driven by a tech-savvy consumer base and a competitive business landscape.
Asia-Pacific emerges as a significant growth hub, propelled by rapid urbanization, increasing smartphone penetration, and a burgeoning e-commerce sector. Countries like China, Japan, and South Korea are at the forefront of AR in packaging initiatives, leveraging technological advancements to captivate consumers and gain a competitive edge.
In developing regions, the adoption of AR in packaging is influenced by economic considerations, infrastructure development, and consumer awareness. Latin America and the Middle East & Africa showcase potential growth as businesses explore opportunities to enhance product visibility and consumer interaction through AR applications.
REGIONAL COVERAGE:
North America
-
US
-
Canada
-
Mexico
Europe
-
Eastern Europe
-
Poland
-
Romania
-
Hungary
-
Turkey
-
Rest of Eastern Europe
-
-
Western Europe
-
Germany
-
France
-
UK
-
Italy
-
Spain
-
Netherlands
-
Switzerland
-
Austria
-
Rest of Western Europe
-
Asia Pacific
-
China
-
India
-
Japan
-
South Korea
-
Vietnam
-
Singapore
-
Australia
-
Rest of Asia Pacific
Middle East & Africa
-
Middle East
-
UAE
-
Egypt
-
Saudi Arabia
-
Qatar
-
Rest of Middle East
-
-
Africa
-
Nigeria
-
South Africa
-
Rest of Africa
-
Latin America
-
Brazil
-
Argentina
-
Colombia
-
Rest of Latin America
Key players
Some of the major players in the Augmented Reality (AR) In Packaging Market are Augment, Wikitude, PTC, WestRock, PepsiCo, Tetra Pak, Coca-Cola, Crown Holdings, Avery Dennison, HP Inc and other players.
Augment-Company Financial Analysis
RECENT TRENDS
-
Australia based AR platform for product packaging Displai announces a programme to allow the use of Augmented Reality Packaging.
-
The signing of a unique agreement with Bothwell Cheese, using Nextech's ARitize CPG technology to place QR codes and floor mounted holograms on cheese labels is hereby announced by NexTech the Metaverse Company that provides experience technologies and services for Augmented Reality.
| Report Attributes | Details |
|---|---|
| Market Size in 2023 | US$ 9.0 Billion |
| Market Size by 2032 | US$ 139.31 Billion |
| CAGR | CAGR of 35.5% From 2024 to 2032 |
| Base Year | 2023 |
| Forecast Period | 2024-2032 |
| Historical Data | 2020-2022 |
| Report Scope & Coverage | Market Size, Segments Analysis, Competitive Landscape, Regional Analysis, DROC & SWOT Analysis, Forecast Outlook |
| Key Segments | • By Packaging Type (Labels & Tags, Bottles & Cans, Boxes & Cartons) • By Technology (Marker Based AR, Marker Less AR) • By Application (Interactive Product Information, Brand Story Telling, Virtual Products Trials) • By End Use Industry (Food & Beverage, Cosmetic & Personal Care, Healthcare & Pharmaceuticals, Others) |
| Regional Analysis/Coverage | North America (US, Canada, Mexico), Europe (Eastern Europe [Poland, Romania, Hungary, Turkey, Rest of Eastern Europe] Western Europe] Germany, France, UK, Italy, Spain, Netherlands, Switzerland, Austria, Rest of Western Europe]), Asia Pacific (China, India, Japan, South Korea, Vietnam, Singapore, Australia, Rest of Asia Pacific), Middle East & Africa (Middle East [UAE, Egypt, Saudi Arabia, Qatar, Rest of Middle East], Africa [Nigeria, South Africa, Rest of Africa], Latin America (Brazil, Argentina, Colombia, Rest of Latin America) |
| Company Profiles | Augment, Wikitude, PTC, WestRock, PepsiCo, Tetra Pak, Coca-Cola, Crown Holdings, Avery Dennison, HP Inc |
| Key Drivers | • Continuous advancements in AR technologies to drive the market growth. • AR offers brands a powerful tool for marketing and promotional activities. |
| Opportunities | • AR in packaging provides an opportunity for brands to engage customers in a more interactive and immersive way. • As the most innovative method for marketers to captivate their target audience, AR packaging has emerged as a favored promotional tool for brand owners. |
Frequently Asked Questions
Ans: The North America region held the largest market share and will continue to dominate the market.
Ans: Developing and deploying AR applications can be technically complex.
Ans: A key driver is the continuous advancements in AR technologies to drive the market growth.
Ans: The Augmented reality (AR) in packaging market size was USD 9.0 billion in 2023 and is expected to Reach USD 102.75 billion by 2031.
Ans: The Augmented reality (AR) in packaging market is expected to grow at a CAGR of 35.58%.
Get in Touch
