Automated Optical Inspection Market Size:
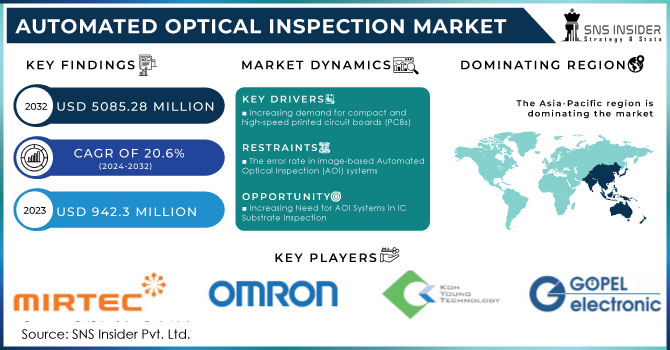
The Automated Optical Inspection Market Size was valued at USD 942.3 million in 2023 and is expected to reach USD 5085.28 million by 2032 and grow at a CAGR of 20.6% over the forecast period 2024-2032.
The Automated Optical Inspection (AOI) market is a dynamic and pivotal sector within the electronics manufacturing industry, focusing on inspection and quality control processes in electronic component manufacturing, particularly printed circuit boards (PCBs). AOIs utilize advanced optical technologies like cameras and image processing software to thoroughly inspect and identify defects, inaccuracies, or irregularities in the assembly and soldering of electronic components. This rigorous inspection ensures the production of high-quality and reliable electronic devices. The market's significance extends across various industries, including automotive, aerospace, consumer electronics, and telecommunications, where precision and reliability in electronic components are paramount. With continuous technological advancements and growing demand for miniaturization, the AOI market foresees sustained growth, driven by manufacturers emphasizing quality assurance in electronic manufacturing processes.
Automated Optical Inspection Market Size and Forecast
-
Market Size in 2023: USD 942.3 Million
-
Market Size by 2032: USD 5085.28 Million
-
CAGR: 20.6% from 2024 to 2032
-
Base Year: 2023
-
Forecast Period: 2024–2032
-
Historical Data: 2022–2023
Get more information on Automated Optical Inspection Market - Request Sample Report
Automated Optical Inspection Market Trends
-
Increasing semiconductor miniaturization below 10 nm nodes is driving demand for high-precision AOI systems, improving defect detection accuracy by up to 35% in advanced wafer fabrication.
-
Expansion of PCB manufacturing for consumer electronics and automotive is boosting AOI adoption, with PCB production volumes growing at 8–10% annually.
-
Rising deployment of 3D AOI systems is enhancing inspection capabilities, delivering 25–30% higher defect detection rates compared to traditional 2D systems.
-
Integration of AI and machine learning in AOI platforms is reducing false call rates by 20–40%, improving yield and operational efficiency.
-
Growth of EVs and advanced driver-assistance systems (ADAS) is accelerating demand for AOI in automotive electronics, a segment projected to grow at a CAGR of over 12%.
Automated Optical Inspection Market Dynamics:
DRIVERS:
-
Increasing demand for compact and high-speed printed circuit boards (PCBs)
The escalating demand for miniature, high-speed printed circuit boards (PCBs) is closely intertwined with the developments in the Automated Optical Inspection (AOI) market. As the electronic manufacturing industry adapts to the fast-paced technological landscape, the evolution of AOI systems plays a pivotal role in ensuring the quality and integrity of these advanced PCBs. AOI systems are instrumental in inspecting the intricate details of miniature PCBs, where traditional manual inspection methods fall short. The emphasis on making electronic components smaller and more compact aligns with the capabilities of AOI systems, which utilize advanced optical technologies for precise and efficient inspection. The growing demand for high-speed PCBs, driven by the need for faster data processing and communication, aligns with AOI systems' ability to detect defects and ensure the reliability of intricate circuits. This synergy between the demand for advanced PCBs and the capabilities of AOI technology underscores the integral role AOI systems play in meeting the evolving requirements of modern electronic devices.
RESTRAINTS:
-
The error rate in image-based Automated Optical Inspection (AOI) systems
The false call rate (FCR) is a measure of the number of good components erroneously labeled as defective, and parts-per-million (ppm) provides a quantitative assessment of this false call rate. In the realm of image-based Automated Optical Inspection (AOI) systems, false calls are of utmost importance. These systems leverage a series of images to discern between defective and non-defective components. The proficiency of this system is heavily contingent on the operator who captures and integrates these images into the database. Instances of misclassified images infiltrating the database can impede the optimization of parameters, impacting the overall accuracy and efficiency of the AOI system.
OPPORTUNITIES:
- Increasing Need for AOI Systems in IC Substrate Inspection
The advent of nanotechnology has led to the miniaturization and widespread adoption of high-density printed circuit boards (PCBs) in electronics manufacturing. However, these advancements bring along several challenges. As the PCB size decreases, the ball grid array (BGA) gap also reduces, leading to various defects in the PCB. Some of these defects encompass substrate corrosion, material mismatch, solder paste issues, and vulnerability to electromagnetic interference (EMI). These defects are challenging to accurately identify through manual inspection alone. Consequently, there is a growing need for the implementation of Automated Optical Inspection (AOI) systems to detect defects in IC substrates.
CHALLENGES:
- Availability of advanced inspection technology as an alternative
An AOI system excels in inspecting PCBs with visible solder joints. However, as advanced PCB and IC manufacturing techniques like ball grid array (BGA) emerge, where solder joints are not visible, AOI systems face limitations in detecting soldering defects. In contrast, alternative inspection technologies such as automated X-ray inspection (AXI) prove effective in examining a diverse array of assembly defects in PCBs employing BGA technology. AXI employs X-rays instead of light imaging to scrutinize PCBs. Companies frequently utilize AXI for the assessment of intricately designed or densely populated boards.
IMPACT OF RUSSIAN-UKRAINE WAR
The influence of the Russia-Ukraine crisis on the Automated Optical Inspection (AOI) market is intricate and can be comprehended through diverse market dynamics and trends. The AOI market is propelled by various factors, encompassing the escalating demand for high-speed PCBs, the swift integration of consumer electronics and portable devices, and the increasing trend of miniaturization within the electronics and semiconductor industry. These drivers bear significance for the global expansion of the AOI market, spanning across sectors such as aerospace & defense, automotive, consumer electronics, energy & power, industrial, medical devices, and telecommunications. Nevertheless, the market encounters challenges and constraints, including the false call rate in AOI s and issues related to image analysis. Furthermore, the presence of alternatives to AOIs poses a hurdle to the market's growth.
The cumulative impacts of COVID-19, the Russia-Ukraine conflict, and high inflation also contribute to shaping the market landscape. These factors have induced alterations in market dynamics and influenced trends, such as manufacturers with complex assembly processes leaning towards 3D AOIs and a substantial adoption of AOIs for PCB inspection across various industry verticals.
IMPACT OF ECONOMIC SLOWDOWN
The prevailing economic slowdown has affected various sectors, including the Automated Optical Inspection (AOI) market, which plays a crucial role in electronics manufacturing by ensuring the quality of printed circuit boards (PCBs). Despite facing challenges amidst the economic conditions, the AOI market remains vital due to the increasing demand for high-quality electronic components driven by advancements in electronic devices. While the downturn may impact consumer spending on electronics and consequently affect AOI demand, certain segments like 3D AOIs may continue to grow due to their efficiency in defect detection. The Asia Pacific region dominates the AOI market, with countries like China, Taiwan, Japan, and South Korea leading in electronics manufacturing. Changes in this region's economic landscape could significantly impact the global AOI market. To navigate these challenges, AOI manufacturers may need to adapt to shifting demand patterns and innovate their offerings, such as incorporating artificial intelligence for improved accuracy and cost management during economic downturns.
Automated Optical Inspection Market Segment Overview:
BY TYPE
In the segmentation of the Automated Optical Inspection market research by type, the market is categorized into 2D AOIs and 3D AOIs. This classification is attributed to the cost-effectiveness and simplicity of programming associated with 2D AOIs. Over the years, significant enhancements in software interfaces and image processing technologies have been witnessed in 2D AOIs, contributing to accelerated image capture speeds and notable reductions in inspection cycle times. Moreover, the versatility in inspection provided by the cameras, illumination, and optics employed in 2D s allows for simultaneous examination of both small and large components on a printed circuit board.
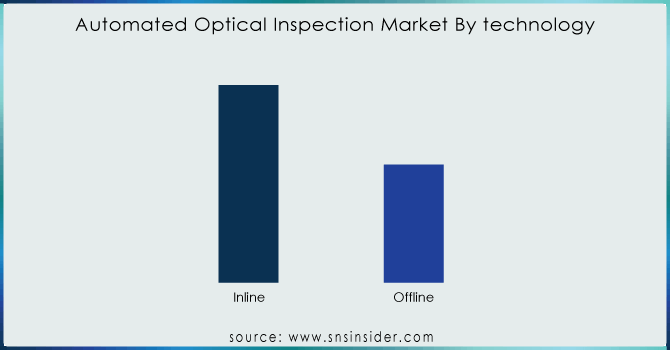
BY TECHNOLOGY
Categorized by technology, the Automated Optical Inspection market is segmented into Inline AOI and Offline AOI. The Inline AOI segment has consistently dominated the overall market and is anticipated to maintain its leadership position throughout the forecast period. This dominance can be attributed to the rapid inspection capabilities of these s, particularly in assessing a large volume of manufactured printed circuit boards. The Inline AOIs exhibit versatility by being deployable at various stages of the manufacturing process, enabling a meticulous examination of specifications and identifying flaws in the components of printed circuit boards. Notably, the inline can perform scans on both sides of printed circuit boards, reducing the need for extensive manual labor to flip the boards.
Need any customization research on Automated Optical Inspection Market - Enquiry Now
BY INDUSTRY
The Automated Optical Inspection Market is split into different parts, like Automotive, Consumer Electronics, Energy & Power, Aerospace & Defense, Telecommunications, Medical Devices, Industrial Electronics. The Automotive part is like the most popular area, where many people go. This happens because there is a growing need for strong and high-quality electronic parts in cars to make them safer. Think of it like adding cool features to a car, such as anti-lock brakes and smart assistance. Because big companies that make cars are in places like Germany, France, and Japan, these countries are very important for using AOIs to check and improve the electronic parts in cars.
Automated Optical Inspection Market Regional Analysis:
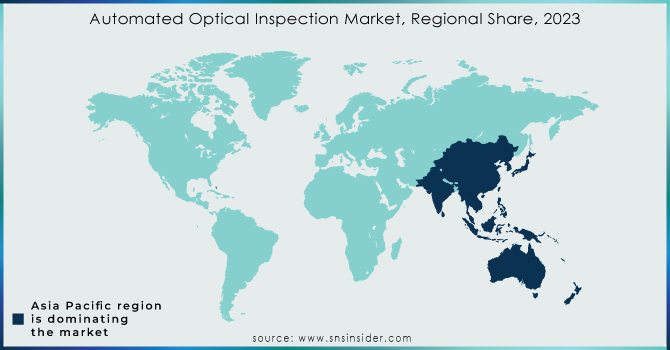
The Asia-Pacific region has dominated the revenue share in the electronics and printed circuit board manufacturing industry due to the presence of numerous manufacturers and its low labor costs. The region is highly attractive to major electronics companies. The escalating demand for consumer electronics and automobiles in countries like China and India, fueled by increasing disposable income, has led to a surge in the need for high-quality electronic components, resulting in industry expansion. During the forecast period, the North America region is expected to exhibit the fastest Compound Annual Growth Rate (CAGR). This growth can be attributed to ongoing innovation and technological advancements in various manufacturing sectors in the region. The industry is further driven by the increasing demand for smaller, faster, and more streamlined electronic products, including smartphones.
KEY PLAYERS:
The key players in the automated optical inspection market are Cyber Optics, GOPEL electronic, MIRTEC, OMRON Corporation, Test Research, Daiichi Jitsugyo, KOH YOUNG, Nordson Corporation, Saki Corporation, Viscom & Other Players.
RECENT DEVELOPMENT
In July 2023: OMRON Automation, a prominent provider of advanced industrial automation solutions, inaugurated a new Proof-of-Concept (PoC) lab in India. This cutting-edge lab is designed to offer an immersive experience, allowing OMRON's customers to explore and witness the latest advancements in Automated Optical Inspection (AOI) technology.
In July 2023: Saki Corporation, known for its innovation in automated optical and X-ray inspection equipment, showcased its newest total line inspection hardware and software solutions at FIEE in Sao Paulo, Brazil. Saki's world-class AOI & SPI machines, along with the latest software version, play a crucial role in facilitating efficient and cost-effective Smart Factory operations. The exhibition in South America marked the debut of the latest 3Di-LS2 (18µm) machine and the 3Di-LS3 (8µm) version.
| Report Attributes | Details |
|---|---|
| Market Size in 2023 | USD 942.3 million |
| Market Size by 2032 | USD 5085.28 million |
| CAGR | CAGR of 20.6% From 2024 to 2032 |
| Base Year | 2023 |
| Forecast Period | 2024-2032 |
| Historical Data | 2020-2022 |
| Report Scope & Coverage | Market Size, Segments Analysis, Competitive Landscape, Regional Analysis, DROC & SWOT Analysis, Forecast Outlook |
| Key Segments | • By Type (2D, 3D) • By Technology (Inline, Offline) • By Application (Fabrication Phase, Assembly Phase) • By Industry (Consumer Electronics, Automotive, Aerospace & Defense, Energy & Power, Telecommunications, Medical Devices, Industrial Electronics) |
| Regional Analysis/Coverage | North America (US, Canada, Mexico), Europe (Eastern Europe [Poland, Romania, Hungary, Turkey, Rest of Eastern Europe] Western Europe] Germany, France, UK, Italy, Spain, Netherlands, Switzerland, Austria, Rest of Western Europe]), Asia Pacific (China, India, Japan, South Korea, Vietnam, Singapore, Australia, Rest of Asia Pacific), Middle East & Africa (Middle East [UAE, Egypt, Saudi Arabia, Qatar, Rest of Middle East], Africa [Nigeria, South Africa, Rest of Africa], Latin America (Brazil, Argentina, Colombia, Rest of Latin America) |
| Company Profiles | Cyber Optics, GOPEL electronic, MIRTEC, OMRON Corporation, Test Research, Daiichi Jitsugyo, KOH YOUNG, Nordson Corporation, Saki Corporation and Viscom |
| Key Drivers |
• Increasing demand for compact and high-speed printed circuit boards (PCBs) |
| Restraints | • The error rate in image-based Automated Optical Inspection (AOI) systems |
Frequently Asked Questions
Manufacturers, Consultants, Association, Research Institutes, private and university libraries, suppliers, and distributors of the product.
Top-down research, bottom-up research, qualitative research, quantitative research, and Fundamental research.
The market has been segmented with respect to type, technology, industry and application.
The market value is expected to reach USD 5085.28 million by 2032.
The Automated Optical Inspection Market size was valued at USD 942.3 million in 2023 at a CAGR of 20.6%.
Get in Touch
