Light Sensor Market Size
Get E-PDF Sample Report on Light Sensor Market - Request Sample Report
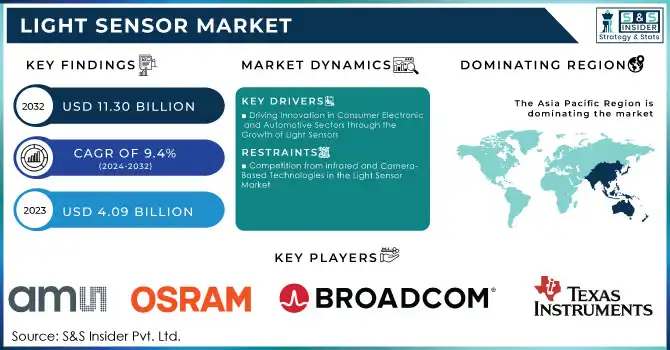
The Light Sensor Market Size was valued at USD 4.09 Billion in 2023 and is expected to grow to USD 11.30 Billion by 2032 and grow at a CAGR of 9.4% over the forecast period of 2024-2032.
The light sensor market is experiencing significant growth, driven by the increasing demand for energy-efficient consumer electronics and advancements across various industries. The growing integration of light sensors in smartphones, tablets, and laptops, specifically for features like automatic brightness adjustment, is transforming the consumer electronics sector. Additionally, the automotive industry is increasingly adopting light sensors for applications such as lane assist, automatic headlights, and other vehicle technologies. Smart home innovations, including outdoor lighting and motion detection, also contribute to the market’s expansion.A key driver of the light sensor market is the growing demand for sensors in smart city development and the proliferation of IoT technology. Sensors like proximity light sensors are being widely adopted in security systems, such as outdoor lighting, to detect motion and protect properties.
For instance, proximity light sensors, which respond to infrared light changes, are commonly found in outdoor lighting systems. Another notable trend is the integration of light sensors in mobile devices. A prime example is Oppo’s 2022 launch of the Oppo F21 Pro, which featured the Sony IMX709 RGBW selfie sensor, offering a 60% increase in light sensitivity and a 35% reduction in noise compared to its predecessor. Companies like Osram developed ambient light sensors to detect UV-A light for medical devices, aligning with the rising need for health-conscious technology. Furthermore, collaborations between leading electronics manufacturers, such as Samsung and STMicroelectronics, have boosted the development of innovative solutions across industries like automotive, medical, and consumer electronics.
Light Sensor Market Dynamics
Drivers
-
Driving Innovation in Consumer Electronics and Automotive Sectors through the Growth of Light Sensors
As demand for energy-efficient devices increases, manufacturers are integrating light sensors into products like smartphones, tablets, and laptops to enhance user experience. Features such as automatic brightness adjustment optimize screen visibility based on surrounding light, thereby improving battery life. In smartphones, these sensors reduce power consumption by adjusting brightness when ambient light is sufficient, a significant factor for eco-conscious consumers seeking energy-efficient solutions. This trend supports the market's expansion as consumers demand more sustainable and high-performance technology.In the automotive sector, the adoption of light sensors is revolutionizing vehicle functionality and safety. These sensors are increasingly used in applications like automatic headlights, lane assist, and rain detection. by adjusting headlights based on ambient lighting, light sensors contribute to safer driving conditions and reduce driver fatigue. Additionally, they are integrated into vehicle features like optical control knobs, rear-view mirrors, and interior lighting, enhancing both convenience and safety.
Restraints
-
Competition from Infrared and Camera-Based Technologies in the Light Sensor Market
The light sensor market faces growing competition from alternative technologies, particularly infrared sensors and camera-based systems, which can sometimes offer better performance, additional features, or cost-effectiveness in certain applications, limiting the adoption of light sensors. Infrared sensors are commonly used in proximity detection, motion sensing, and temperature measurements. These sensors excel in environments with fluctuating or low-light conditions, as they can detect heat signatures and motion without being impacted by ambient light. This ability makes infrared sensors more reliable in applications where light sensors may struggle, such as in dark settings or precise detection tasks. Their integration into consumer electronics, automotive systems, and security devices is becoming increasingly popular due to their versatility and ability to function in diverse environments. On the other hand, camera-based systems, which rely on computer vision and machine learning, provide more advanced functionalities that light sensors cannot offer. These systems are often used for tasks like object detection, facial recognition, and advanced imaging, which go beyond simple light measurement. While camera-based systems typically demand more processing power and are costlier, they deliver superior performance for complex tasks such as those required in automotive safety features or high-quality smartphone photography.
Light Sensor Market Segment Analysis
by Function
Ambient light sensing technology held the largest share of the light sensor market in 2023, accounting for approximately 43% of the total market revenue. This significant share is attributed to the widespread use of ambient light sensors in consumer electronics, particularly in smartphones, tablets, and laptops. These sensors enable automatic screen brightness adjustments based on surrounding light conditions, optimizing battery life and enhancing the user experience. The demand for energy-efficient devices, combined with growing consumer expectations for smart, adaptive features, is driving the adoption of ambient light sensors. In addition to consumer electronics, ambient light sensing is increasingly integrated into automotive applications, such as automatic headlights, and smart home systems to control lighting levels for energy efficiency. As technology continues to evolve, advancements in sensor miniaturization and accuracy are likely to further boost the adoption of ambient light sensors across multiple industries, solidifying its position as a dominant function in the market.
by Output
In 2023, digital output light sensors dominated the light sensor market, capturing the largest share of revenue. This trend is driven by the growing demand for energy-efficient, user-friendly technologies across multiple sectors, including consumer electronics and automotive. Digital light sensors provide enhanced performance by converting analog light data into digital signals, allowing for seamless integration with modern devices and systems. Their ability to offer high accuracy, fast response times, and reliable functionality makes them ideal for a variety of applications. In the consumer electronics sector, digital light sensors are commonly found in smartphones, tablets, laptops, and wearables. These sensors enable key features like automatic brightness adjustment and power-saving modes, significantly extending battery life and improving the user experience. The automotive industry has also seen an increasing shift toward digital light sensors, particularly for features like automatic headlights, lane-assist technologies, and advanced smart lighting systems. Digital sensors are essential in enabling these systems, ensuring that they work more efficiently and integrate better with the vehicle's other digital systems.
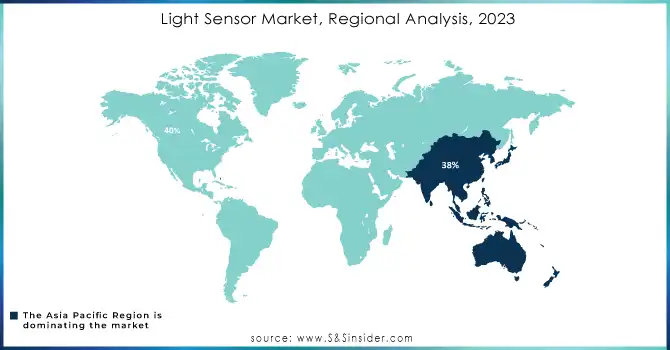
Light Sensor Market Regional Outlook
In 2023, the Asia Pacific region held the largest share of the global light sensor market, accounting for approximately 38%. This is driven by rapid industrialization, technological advancements, and a strong demand for consumer electronics in countries like China, Japan, and South Korea. The production of smartphones, tablets, and laptops with integrated light sensors for energy-efficient features, such as automatic brightness adjustment, has spurred market growth. Additionally, the rise of smart home technologies, electric vehicles, and the adoption of advanced automotive technologies like autonomous vehicles and smart lighting further fueled demand for light sensors in the region.
In 2023, North America emerged as the fastest-growing region in the light sensor market, fueled by technological advancements and strong demand across industries like automotive, consumer electronics, and healthcare. The U.S. and Canada are key contributors, with significant adoption of light sensors in sectors such as automotive (ADAS and autonomous vehicles) and smart home devices. The region's high concentration of tech companies investing in R&D further accelerates the development of advanced sensors, meeting the needs of both consumers and industries. The increasing use of smartphones, where light sensors optimize display brightness, also drives market expansion in North America.
Get Customized Report as Per Your Business Requirement - Request For Customized Report
Key Players
Some of the Major players in Light Sensor Market with product:
-
Texas Instruments (Optical Sensors, Ambient Light Sensors)
-
Broadcom (Digital Light Sensors, Proximity Sensors)
-
ams OSRAM (Ambient Light Sensors, Color Sensors)
-
STMicroelectronics (Light-to-Digital Converters, Proximity Sensors)
-
Honeywell (Photoelectric Sensors, Light Sensors)
-
Infineon Technologies (Environmental Sensors, Ambient Light Sensors)
-
Omron Corporation (Reflective Optical Sensors, Light Sensors)
-
NXP Semiconductors (Environmental Sensors, Ambient Light Sensors)
-
Sharp Corporation (Light Sensors, Proximity Sensors)
-
Vishay Intertechnology (Ambient Light Sensors, Photodiodes)
-
Renesas Electronics (Light Sensors, Proximity Sensors)
-
Toshiba Corporation (Optical Sensors, RGB Color Sensors)
-
Maxim Integrated (Ambient Light Sensors, Proximity Sensors)
-
Seoul Semiconductor (Optical Sensors, Light Control Sensors)
-
Lite-On Technology (Ambient Light Sensors, Proximity Sensors)
-
Analog Devices (Photo Sensors, Light-to-Digital Converters)
-
Avago Technologies (Digital Light Sensors, Proximity Sensors)
-
Microchip Technology (Optical Sensors, Color Sensors)
-
Sensirion AG (Ambient Light Sensors, Environmental Sensors)
-
Sony Corporation (RGB Color Sensors, Light Sensors)
List of potential customers in the light sensor market, which include companies from various industries that rely on light sensors for applications in automotive, consumer electronics, industrial, and smart home systems:
-
Apple Inc.
-
Samsung Electronics
-
Sony Corporation
-
Tesla, Inc.
-
Ford Motor Company
-
Volkswagen Group
-
Google (Alphabet Inc.)
-
LG Electronics
-
Panasonic Corporation
-
General Electric (GE)
-
Siemens AG
-
Honeywell International
-
Sharp Corporation
-
Xiaomi Corporation
-
Bosch Group
-
Huawei Technologies
-
Nokia
-
Alibaba Group
-
Philips Lighting (Signify)
-
Amazon
Recent Development
-
In August 2024, Texas Instruments unveiled its new digital light processing (DLP) controllers, which are 90% smaller than previous models and enable the creation of ultra-compact 4K UHD projectors. This breakthrough offers the smallest, fastest, and most power-efficient 4K projectors, enhancing user experiences for consumers and gamers alike
-
On February 22, 2024, ams OSRAM announced its participation in Light + Building 2024 in Frankfurt, showcasing advanced LED technologies designed for efficient urban lighting. Their products, including the AXIA 3 EVO and OSLON Pure, are tailored for applications in street lighting, building management, and retail spaces, offering high performance and energy efficiency under harsh conditions.
| Report Attributes | Details |
|---|---|
| Market Size in 2023 | USD 4.09 Billion |
| Market Size by 2032 | USD 11.30 Billion |
| CAGR | CAGR of 11.95% From 2024 to 2032 |
| Base Year | 2023 |
| Forecast Period | 2024-2032 |
| Historical Data | 2020-2022 |
| Report Scope & Coverage | Market Size, Segments Analysis, Competitive Landscape, Regional Analysis, DROC & SWOT Analysis, Forecast Outlook |
| Key Segments | • By Function (Ambient light sensing, Proximity detection, RGB Color sensing, Gesture recognition, UV/IR detection) • By Output (Analog, Digital) • By Integration (Discrete, Combination) • By Application (Automotive, Consumer electronics, Healthcare, Industrial, Entertainment, Home automation, Security) |
| Regional Analysis/Coverage | North America (US, Canada, Mexico), Europe (Eastern Europe [Poland, Romania, Hungary, Turkey, Rest of Eastern Europe] Western Europe] Germany, France, UK, Italy, Spain, Netherlands, Switzerland, Austria, Rest of Western Europe]), Asia Pacific (China, India, Japan, South Korea, Vietnam, Singapore, Australia, Rest of Asia Pacific), Middle East & Africa (Middle East [UAE, Egypt, Saudi Arabia, Qatar, Rest of Middle East], Africa [Nigeria, South Africa, Rest of Africa], Latin America (Brazil, Argentina, Colombia, Rest of Latin America) |
| Company Profiles | Texas Instruments, Broadcom, ams OSRAM, STMicroelectronics, Honeywell, Infineon Technologies, Omron Corporation, NXP Semiconductors, Sharp Corporation, Vishay Intertechnology, Renesas Electronics, Toshiba Corporation, Maxim Integrated, Seoul Semiconductor, Lite-On Technology, Analog Devices, Avago Technologies, Microchip Technology, Sensirion AG, Sony Corporation. |
| Key Drivers | Driving Innovation in Consumer Electronics and Automotive Sectors through the Growth of Light Sensors. |
| Restraints | Competition from Infrared and Camera-Based Technologies in the Light Sensor Market. |
Get in Touch
