Defect Detection Market Key Insights:
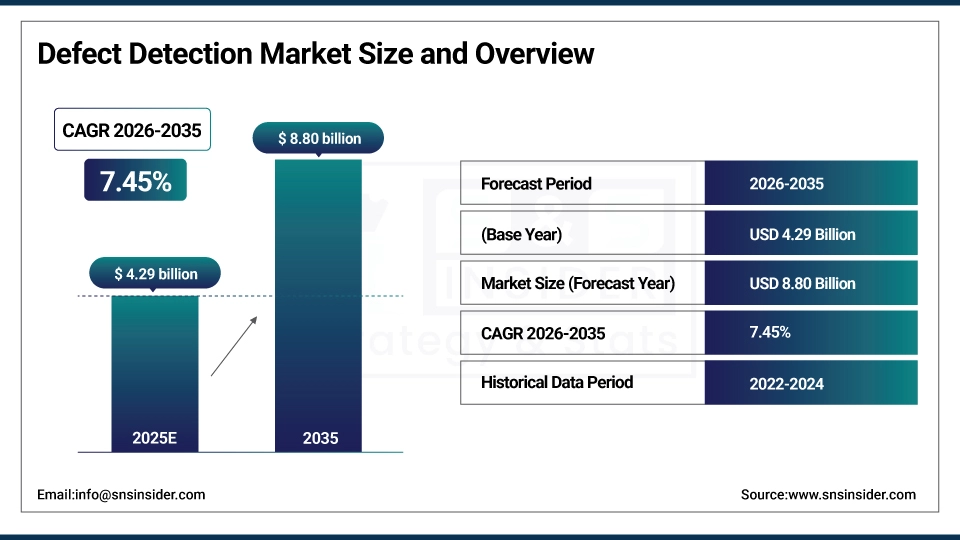
The Defect Detection Market Size was valued at USD 4.00 Billion in 2024 and is expected to reach USD 7.12 Billion by 2032, and grow at a CAGR of 7.45% over the forecast period 2025-2032.

Get more information on Defect Detection Market - Request Sample Report
The rising trend of automation across various industries is significantly driving the growth of the defect detection market. As industries increasingly adopt automated processes to enhance efficiency and minimize human error, the demand for advanced defect detection systems has surged. These systems enable real-time monitoring, faster detection, and more accurate results in manufacturing and production environments, aligning with the broader trend of Industry 4.0. Automation technologies are becoming indispensable, especially in sectors like automotive, electronics, and packaging, where quality control is paramount. The integration of machine learning and artificial intelligence (AI) into defect detection systems allows for faster and more reliable identification of defects, reducing the chances of errors in product assembly and manufacturing lines.
For example, the application of AI and machine vision technologies in defect detection has allowed companies to increase production speed while ensuring product quality and compliance with strict industry regulations. These advancements significantly reduce manual inspections, enhancing productivity, and cutting operational costs. According to Forbes, the adoption of automation technologies is transforming industries by enabling better quality control and more efficient production cycles. The growth of sensor technologies, such as infrared and X-ray imaging, is further expanding the capabilities of defect detection, offering high-resolution, non-destructive inspection methods. As automation continues to evolve with the help of IoT devices and AI-powered solutions, defect detection systems are becoming more sophisticated.
Key Defect Detection Market Trends:
-
Adoption of IoT-enabled smart sensors for real-time monitoring of manufacturing processes and equipment conditions.
-
Expansion of predictive maintenance strategies to minimize downtime and extend machine life.
-
Integration of AI and advanced analytics for defect detection, trend identification, and process optimization.
-
Shift toward highly automated and interconnected smart factories under Industry 4.0 frameworks.
-
Enhanced decision-making through data-driven insights and early corrective action capabilities.
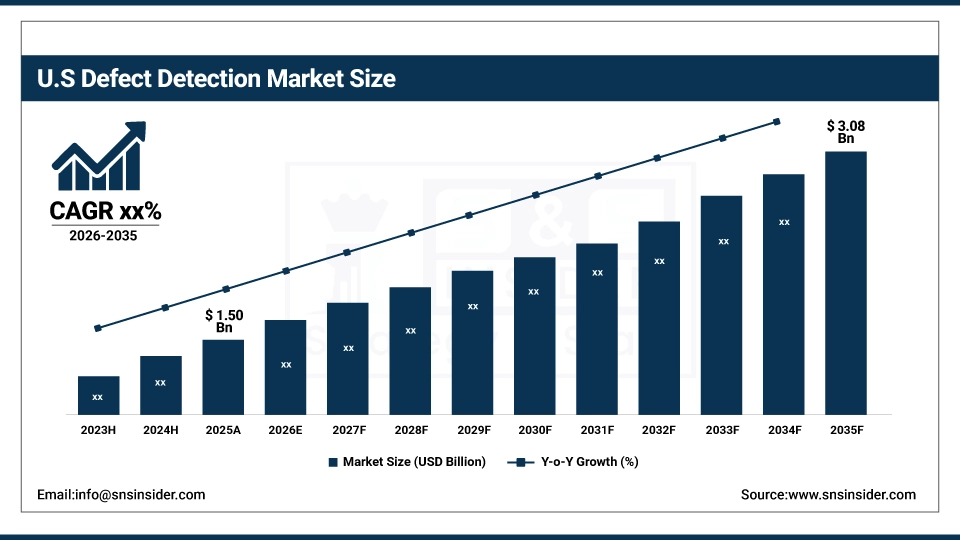
Defect Detection Market Growth Drivers:
-
Revolutionizing Defect Detection through Industry 4.0 and IoT Integration in Smart Manufacturing
The integration of Industry 4.0 and Internet of Things (IoT) technologies has significantly transformed manufacturing, ushering in the era of smart factories where processes are highly automated and interconnected. At the heart of this transformation is the use of IoT-enabled smart sensors embedded in machines, continuously monitoring variables such as temperature, pressure, vibration, and machine wear. This real-time data collection enables immediate defect detection and allows manufacturers to address production issues early, preventing defects from escalating. Additionally, IoT facilitates predictive maintenance, where systems analyze patterns over time to predict equipment failures before they occur, reducing downtime and enhancing operational efficiency. These systems also employ advanced AI and data analytics to identify trends, pinpoint root causes of defects, and suggest corrective actions, ultimately improving decision-making.
Defect Detection Market Restraints:
-
Overcoming Data Management Challenges in IoT-Driven Defect Detection Systems
As manufacturing environments increasingly adopt IoT technologies for defect detection, managing the vast amounts of real-time data generated has become a critical challenge. The complexity of processing, storing, and analyzing this data requires advanced infrastructure and skilled personnel. With real-time monitoring crucial for identifying defects promptly, manufacturers must invest in scalable solutions to handle the data load. Advanced technologies like AI-driven analytics, edge computing, and cloud-based solutions are vital to managing data effectively, ensuring faster decision-making, and minimizing the risk of inefficiencies in defect detection systems.
Defect Detection Market Segment Analysis:
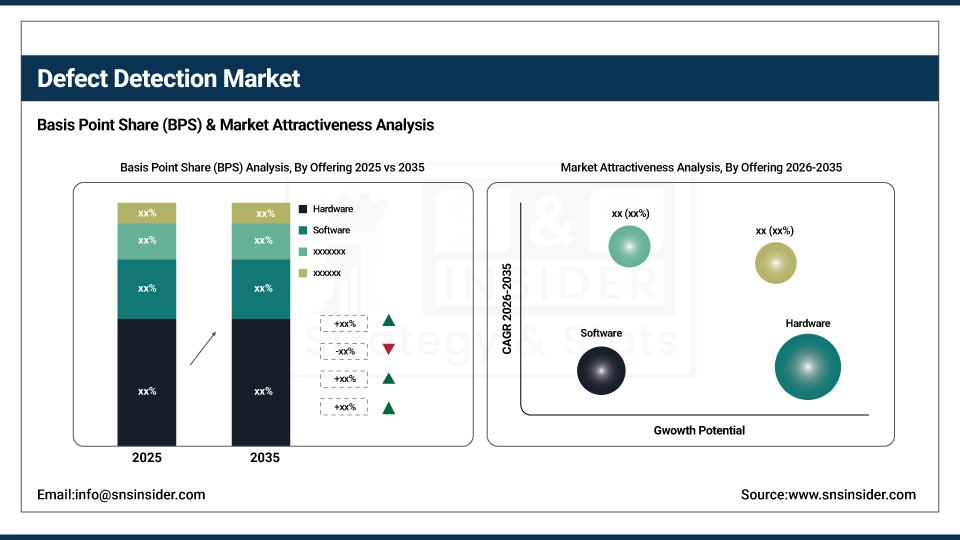
By Offering
In 2024, the hardware segment dominated the defect detection market, accounting for approximately 44% of the revenue. This growth is driven by the vital role of hardware components like IoT-enabled sensors, cameras, machine vision systems, and robotic arms in ensuring precision and reliability in manufacturing. Advances in sensor technology allow for real-time monitoring of production processes, detecting issues such as machine wear and misalignment. Additionally, machine vision systems enhance accuracy in detecting surface defects. Integration with Industry 4.0 technologies and the affordability and scalability of hardware solutions further fuel the segment's growth, enabling seamless expansion in automated systems.
by Application
In 2024, the packaging segment led the defect detection market, capturing around 72% of revenue. This growth is driven by the need for high-quality packaging to ensure product safety, shelf-life, and brand integrity in industries like food, pharmaceuticals, and consumer goods. Automation in packaging lines, coupled with innovations in machine vision, AI, and IoT, has significantly enhanced defect detection capabilities, enabling faster, more accurate inspections. Additionally, increasing focus on sustainability and safety regulations has spurred demand for advanced defect detection systems. Companies like Cognex, SICK AG, and Keyence have introduced cutting-edge solutions to further drive market growth.
Defect Detection Market Regional Analysis:
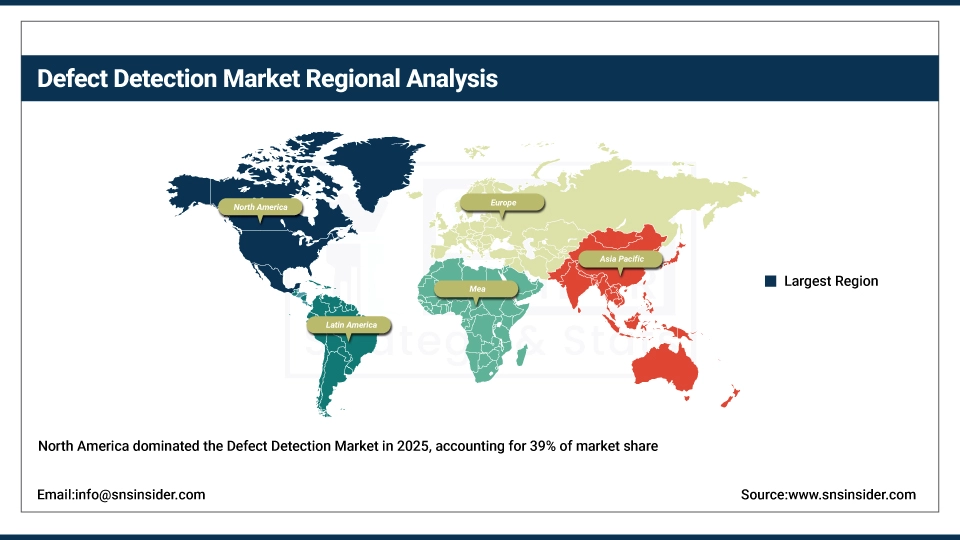
North America Defect Detection Market Insights
In 2024, North America held the largest revenue share of approximately 39% in the defect detection market, driven by its advanced manufacturing capabilities, high adoption of Industry 4.0 technologies, and significant investments in automation and IoT solutions. Key industries like automotive, aerospace, electronics, and pharmaceuticals rely on robust defect detection systems to ensure quality and safety. The region benefits from rapid automation, technological innovation, and strict regulatory standards. Notable company developments include Cognex’s high-speed inspection systems for automotive and packaging, National Instruments’ AI-powered platform for electronics, and Omron’s AI-based vision inspection systems for precision and speed.
Asia Pacific Defect Detection Market Insights
In 2024, the Asia-Pacific (APAC) region became the fastest-growing market for defect detection, driven by industrial expansion, automation, and significant technological investments. Countries like China, Japan, South Korea, and India are key players, with growing demand across automotive, electronics, consumer goods, and pharmaceuticals sectors. The region’s strong manufacturing base and the push for AI and IoT integration boost demand for advanced defect detection solutions. Additionally, cost-effective, scalable systems are especially popular in emerging markets like India and Southeast Asia. Companies such as Keyence, Cognex, and Omron are enhancing offerings in the region, fueling market growth.
Europe Defect Detection Market Insights
Europe’s defect detection market is driven by advanced manufacturing sectors, stringent quality standards, and strong adoption of Industry 4.0 technologies. Automotive, aerospace, and electronics industries lead demand for smart sensors, AI, and machine vision systems. Regulatory compliance, focus on reducing defects, and predictive maintenance adoption are strengthening the region’s competitive edge in smart manufacturing.
Latin America (LATAM) and Middle East & Africa (MEA) Defect Detection Market Insights
LATAM and MEA defect detection markets are expanding steadily, supported by industrial automation, infrastructure development, and increasing manufacturing investments. Key industries such as oil & gas, mining, automotive, and food processing are adopting smart inspection solutions to enhance quality and reduce downtime. Growing awareness of predictive maintenance and IoT integration fuels long-term growth opportunities.

Get Customized Report as per your Business Requirement - Request For Customized Report
Defect Detection Market Key Players:
Some of the Defect Detection Market Companies are
-
Keyence Corporation
-
Omron Corporation
-
Siemens AG
-
Teradyne Inc.
-
National Instruments Corporation
-
Panasonic Corporation
-
Teledyne Technologies
-
Zebra Medical Vision
-
Basler AG
-
Vision Systems Inc.
-
ISRA VISION AG
-
MVTec Software GmbH
-
Applied Robotics
-
Schneider Electric
-
Robot System Products
-
Matrox Imaging
Competitive Landscape for Defect Detection Market:
Zebra Technologies provides advanced machine vision and industrial automation solutions that support defect detection in manufacturing and logistics. Its smart cameras, sensors, and AI-driven imaging systems enable precise inspection, quality control, and real-time monitoring, helping industries reduce errors, improve efficiency, and ensure consistent product quality across diverse applications.
-
On October 25, 2024, Zebra Technologies launched the AltiZ 4200 at VISION, a high-resolution laser enabling advanced 3D point cloud creation for enhanced defect detection and quality inspection.
Report Attributes | Details |
Market Size in 2024 | USD 4.00 Billion |
Market Size by 2032 | USD 7.12 Billion |
CAGR | CAGR of 7.45% From 2024 to 2032 |
Base Year | 2024 |
Forecast Period | 2025-2032 |
Historical Data | 2021-2023 |
Report Scope & Coverage | Market Size, Segments Analysis, Competitive Landscape, Regional Analysis, DROC & SWOT Analysis, Forecast Outlook |
Key Segments | • By Offering (Hardware, Software, Services) • By Application (Manufacturing, Packaging) • By Vertical (Pharmaceuticals, Electronics & Semiconductors, Food And Packaging, Automotive, Metals & Machinery) |
Regional Analysis/Coverage | North America (US, Canada), Europe (Germany, UK, France, Italy, Spain, Russia, Poland, Rest of Europe), Asia Pacific (China, India, Japan, South Korea, Australia, ASEAN Countries, Rest of Asia Pacific), Middle East & Africa (UAE, Saudi Arabia, Qatar, South Africa, Rest of Middle East & Africa), Latin America (Brazil, Argentina, Mexico, Colombia, Rest of Latin America). |
Company Profiles | Cognex, Keyence, Omron, Hexagon, Siemens, Teradyne, National Instruments, SICK, Panasonic, Teledyne, Zebra Medical Vision, Basler, Vision Systems, ISRA VISION, MVTec, Datalogic, Applied Robotics, Schneider Electric, Robot System Products, and Matrox Imaging. |
Table Of Contents
1. Introduction
1.1 Market Definition & Scope
1.2 Research Assumptions & Abbreviations
1.3 Research Methodology
2. Executive Summary
2.1 Market Snapshot
2.2 Market Absolute $ Opportunity Assessment & Y-o-Y Analysis, 2021–2032
2.3 Market Size & Forecast, By Segmentation, 2021–2032
2.3.1 Market Size By Offering
2.3.2 Market Size By Application
2.3.3 Market Size By Vertical
2.4 Market Share & Bps Analysis By Region, 2024
2.5 Industry Growth Scenarios – Conservative, Likely & Optimistic
2.6 Industry CxO’s Perspective
3. Market Overview
3.1 Market Dynamics
3.1.1 Drivers
3.1.2 Restraints
3.1.3 Opportunities
3.1.4 Key Market Trends
3.2 Industry PESTLE Analysis
3.3 Key Industry Forces (Porter’s) Impacting Market Growth
3.4 Industry Supply Chain Analysis
3.4.1 Raw Material Suppliers
3.4.2 Manufacturers
3.4.3 Distributors/Suppliers
3.4.4 Customers/End-Users
3.5 Industry Life Cycle Assessment
3.6 Parent Market Overview
3.7 Market Risk Assessment
4. Statistical Insights & Trends Reporting
4.1 Performance & Accuracy Metrics
4.1.1 Average defect detection accuracy rate (%) by technology (machine vision, AI, ultrasonic, X-ray)
4.1.2 Average inspection speed (units per minute) across industries (semiconductor, automotive, packaging)
4.1.3 False positive/false negative rate (%) in automated defect detection systems
4.2 Adoption & Deployment Trends
4.2.1 Percentage adoption of defect detection systems in electronics vs. automotive vs. food & beverage industries
4.2.2 Average number of defect detection units deployed per production line
4.2.3 Year-on-year growth rate of AI/ML-based defect detection system installations (%)
4.3 Digitalization & Smart Integration Metrics
4.3.1 Share of defect detection systems integrated with Industry 4.0/IoT platforms (%)
4.3.2 Percentage of cloud-based vs. on-premises defect detection solutions
4.3.3 Adoption rate of predictive analytics-enabled defect detection systems (%)
4.4 Cost & Operational Benchmarks
4.4.1 Average cost per defect detection system by technology (vision, ultrasonic, X-ray) (USD)
4.4.2 Share of hardware vs. software vs. services in total defect detection cost (%)
4.4.3 Average ROI/payback period (months) for defect detection system deployment
5. Defect Detection Market Segmental Analysis & Forecast, By Offering, 2021 – 2032, Value (USD Billion)
5.1 Introduction
5.2 Hardware
5.2.1 Key Trends
5.2.2 Market Size & Forecast, 2021 – 2032
5.3 Software
5.3.1 Key Trends
5.3.2 Market Size & Forecast, 2021 – 2032
5.4 Services
5.4.1 Key Trends
5.4.2 Market Size & Forecast, 2021 – 2032
6. Defect Detection Market Segmental Analysis & Forecast, By Application, 2021 – 2032, Value (USD Billion)
6.1 Introduction
6.2 Manufacturing
6.2.1 Key Trends
6.2.2 Market Size & Forecast, 2021 – 2032
6.3 Packaging
6.3.1 Key Trends
6.3.2 Market Size & Forecast, 2021 – 2032
7. Defect Detection Market Segmental Analysis & Forecast, By Vertical, 2021 – 2032, Value (USD Billion)
7.1 Introduction
7.2 Pharmaceuticals
7.2.1 Key Trends
7.2.2 Market Size & Forecast, 2021 – 2032
7.3 Electronics & Semiconductors
7.3.1 Key Trends
7.3.2 Market Size & Forecast, 2021 – 2032
7.4 Food and Packaging
7.4.1 Key Trends
7.4.2 Market Size & Forecast, 2021 – 2032
7.5 Automotive
7.5.1 Key Trends
7.5.2 Market Size & Forecast, 2021 – 2032
7.6 Metals & Machinery
7.6.1 Key Trends
7.6.2 Market Size & Forecast, 2021 – 2032
8. Defect Detection Market Segmental Analysis & Forecast By Region, 2021 – 2025, Value (USD Billion)
8.1 Introduction
8.2 North America
8.2.1 Key Trends
8.2.2 Defect Detection Market Size & Forecast, By Offering, 2021 – 2032
8.2.3 Defect Detection Market Size & Forecast, By Application, 2021 – 2032
8.2.4 Defect Detection Market Size & Forecast, By Vertical, 2021 – 2032
8.2.5 Defect Detection Market Size & Forecast, By Country, 2021 – 2032
8.2.5.1 USA
8.2.5.1.1 Defect Detection Market Size & Forecast, By Offering, 2021 – 2032
8.2.5.1.2 Defect Detection Market Size & Forecast, By Application, 2021 – 2032
8.2.5.1.3 Defect Detection Market Size & Forecast, By Vertical, 2021 – 2032
8.2.5.2 Canada
8.2.5.2.1 Defect Detection Market Size & Forecast, By Offering, 2021 – 2032
8.2.5.2.2 Defect Detection Market Size & Forecast, By Application, 2021 – 2032
8.2.5.2.3 Defect Detection Market Size & Forecast, By Vertical, 2021 – 2032
8.3 Europe
8.3.1 Key Trends
8.3.2 Defect Detection Market Size & Forecast, By Offering, 2021 – 2032
8.3.3 Defect Detection Market Size & Forecast, By Application, 2021 – 2032
8.3.4 Defect Detection Market Size & Forecast, By Vertical, 2021 – 2032
8.3.5 Defect Detection Market Size & Forecast, By Country, 2021 – 2032
8.3.5.1 Germany
8.3.5.1.1 Defect Detection Market Size & Forecast, By Offering, 2021 – 2032
8.3.5.1.2 Defect Detection Market Size & Forecast, By Application, 2021 – 2032
8.3.5.1.3 Defect Detection Market Size & Forecast, By Vertical, 2021 – 2032
8.3.5.2 UK
8.3.5.2.1 Defect Detection Market Size & Forecast, By Offering, 2021 – 2032
8.3.5.2.2 Defect Detection Market Size & Forecast, By Application, 2021 – 2032
8.3.5.2.3 Defect Detection Market Size & Forecast, By Vertical, 2021 – 2032
8.3.5.3 France
8.3.5.3.1 Defect Detection Market Size & Forecast, By Offering, 2021 – 2032
8.3.5.3.2 Defect Detection Market Size & Forecast, By Application, 2021 – 2032
8.3.5.3.3 Defect Detection Market Size & Forecast, By Vertical, 2021 – 2032
8.3.5.4 Italy
8.3.5.4.1 Defect Detection Market Size & Forecast, By Offering, 2021 – 2032
8.3.5.4.2 Defect Detection Market Size & Forecast, By Application, 2021 – 2032
8.3.5.4.3 Defect Detection Market Size & Forecast, By Vertical, 2021 – 2032
8.3.5.5 Spain
8.3.5.5.1 Defect Detection Market Size & Forecast, By Offering, 2021 – 2032
8.3.5.5.2 Defect Detection Market Size & Forecast, By Application, 2021 – 2032
8.3.5.5.3 Defect Detection Market Size & Forecast, By Vertical, 2021 – 2032
8.3.5.6 Russia
8.3.5.6.1 Defect Detection Market Size & Forecast, By Offering, 2021 – 2032
8.3.5.6.2 Defect Detection Market Size & Forecast, By Application, 2021 – 2032
8.3.5.6.3 Defect Detection Market Size & Forecast, By Vertical, 2021 – 2032
8.3.5.7 Poland
8.3.5.7.1 Defect Detection Market Size & Forecast, By Offering, 2021 – 2032
8.3.5.7.2 Defect Detection Market Size & Forecast, By Application, 2021 – 2032
8.3.5.7.3 Defect Detection Market Size & Forecast, By Vertical, 2021 – 2032
8.3.5.8 Rest of Europe
8.3.5.8.1 Defect Detection Market Size & Forecast, By Offering, 2021 – 2032
8.3.5.8.2 Defect Detection Market Size & Forecast, By Application, 2021 – 2032
8.3.5.8.3 Defect Detection Market Size & Forecast, By Vertical, 2021 – 2032
8.4 Asia-Pacific
8.4.1 Key Trends
8.4.2 Defect Detection Market Size & Forecast, By Offering, 2021 – 2032
8.4.3 Defect Detection Market Size & Forecast, By Application, 2021 – 2032
8.4.4 Defect Detection Market Size & Forecast, By Vertical, 2021 – 2032
8.4.5 Defect Detection Market Size & Forecast, By Country, 2021 – 2032
8.4.5.1 China
8.4.5.1.1 Defect Detection Market Size & Forecast, By Offering, 2021 – 2032
8.4.5.1.2 Defect Detection Market Size & Forecast, By Application, 2021 – 2032
8.4.5.1.3 Defect Detection Market Size & Forecast, By Vertical, 2021 – 2032
8.4.5.2 India
8.4.5.2.1 Defect Detection Market Size & Forecast, By Offering, 2021 – 2032
8.4.5.2.2 Defect Detection Market Size & Forecast, By Application, 2021 – 2032
8.4.5.2.3 Defect Detection Market Size & Forecast, By Vertical, 2021 – 2032
8.4.5.3 Japan
8.4.5.3.1 Defect Detection Market Size & Forecast, By Offering, 2021 – 2032
8.4.5.3.2 Defect Detection Market Size & Forecast, By Application, 2021 – 2032
8.4.5.3.3 Defect Detection Market Size & Forecast, By Vertical, 2021 – 2032
8.4.5.4 South Korea
8.4.5.4.1 Defect Detection Market Size & Forecast, By Offering, 2021 – 2032
8.4.5.4.2 Defect Detection Market Size & Forecast, By Application, 2021 – 2032
8.4.5.4.3 Defect Detection Market Size & Forecast, By Vertical, 2021 – 2032
8.4.5.5 Australia
8.4.5.5.1 Defect Detection Market Size & Forecast, By Offering, 2021 – 2032
8.4.5.5.2 Defect Detection Market Size & Forecast, By Application, 2021 – 2032
8.4.5.5.3 Defect Detection Market Size & Forecast, By Vertical, 2021 – 2032
8.4.5.6 ASEAN Countries
8.4.5.6.1 Defect Detection Market Size & Forecast, By Offering, 2021 – 2032
8.4.5.6.2 Defect Detection Market Size & Forecast, By Application, 2021 – 2032
8.4.5.6.3 Defect Detection Market Size & Forecast, By Vertical, 2021 – 2032
8.4.5.7 Rest of Asia-Pacific
8.4.5.7.1 Defect Detection Market Size & Forecast, By Offering, 2021 – 2032
8.4.5.7.2 Defect Detection Market Size & Forecast, By Application, 2021 – 2032
8.4.5.7.3 Defect Detection Market Size & Forecast, By Vertical, 2021 – 2032
8.5 Latin America
8.5.1 Key Trends
8.5.2 Defect Detection Market Size & Forecast, By Offering, 2021 – 2032
8.5.3 Defect Detection Market Size & Forecast, By Application, 2021 – 2032
8.5.4 Defect Detection Market Size & Forecast, By Vertical, 2021 – 2032
8.5.5 Defect Detection Market Size & Forecast, By Country, 2021 – 2032
8.5.5.1 Brazil
8.5.5.1.1 Defect Detection Market Size & Forecast, By Offering, 2021 – 2032
8.5.5.1.2 Defect Detection Market Size & Forecast, By Application, 2021 – 2032
8.5.5.1.3 Defect Detection Market Size & Forecast, By Vertical, 2021 – 2032
8.5.5.2 Argentina
8.5.5.2.1 Defect Detection Market Size & Forecast, By Offering, 2021 – 2032
8.5.5.2.2 Defect Detection Market Size & Forecast, By Application, 2021 – 2032
8.5.5.2.3 Defect Detection Market Size & Forecast, By Vertical, 2021 – 2032
8.5.5.3 Mexico
8.5.5.3.1 Defect Detection Market Size & Forecast, By Offering, 2021 – 2032
8.5.5.3.2 Defect Detection Market Size & Forecast, By Application, 2021 – 2032
8.5.5.3.3 Defect Detection Market Size & Forecast, By Vertical, 2021 – 2032
8.5.5.4 Colombia
8.5.5.4.1 Defect Detection Market Size & Forecast, By Offering, 2021 – 2032
8.5.5.4.2 Defect Detection Market Size & Forecast, By Application, 2021 – 2032
8.5.5.4.3 Defect Detection Market Size & Forecast, By Vertical, 2021 – 2032
8.5.5.5 Rest of Latin America
8.5.5.5.1 Defect Detection Market Size & Forecast, By Offering, 2021 – 2032
8.5.5.5.2 Defect Detection Market Size & Forecast, By Application, 2021 – 2032
8.5.5.5.3 Defect Detection Market Size & Forecast, By Vertical, 2021 – 2032
8.6 Middle East & Africa
8.6.1 Key Trends
8.6.2 Defect Detection Market Size & Forecast, By Offering, 2021 – 2032
8.6.3 Defect Detection Market Size & Forecast, By Application, 2021 – 2032
8.6.4 Defect Detection Market Size & Forecast, By Vertical, 2021 – 2032
8.6.5 Defect Detection Market Size & Forecast, By Country, 2021 – 2032
8.6.5.1 UAE
8.6.5.1.1 Defect Detection Market Size & Forecast, By Offering, 2021 – 2032
8.6.5.1.2 Defect Detection Market Size & Forecast, By Application, 2021 – 2032
8.6.5.1.3 Defect Detection Market Size & Forecast, By Vertical, 2021 – 2032
8.6.5.2 Saudi Arabia
8.6.5.2.1 Defect Detection Market Size & Forecast, By Offering, 2021 – 2032
8.6.5.2.2 Defect Detection Market Size & Forecast, By Application, 2021 – 2032
8.6.5.2.3 Defect Detection Market Size & Forecast, By Vertical, 2021 – 2032
8.6.5.3 Qatar
8.6.5.3.1 Defect Detection Market Size & Forecast, By Offering, 2021 – 2032
8.6.5.3.2 Defect Detection Market Size & Forecast, By Application, 2021 – 2032
8.6.5.3.3 Defect Detection Market Size & Forecast, By Vertical, 2021 – 2032
8.6.5.4 Egypt
8.6.5.4.1 Defect Detection Market Size & Forecast, By Offering, 2021 – 2032
8.6.5.4.2 Defect Detection Market Size & Forecast, By Application, 2021 – 2032
8.6.5.4.3 Defect Detection Market Size & Forecast, By Vertical, 2021 – 2032
8.6.5.5 South Africa
8.6.5.5.1 Defect Detection Market Size & Forecast, By Offering, 2021 – 2032
8.6.5.5.2 Defect Detection Market Size & Forecast, By Application, 2021 – 2032
8.6.5.5.3 Defect Detection Market Size & Forecast, By Vertical, 2021 – 2032
8.6.5.6 Rest of Middle East & Africa
8.6.5.6.1 Defect Detection Market Size & Forecast, By Offering, 2021 – 2032
8.6.5.6.2 Defect Detection Market Size & Forecast, By Application, 2021 – 2032
8.6.5.6.3 Defect Detection Market Size & Forecast, By Vertical, 2021 – 2032
9. Competitive Landscape
9.1 Key Players' Positioning
9.2 Competitive Developments
9.2.1 Key Strategies Adopted (%), By Key Players, 2024
9.2.2 Year-Wise Strategies & Development, 2021 – 2025
9.2.3 Number Of Strategies Adopted By Key Players, 2024
9.3 Market Share Analysis, 2024
9.4 Product/Service & Application Benchmarking
9.4.1 Product/Service Specifications & Features By Key Players
9.4.2 Product/Service Heatmap By Key Players
9.4.3 Application Heatmap By Key Players
9.5 Industry Start-Up & Innovation Landscape
9.6 Key Company Profiles
9.6.1 Cognex Corporation
9.6.1.1 Company Overview & Snapshot
9.6.1.2 Product/Service Portfolio
9.6.1.3 Key Company Financials
9.6.1.4 SWOT Analysis
9.6.2 Keyence Corporation.
9.6.2.1 Company Overview & Snapshot
9.6.2.2 Product/Service Portfolio
9.6.2.3 Key Company Financials
9.6.2.4 SWOT Analysis
9.6.3 Omron Corporation
9.6.3.1 Company Overview & Snapshot
9.6.3.2 Product/Service Portfolio
9.6.3.3 Key Company Financials
9.6.3.4 SWOT Analysis
9.6.4 Hexagon AB.
9.6.4.1 Company Overview & Snapshot
9.6.4.2 Product/Service Portfolio
9.6.4.3 Key Company Financials
9.6.4.4 SWOT Analysis
9.6.5 Siemens AG
9.6.5.1 Company Overview & Snapshot
9.6.5.2 Product/Service Portfolio
9.6.5.3 Key Company Financials
9.6.5.4 SWOT Analysis
9.6.6 Teradyne Inc..
9.6.6.1 Company Overview & Snapshot
9.6.6.2 Product/Service Portfolio
9.6.6.3 Key Company Financials
9.6.6.4 SWOT Analysis
9.6.7 National Instruments Corporation.
9.6.7.1 Company Overview & Snapshot
9.6.7.2 Product/Service Portfolio
9.6.7.3 Key Company Financials
9.6.7.4 SWOT Analysis
9.6.8 SICK AG
9.6.8.1 Company Overview & Snapshot
9.6.8.2 Product/Service Portfolio
9.6.8.3 Key Company Financials
9.6.8.4 SWOT Analysis
9.6.9 Panasonic Corporation.
9.6.9.1 Company Overview & Snapshot
9.6.9.2 Product/Service Portfolio
9.6.9.3 Key Company Financials
9.6.9.4 SWOT Analysis
9.6.10 Teledyne Technologies
9.6.10.1 Company Overview & Snapshot
9.6.10.2 Product/Service Portfolio
9.6.10.3 Key Company Financials
9.6.10.4 SWOT Analysis
9.6.11 Zebra Medical Vision
9.6.11.1 Company Overview & Snapshot
9.6.11.2 Product/Service Portfolio
9.6.11.3 Key Company Financials
9.6.11.4 SWOT Analysis
9.6.12 Basler AG
9.6.12.1 Company Overview & Snapshot
9.6.12.2 Product/Service Portfolio
9.6.12.3 Key Company Financials
9.6.12.4 SWOT Analysis
9.6.13 Vision Systems Inc.
9.6.13.1 Company Overview & Snapshot
9.6.13.2 Product/Service Portfolio
9.6.13.3 Key Company Financials
9.6.13.4 SWOT Analysis
9.6.14 ISRA VISION AG.
9.6.14.1 Company Overview & Snapshot
9.6.14.2 Product/Service Portfolio
9.6.14.3 Key Company Financials
9.6.14.4 SWOT Analysis
9.6.15 MVTec Software GmbH.
9.6.15.1 Company Overview & Snapshot
9.6.15.2 Product/Service Portfolio
9.6.15.3 Key Company Financials
9.6.15.4 SWOT Analysis
9.6.16 Datalogic.
9.6.16.1 Company Overview & Snapshot
9.6.16.2 Product/Service Portfolio
9.6.16.3 Key Company Financials
9.6.16.4 SWOT Analysis
9.6.17 Applied Robotics
9.6.17.1 Company Overview & Snapshot
9.6.17.2 Product/Service Portfolio
9.6.17.3 Key Company Financials
9.6.17.4 SWOT Analysis
9.6.18 Schneider Electric
9.6.18.1 Company Overview & Snapshot
9.6.18.2 Product/Service Portfolio
9.6.18.3 Key Company Financials
9.6.18.4 SWOT Analysis
9.6.19 Robot System Products.
9.6.19.1 Company Overview & Snapshot
9.6.19.2 Product/Service Portfolio
9.6.19.3 Key Company Financials
9.6.19.4 SWOT Analysis
9.6.20 Matrox Imaging.
9.6.20.1 Company Overview & Snapshot
9.6.20.2 Product/Service Portfolio
9.6.20.3 Key Company Financials
9.6.20.4 SWOT Analysis
10. Analyst Recommendations
10.1 SNS Insider Opportunity Map
10.2 Industry Low-Hanging Fruit Assessment
10.3 Market Entry & Growth Strategy
10.4 Analyst Viewpoint & Suggestions On Market Growth
11. Assumptions
12. Disclaimer
13. Appendix
13.1 List Of Tables
13.2 List Of Figure
Key Segmentation:
BY OFFERING
-
Hardware
-
Software
-
Services
BY APPLICATION
-
Manufacturing
-
Packaging
BY VERTICAL
-
Pharmaceuticals
-
Electronics & Semiconductors
-
Food and Packaging
-
Automotive
-
Metals & Machinery
Request for Segment Customization as per your Business Requirement: Segment Customization Request
REGIONAL COVERAGE:
North America
-
US
-
Canada
-
Mexico
Europe
-
Eastern Europe
-
Poland
-
Romania
-
Hungary
-
Turkey
-
Rest of Eastern Europe
-
-
Western Europe
-
Germany
-
France
-
UK
-
Italy
-
Spain
-
Netherlands
-
Switzerland
-
Austria
-
Rest of Western Europe
-
Asia Pacific
-
China
-
India
-
Japan
-
South Korea
-
Vietnam
-
Singapore
-
Australia
-
Rest of Asia Pacific
Middle East & Africa
-
Middle East
-
UAE
-
Egypt
-
Saudi Arabia
-
Qatar
-
Rest of the Middle East
-
-
Africa
-
Nigeria
-
South Africa
-
Rest of Africa
-
Latin America
-
Brazil
-
Argentina
-
Colombia
-
Rest of Latin America
Request for Country Level Research Report: Country Level Customization Request
Available Customization
With the given market data, SNS Insider offers customization as per the company’s specific needs. The following customization options are available for the report:
-
Product Analysis
-
Criss-Cross segment analysis (e.g. Product X Application)
-
Product Matrix which gives a detailed comparison of the product portfolio of each company
-
Geographic Analysis
-
Additional countries in any of the regions
-
Company Information
-
Detailed analysis and profiling of additional market players (Up to five)
An accurate research report requires proper strategizing as well as implementation. There are multiple factors involved in the completion of good and accurate research report and selecting the best methodology to compete the research is the toughest part. Since the research reports we provide play a crucial role in any company’s decision-making process, therefore we at SNS Insider always believe that we should choose the best method which gives us results closer to reality. This allows us to reach at a stage wherein we can provide our clients best and accurate investment to output ratio.
Each report that we prepare takes a timeframe of 350-400 business hours for production. Starting from the selection of titles through a couple of in-depth brain storming session to the final QC process before uploading our titles on our website we dedicate around 350 working hours. The titles are selected based on their current market cap and the foreseen CAGR and growth.
The 5 steps process:
Step 1: Secondary Research:
Secondary Research or Desk Research is as the name suggests is a research process wherein, we collect data through the readily available information. In this process we use various paid and unpaid databases which our team has access to and gather data through the same. This includes examining of listed companies’ annual reports, Journals, SEC filling etc. Apart from this our team has access to various associations across the globe across different industries. Lastly, we have exchange relationships with various university as well as individual libraries.

Step 2: Primary Research
When we talk about primary research, it is a type of study in which the researchers collect relevant data samples directly, rather than relying on previously collected data. This type of research is focused on gaining content specific facts that can be sued to solve specific problems. Since the collected data is fresh and first hand therefore it makes the study more accurate and genuine.
We at SNS Insider have divided Primary Research into 2 parts.
Part 1 wherein we interview the KOLs of major players as well as the upcoming ones across various geographic regions. This allows us to have their view over the market scenario and acts as an important tool to come closer to the accurate market numbers. As many as 45 paid and unpaid primary interviews are taken from both the demand and supply side of the industry to make sure we land at an accurate judgement and analysis of the market.
This step involves the triangulation of data wherein our team analyses the interview transcripts, online survey responses and observation of on filed participants. The below mentioned chart should give a better understanding of the part 1 of the primary interview.

Part 2: In this part of primary research the data collected via secondary research and the part 1 of the primary research is validated with the interviews from individual consultants and subject matter experts.
Consultants are those set of people who have at least 12 years of experience and expertise within the industry whereas Subject Matter Experts are those with at least 15 years of experience behind their back within the same space. The data with the help of two main processes i.e., FGDs (Focused Group Discussions) and IDs (Individual Discussions). This gives us a 3rd party nonbiased primary view of the market scenario making it a more dependable one while collation of the data pointers.
Step 3: Data Bank Validation
Once all the information is collected via primary and secondary sources, we run that information for data validation. At our intelligence centre our research heads track a lot of information related to the market which includes the quarterly reports, the daily stock prices, and other relevant information. Our data bank server gets updated every fortnight and that is how the information which we collected using our primary and secondary information is revalidated in real time.

Step 4: QA/QC Process
After all the data collection and validation our team does a final level of quality check and quality assurance to get rid of any unwanted or undesired mistakes. This might include but not limited to getting rid of the any typos, duplication of numbers or missing of any important information. The people involved in this process include technical content writers, research heads and graphics people. Once this process is completed the title gets uploader on our platform for our clients to read it.
Step 5: Final QC/QA Process:
This is the last process and comes when the client has ordered the study. In this process a final QA/QC is done before the study is emailed to the client. Since we believe in giving our clients a good experience of our research studies, therefore, to make sure that we do not lack at our end in any way humanly possible we do a final round of quality check and then dispatch the study to the client.