Zigbee Market Size & Trends:
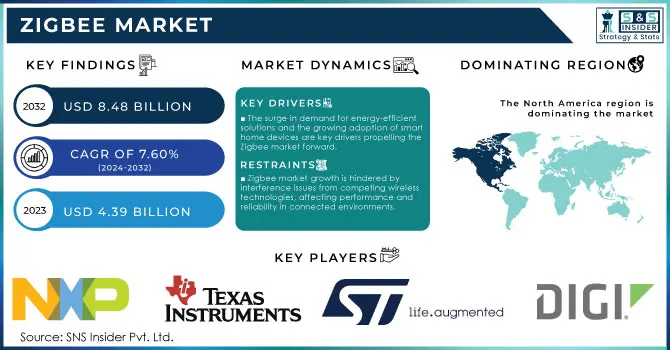
The Zigbee Market Size was valued at USD 4.72 Billion in 2024 and is expected to reach USD 8.49 Billion by 2032 and grow at a CAGR of 7.60% over the forecast period 2025-2032.
The Zigbee market is witnessing robust growth, driven primarily by the increasing adoption of smart home technologies. With the rising popularity of smart devices such as lighting, security systems, and HVAC controls, there is a burgeoning demand for reliable communication protocols, and Zigbee stands out due to its energy efficiency and interoperability. According to the Connectivity Standards Alliance (CSA), the number of Zigbee devices has grown to over 400 million by 2021, with a record of 66 million Zigbee devices shipped in 2020 alone. Additionally, the CSA reported that there were 1,823 Zigbee-certified products available in 2021, reflecting a growing ecosystem of compatible devices.
Get more information on Zigbee Market - Request Sample Report
The emergence of platforms like Matter, which aims to unify smart home devices and improve interoperability across different ecosystems, has further strengthened Zigbee's position in the market. Wired emphasizes that Zigbee's established ecosystem provides a reliable foundation for smart home applications, ensuring devices can work together effectively. The technology’s low power consumption makes it an ideal choice for battery-operated devices, supporting longer operational lifetimes crucial for maintaining smart home functionality. According to a report by ABI Research, the Zigbee market is expected to grow significantly, with an anticipated 75% increase in smart lighting installations utilizing Zigbee technology by 2025.
Zigbee Market Highlights:
-
Growing demand for energy-efficient and low-power connectivity solutions drives Zigbee adoption across smart home and IoT applications.
-
Battery-operated devices benefit from Zigbee’s extended operational lifetime, reducing energy costs and carbon footprint.
-
Smart lighting, security, and home automation systems integrated with Zigbee offer significant energy savings and seamless interoperability.
-
Interference from Wi-Fi and Bluetooth in the 2.4 GHz band remains a major restraint, causing packet loss and reduced network reliability.
-
Urban density and overlapping wireless technologies challenge Zigbee’s performance, requiring additional routers or repeaters for stable operation.
-
Despite interference concerns, the growing IoT ecosystem positions Zigbee as a key connectivity standard for sustainable and efficient smart devices.
Zigbee Market Drivers:
-
The surge in demand for energy-efficient solutions and the growing adoption of smart home devices are key drivers propelling the Zigbee market forward.
ZigBee’s low power consumption is a significant market driver, making it an ideal choice for battery-operated devices and supporting longer operational lifetimes. As energy efficiency becomes increasingly critical in today’s technology landscape, Zigbee stands out for its ability to minimize energy usage while maintaining reliable connectivity. This is especially important for smart home devices, where users seek to reduce their carbon footprint and energy bills. According to Science Daily, energy-efficient technologies could save the world 70% of energy costs by 2050, underscoring the urgent need for solutions like Zigbee in combating climate change. Moreover, research indicates that 74% of consumers prefer energy-efficient products, further fueling the demand for Zigbee-enabled devices. The appeal of smart lighting systems, which can seamlessly integrate with Zigbee networks, exemplifies this trend, offering substantial energy savings of up to 80% compared to traditional lighting options. As highlighted by Bangalore Mirror, the shift towards energy-efficient devices is not just a consumer preference but a necessity in the broader context of sustainable living. With the ongoing growth of the Internet of Things (IoT) expected to reach USD 1.1 trillion by 2026, Zigbee's energy efficiency positions it favorably in a competitive market, driving its adoption across various applications and sectors.
Zigbee Market Restraints:
-
Zigbee market growth is hindered by interference issues from competing wireless technologies, affecting performance and reliability in connected environments.
Zigbee technology operates primarily in the 2.4 GHz frequency band, a spectrum shared with many other wireless communication protocols such as Wi-Fi and Bluetooth. This overcrowding can lead to significant interference, which can negatively impact the performance and reliability of Zigbee networks. As Zigbee devices communicate over a limited bandwidth, the presence of competing signals from Wi-Fi routers or Bluetooth devices can cause packet loss, reduced range, and slower communication speeds. This interference is particularly problematic in densely populated areas, where multiple devices are in use simultaneously. Zigbee networks may suffer from over 50% packet loss in scenarios with heavy interference, leading to frustration among users seeking reliable smart home solutions. To mitigate these interference issues, users can implement various strategies, such as optimizing their Zigbee network setup by adding routers or repeaters, which help extend the range and stability of the network. Additionally, separating Zigbee devices from Wi-Fi routers and minimizing the number of active devices in close proximity can improve performance. Despite these potential solutions, the inherent challenge of interference remains a significant restraint for the Zigbee market, potentially limiting its adoption in environments saturated with wireless technologies. As consumers and businesses increasingly seek reliable smart home and IoT solutions, overcoming interference challenges will be crucial for Zigbee's growth and sustainability in the market.
Zigbee Market Segment Analysis:
By Device
In the Zigbee market, Zigbee Home Automation holds a dominant share, accounting for 47% of total revenue in 2024. This significant share reflects the growing demand for smart home solutions that enhance convenience, energy efficiency, and security. Zigbee home automation encompasses a variety of devices, including smart lighting systems, thermostats, security cameras, door locks, and sensors, enabling users to control and monitor their home environments remotely. Recent product developments have further fueled this growth; for example, Philips Hue has expanded its range with Zigbee-compatible bulbs that improve interoperability, while Samsung SmartThings has introduced new Zigbee-enabled sensors for enhanced security and energy management. Amazon has also integrated Zigbee into its Echo devices, facilitating seamless control of various smart home products via voice commands. Increased consumer awareness of energy conservation and the convenience of automation has driven the adoption of Zigbee-enabled devices. As smart home technology becomes more mainstream, the demand for seamless interoperability between devices solidifies Zigbee's position as a preferred communication protocol. Ongoing innovations in IoT technology allow manufacturers to incorporate Zigbee capabilities into new products, aligning with consumer expectations for smarter, more connected homes, ensuring Zigbee home automation's leading position in the market for years to come.
By Application
In the Zigbee market, the Home Automation application segment captured the largest share of revenue, accounting for approximately 50% in 2024. This substantial share is primarily driven by the increasing consumer demand for smart home solutions that enhance convenience, security, and energy efficiency. Home automation encompasses a wide range of devices and applications, including smart lighting, thermostats, security systems, and various sensors that work together to create an interconnected home environment. The growing popularity of smart lighting systems is a key contributor to this segment's success, as these systems allow homeowners to customize lighting based on their preferences and energy usage. For instance, Philips has expanded its Hue line with new Zigbee-compatible smart bulbs that provide enhanced interoperability with other Zigbee devices, allowing users to control their lighting seamlessly through voice commands and mobile apps. Similarly, Samsung SmartThings has introduced new Zigbee-enabled sensors that enhance home security and energy management, including door/window sensors and motion detectors that can integrate with existing smart home ecosystems. The integration of Zigbee into Amazon's Echo devices has also been pivotal, as it enables users to manage their Zigbee-compatible devices via voice commands, making home automation more accessible and user-friendly. Security systems also play a vital role in the Home Automation segment. Zigbee-compatible security cameras, door locks, and motion sensors offer homeowners real-time monitoring and control over their property. Recent product launches, such as August's Zigbee-enabled smart locks, illustrate the trend toward integrating advanced security features with user-friendly smart home technology.
Furthermore, the increasing awareness of energy conservation and the desire for sustainable living solutions are propelling the adoption of home automation technologies. As smart home technology continues to gain traction, the Home Automation application segment is expected to maintain its dominant position in the Zigbee market, driven by innovations and advancements that meet consumer demands for enhanced connectivity and automation.
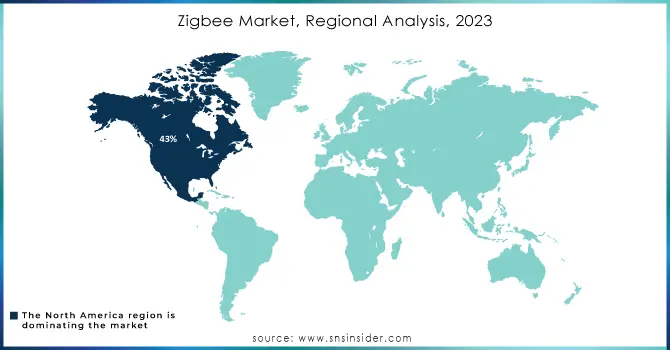
North America Zigbee Market Trends
In 2024, North America emerged as the dominant region in the Zigbee market, capturing approximately 43% of the total revenue. This leadership can be attributed to several factors, including the high adoption rate of smart home technologies, robust investments in the Internet of Things (IoT), and a growing emphasis on energy efficiency and automation. The United States, in particular, has seen a surge in consumer demand for smart home devices, driving the growth of Zigbee-enabled solutions across various applications. The proliferation of smart lighting, security systems, and HVAC controls has significantly contributed to the region's market share. Major players, such as Philips and Amazon, have played a pivotal role by introducing Zigbee-compatible products that enhance interoperability and ease of use. For instance, Amazon's integration of Zigbee into its Echo devices has facilitated seamless control of smart home products, making it easier for consumers to adopt these technologies. Additionally, the presence of well-established technology companies and a strong manufacturing base further bolsters the Zigbee market in North America. Companies are increasingly focusing on product development and innovation, launching new Zigbee-enabled devices to cater to evolving consumer preferences. This trend is evidenced by recent product launches from brands like Samsung and Signify, which enhance home automation and security features, creating a more cohesive smart home experience. The region's strong regulatory support for energy-efficient solutions, coupled with heightened consumer awareness regarding sustainability, is also driving the adoption of Zigbee technology. As energy conservation becomes a priority for many households, Zigbee's low power consumption and reliable connectivity make it an attractive choice for smart home applications. North America is poised for continued growth in the Zigbee market, with increasing investment in smart home infrastructure and advancements in IoT technologies. The anticipated expansion of the smart home market, combined with the ongoing development of innovative Zigbee-enabled devices, is expected to solidify North America’s leadership position in the global Zigbee market.
Asia-Pacific Zigbee Market Trends
Asia Pacific is rapidly establishing itself as the second fastest-growing region in the Zigbee market, driven by strong demand for smart home and IoT applications. This growth is fueled by several factors, including swift urbanization, rising disposable incomes, and an expanding middle class eager to embrace advanced technologies. Leading countries such as China, India, and Japan are at the forefront of this trend, supported by government initiatives aimed at promoting smart cities and enhancing digital infrastructure.
The region is witnessing significant growth in the adoption of smart home devices, including lighting, security systems, and energy management solutions. For example, Xiaomi has launched various Zigbee-enabled products, such as smart sensors and lighting options, to cater to the increasing need for interconnected home environments. Similarly, Philips is broadening its range of Zigbee-compatible offerings, emphasizing its dedication to innovation in smart lighting. Key regional players like Samsung and TP-Link are also developing Zigbee-enabled devices to enhance the interoperability of smart home ecosystems. Samsung's new Zigbee-enabled smart appliances promote seamless integration with its SmartThings platform, while TP-Link's expanded Kasa Smart line includes Zigbee products, providing consumers with more choices.
Europe Zigbee Market Trends
Europe is a key region in the global Zigbee market, driven by stringent energy efficiency mandates, investments in smart infrastructure, and growing adoption across residential and commercial sectors. Countries such as Germany, the UK, and France are leading this trend. The market is expanding due to increasing integration of Zigbee modules in smart home and industrial ecosystems, supported by regulations promoting sustainability and digital innovation.
Latin America Zigbee Market Trends
Latin America is witnessing steady growth in the Zigbee market, supported by urbanization, expanding digital infrastructure, and growing interest in smart retail, healthcare, and utility automation. Brazil and Mexico are key contributors, with initiatives focused on digital transformation and affordable automation solutions accelerating adoption across the region.
Middle East & Africa (MEA) Zigbee Market Trends
The Middle East and Africa are gradually emerging as important regions for the Zigbee market. Growth is driven by smart city projects, infrastructure modernization, and increasing investments in building automation, particularly in countries such as the UAE and Saudi Arabia. Zigbee's low energy consumption and mesh networking capabilities make it a preferred choice for IoT deployments in urban planning and telecom infrastructure.
Get Customized Report as per your Business Requirement - Request For Customized Report
Key Zigbee Companies are:
-
NXP Semiconductors (Zigbee transceivers, microcontrollers)
-
Texas Instruments (Zigbee system-on-chips (SoCs), wireless connectivity modules)
-
Silicon Laboratories (Zigbee modules, SoCs, development kits)
-
STMicroelectronics (Zigbee chips, wireless connectivity solutions)
-
Digi International (Zigbee gateways, routers, modules)
-
Qualcomm (Zigbee chipsets, IoT connectivity platforms)
-
Microchip Technology (Zigbee RF transceivers, wireless modules)
-
Cypress Semiconductor (Zigbee wireless solutions, microcontrollers)
-
Honeywell International (Zigbee-enabled smart thermostats, sensors)
-
Schneider Electric (Zigbee smart energy management systems)
-
Philips Lighting (Signify) (Zigbee-enabled smart lighting solutions, bulbs)
-
Belkin International (Zigbee-enabled smart home devices, smart plugs)
-
Osram Licht AG (Zigbee smart lighting solutions)
-
Johnson Controls (Zigbee-enabled building automation systems)
-
Legrand (Zigbee-connected smart switches, lighting systems)
-
Amazon (Zigbee-enabled Echo devices, smart home controllers)
-
Samsung Electronics (Zigbee-enabled smart home hubs, appliances)
-
Huawei Technologies (Zigbee IoT solutions, smart home systems)
-
Xiaomi (Zigbee-enabled smart home devices, sensors)
-
Bosch (Zigbee-enabled security systems, sensors)
List of Zigbee raw material suppliers, focusing on companies that provide materials for the semiconductors and electronic components used in Zigbee modules and devices:
-
Dupont
-
BASF
-
Dow Inc.
-
3M
-
Shin-Etsu Chemical Co., Ltd.
-
Sumitomo Chemical
-
Applied Materials
-
Evonik Industries
-
Linde Group
-
Air Liquide
Zigbee Market Competitive Insights:
Samsung Electronics Founded in 1969, is a global leader in consumer electronics, semiconductors, and smart home solutions. The company develops Zigbee-enabled hubs, appliances, and smart devices, providing seamless connectivity and integration across its SmartThings platform for enhanced home automation experiences.
-
October 14, 2024: Samsung has released a firmware update for the SmartThings hub that enhances Zigbee connectivity and resolves known issues with device pairing, significantly improving the overall user experience and stability of smart home devices. Users are encouraged to install the update to optimize performance.
Samsung Electronics Founded in 1969, is a global leader in consumer electronics, semiconductors, and smart home solutions. The company develops Zigbee-enabled hubs, appliances, and smart devices, providing seamless connectivity and integration across its SmartThings platform for enhanced home automation experiences.
-
September 28, 2024): Aqara has launched its latest Zigbee hub models, including the Hub M2 and the Camera Hub G2H, in the UK market, expanding its smart home ecosystem and enhancing HomeKit compatibility for a broader range of devices. This launch follows the gradual introduction of Aqara products to various regions since the original hub's debut in 2018.
Mouser Electronics Founded in 1964, is a leading global distributor of semiconductors and electronic components. It provides Zigbee-compatible modules, connectivity solutions, and a wide range of components that support IoT and smart home technologies worldwide.
-
October 4, 2024: Mouser Electronics has announced the availability of the WBZ350 module, which integrates Bluetooth and Zigbee radios with a secure microcontroller from Microchip. This module is built on the PIC32CX-BZ family, featuring a 64MHz Arm Cortex M4F processor, enhancing connectivity and security for IoT applications.
Espressif Systems Established in 2008, is a leading semiconductor company known for its Wi-Fi and Bluetooth microcontrollers, including the ESP32 series. The company supports Zigbee technology integration for smart home and IoT applications, enabling efficient wireless connectivity.
-
August 23, 2024: A new Zigbee wrapper library has been added to the Arduino Core for ESP32 by an Espressif engineer, enhancing support for Zigbee on newer ESP32-H2 and ESP32-C6 wireless SoCs. This development simplifies integration, allowing these chips to function as standalone Zigbee nodes or as radio co-processors.
| Report Attributes | Details |
|---|---|
| Market Size in 2024 | USD 4.72 Billion |
| Market Size by 2032 | USD 8.49 Billion |
| CAGR | CAGR of 7.60% From 2025 to 2032 |
| Base Year | 2024 |
| Forecast Period | 2025-2032 |
| Historical Data | 2021-2023 |
| Report Scope & Coverage | Market Size, Segments Analysis, Competitive Landscape, Regional Analysis, DROC & SWOT Analysis, Forecast Outlook |
| Key Segments | • By Standard Type (Zigbee RF4CE, Zigbee, Zigbee PRO, Zigbee 3.0, Zigbee Remote Control 2.0, Zigbee IP) • By Device Type (Zigbee Home Automation, Zigbee Smart Energy, Zigbee Light Link, Others) • By Application (Home Automation, Industrial Automation, Telecommunication Services, Healthcare, and others) |
| Regional Analysis/Coverage | North America (US, Canada), Europe (Germany, UK, France, Italy, Spain, Russia, Poland, Rest of Europe), Asia Pacific (China, India, Japan, South Korea, Australia, ASEAN Countries, Rest of Asia Pacific), Middle East & Africa (UAE, Saudi Arabia, Qatar, South Africa, Rest of Middle East & Africa), Latin America (Brazil, Argentina, Mexico, Colombia, Rest of Latin America). |
| Company Profiles | NXP Semiconductors, Texas Instruments, Silicon Laboratories, STMicroelectronics, Digi International, Qualcomm, Microchip Technology, Cypress Semiconductor, Honeywell International, Schneider Electric, Philips Lighting (Signify), Belkin International, Osram Licht AG, Johnson Controls, Legrand, Amazon, Samsung Electronics, Huawei Technologies, Xiaomi, and Bosch are key players in the Zigbee market. |
Frequently Asked Questions
Ans : The Expected CAGR in Zigbee is 7.60% in 2024
Ans: Zigbee Home Automation is dominating in Zigbee Market in 2024
Ans: North America is dominating in Zigbee Market in 2024
Ans: Low level of energy consumption and IOT technology are the drivers of ZigBee Market.
Ans: The Zigbee Market Size was valued at USD 4.72 Billion in 2024 and is expected to reach USD 8.49 Billion by 2032
Get in Touch
