Virtual Visor Market Report & Overview:
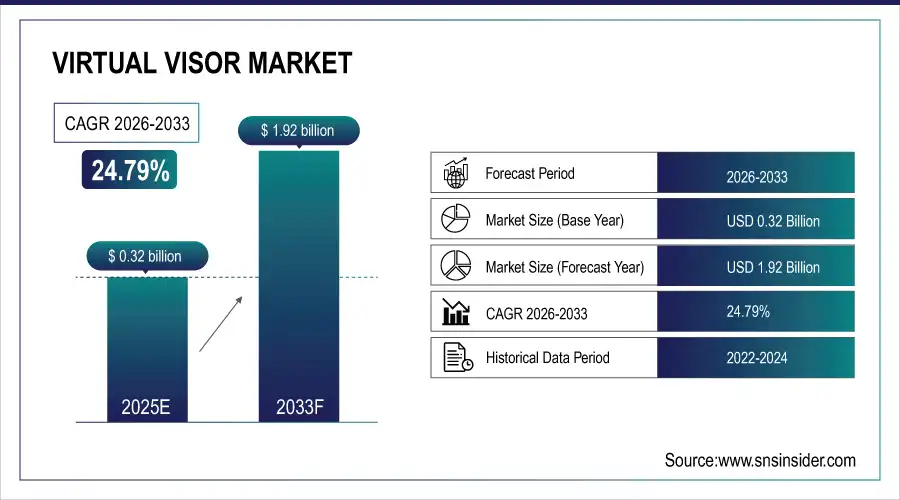
The Virtual Visor Market Size was valued at USD 0.32 billion in 2025E and is estimated to reach USD 1.92 billion by 2033 and grow at a CAGR of 24.79% over the forecast period 2026-2033.
The virtual visor industry is quickly expanding due to progress in display and AI technologies. LCDs and OLEDs that are transparent, allowing for dynamic opacity adjustments, provide improved glare reduction while maintaining visibility. AI algorithms assess current data to enhance visor transparency by adjusting to sun position and driver eye movement, leading to notable enhancements in driving safety and comfort. The increased use of advanced driver assistance systems (ADAS) is speeding up the inclusion of virtual visors. By 2023, the number of light vehicles with global L2+ ADAS technology hit 630,000 units, representing a 3.1% market penetration, with China taking the lead at 5.7%. A significant portion of the market was held by Germany and the US. Global L2+ equipped vehicle numbers are predicted to reach 4.5 million in 2024, doubling from 2 million in 2023, with a 5.5% penetration rate, largely driven by China.
Market Size and Forecast: 2025E
-
Market Size in 2025E USD 0.32 Billion
-
Market Size by 2033 USD 1.92 Billion
-
CAGR of 24.79% From 2026 to 2033
-
Base Year 2025E
-
Forecast Period 2026-2033
-
Historical Data 2021-2024
Get More Information on Virtual Visor Market - Request Sample Report
Virtual Visor Market Growth Drivers:
-
Road safety is a driving factor in the development of virtual visors.
The growing global emphasis on road safety is a strong motivation for the virtual visor sector. Visibility-related problems, a leading factor in accidents, are receiving significant attention due to the World Health Organization's report of around 1.19 million deaths from road accidents each year. Conventional sun visors are frequently insufficient, leaving drivers exposed to glare. Advanced technology in virtual visors offers a compelling solution. These visors enhance visibility and reduce accident risks by adjusting opacity according to sunlight conditions. The urgency of such innovations is highlighted by the United Nations' ambitious goal to cut road fatalities in half by 2030.Even though fatal crash rates in the U.S. have decreased from 30.8 to 14.3 per 100,000 people since 1937, the country still sees around 43,000 fatal crashes annually.
Virtual Visor Market Restraints:
-
Pricing and technological difficulties are delaying the widespread use of virtual visors.
Although virtual visors show great potential, they face major obstacles that prevent their widespread use. The complex nature of the technology, which relies on advanced LCDs and AI, increases production costs, making it a high-end feature that is often out of reach for the general public. Incorporating these systems into current vehicles presents technical challenges, creating obstacles for smaller manufacturers. Furthermore, consumer worries are heightened by potential technical issues and the accompanying costs of maintenance. These problems are worsened by the wider EV environment. Even though new EV prices have decreased by 10%, repair costs for EVs are still 29% higher than those for traditional gasoline cars, and repairs also take almost twice as long.
Virtual Visor Market Segment Analysis:
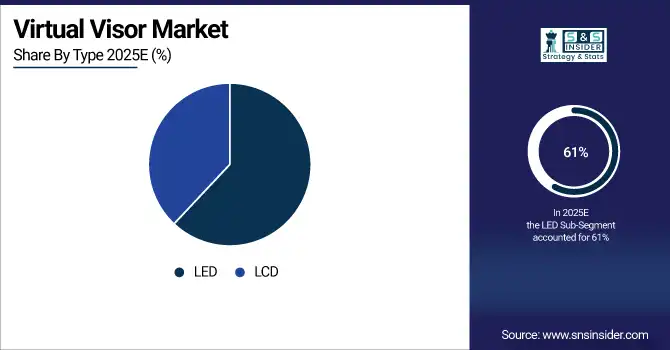
By Type
Based on Type, LED Type dominated the virtual Visor market with 61% of share in 2025E. LED technology has transformed the virtual visor industry with its outstanding performance features. Their high level of brightness and clarity greatly improve visibility by effectively reducing glare, especially in difficult lighting situations. LED virtual visors outperform traditional LCDs by effectively managing strong sunlight and quick lighting changes, with a focus on ensuring driver safety and comfort. Additionally, the built-in energy efficiency of LED technology is a significant benefit. LED virtual visors use much less power compared to LCD visors, aiding in managing the energy of vehicles. As an example, the LEDMAN DS Series, which utilizes advanced COB technology, cuts energy usage by around 50% when compared to similar products. With their long lifespan and strong durability, LEDs are a great option for the automotive sector, where dependability is crucial. This mix of effectiveness, energy savings, and durability cements LED technology as the top choice for virtual visors.
By Application
In 2025E, Passenger Vehicle was the leading segment in the virtual visor market, accounting for 63% of the market share. Virtual visors in cars are created to decrease glare from the sun, enhancing driver comfort and safety. Being able to electronically control the visor's opacity and position reduces eye strain and improves visibility in different lighting situations. Numerous cars come with virtual visors that have extra functions like adjusting glare in real time and personalized settings. These enhanced features are in line with what consumers expect from today's comfort-focused vehicles.
Virtual Visor Market Regional Analysis:
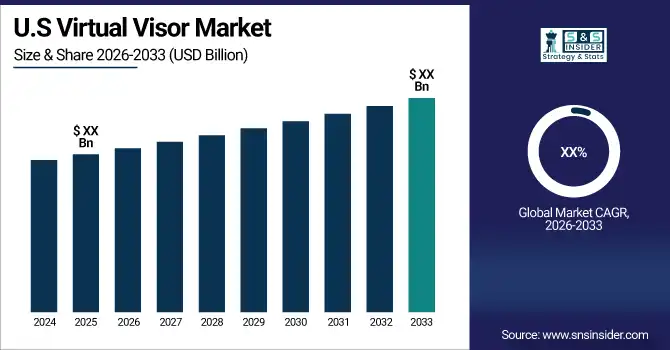
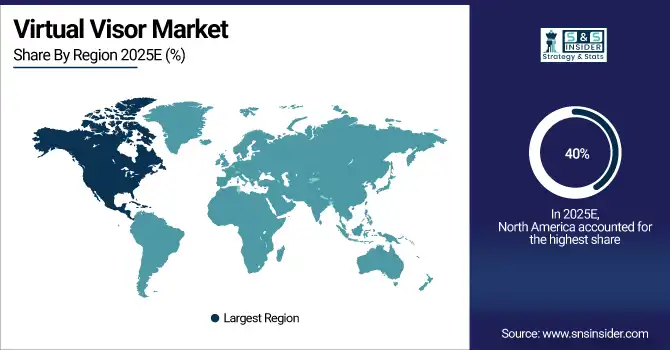
North America Virtual Visor Market Insights
North America dominated the virtual visor market with 40% of share in 2025E. Due to its leading technology, high demand for premium features by consumers, and strong market infrastructure. The automotive sector in the region, led by key companies such as General Motors, Ford, and Tesla, encourages innovation and quick uptake of cutting-edge technologies such as virtual visors. Major investments in research and development drive the creation of advanced features, strengthening North America's dominance in the market. Although facing obstacles, the area continues to be a strong force in manufacturing, with a yearly revenue of more than USD 500 billion and a workforce of 1.7 million individuals. The alliance of Mexico and Canada within the T-MEC agreement establishes North America as a strong player in the worldwide automotive industry, ready to advance and expand further.
Get Customized Report as per Your Business Requirement - Request For Customized Report
Europe Virtual Visor Market Insights
Europe is the fastest growing in virtual visor market with 21% of share in 2025E. The European Union has enforced stringent safety regulations for vehicles, requiring advanced driver assistance systems (ADAS) and safety enhancements. Virtual visors, which improve visibility and comfort for drivers, comply perfectly with these regulations. As car manufacturers aim to meet and surpass these requirements, the need for virtual visors is also increasing. Europe has a robust automotive sector with a deep tradition of technological advancement. Germany and France lead in creating advanced vehicle technologies, like virtual visors. Europe's advanced features have made it a significant market for implementing this technological excellence.
Asia Pacific Virtual Visor Market Insights
The Asia Pacific virtual visor market is expanding due to rapid growth in automotive manufacturing, rising vehicle production, and increasing focus on driver safety and comfort. Strong demand for advanced interior components, along with technological innovation in smart glass and AR-enabled visors, is supported by OEM investments across China, Japan, South Korea, and India, driving steady market adoption.
Latin America (LATAM) and Middle East & Africa (MEA) Virtual Visor Market Insights
The LATAM and MEA virtual visor market is developing gradually, supported by increasing automotive assembly activities and growing adoption of advanced driver assistance features. Rising awareness of road safety, improving vehicle interior standards, and investments by global OEMs in regional manufacturing facilities are contributing to the adoption of virtual visor technologies across these emerging markets.
Virtual Visor Market Key Players:
Some of the major players in the ROBERT BOSCH GMBH, ATLAS HOLDINGS, KÖBO GmbH & Co. KG, IRVINE AUTOMOTIVE PRODUCTS, Kasai Kygo Co.ltd, Mursion, Sunvisors India Private Limited, VISOR-AR, Weetect,Scope AR and other players.
Competitive Landscape for Virtual Visor Market:
Robert Bosch GmbH is a global leader in automotive and industrial technologies, offering advanced solutions for fault detection, predictive maintenance, and smart manufacturing. Leveraging AI, IoT, and machine vision, Bosch enhances quality control, operational efficiency, and safety across automotive, semiconductor, and industrial manufacturing sectors, driving digital transformation.
-
June 2025: Bosch announced a strategic investment of more than €2.5 billion in artificial intelligence through 2027 to accelerate advanced solutions for assisted and automated driving and manufacturing quality systems.
Atlas Holdings is a U.S. private equity and industrial investment firm that acquires and grows manufacturing and distribution businesses, particularly in automotive supply and industrial sectors. Founded in 2002 and headquartered in Greenwich, Connecticut, Atlas and its affiliates operate over 27 companies worldwide focused on long‑term operational performance and value creation
-
April 2025, Atlas Holdings announced the launch of RESRG Automotive following the acquisitions of REHAU Automotive and SRG Global, creating a global supplier of automotive exterior systems and components
| Report Attributes | Details |
|---|---|
| Market Size in 2025E | USD 0.32 Billion |
| Market Size by 2033 | USD 1.92 Billion |
| CAGR | CAGR of 24.79% From 2026 to 2033 |
| Base Year | 2025E |
| Forecast Period | 2026-2033 |
| Historical Data | 2021-2024 |
| Report Scope & Coverage | Market Size, Segments Analysis, Competitive Landscape, Regional Analysis, DROC & SWOT Analysis, Forecast Outlook |
| Key Segments | • By Type • By Application |
| Regional Analysis/Coverage | North America (US, Canada), Europe (Germany, UK, France, Italy, Spain, Russia, Poland, Rest of Europe), Asia Pacific (China, India, Japan, South Korea, Australia, ASEAN Countries, Rest of Asia Pacific), Middle East & Africa (UAE, Saudi Arabia, Qatar, South Africa, Rest of Middle East & Africa), Latin America (Brazil, Argentina, Mexico, Colombia, Rest of Latin America). |
| Company Profiles | ROBERT BOSCH GMBH, ATLAS HOLDINGS, KÖBO GmbH & Co. KG, IRVINE AUTOMOTIVE PRODUCTS, Kasai Kygo Co.ltd, Mursion, Sunvisors India Private Limited, VISOR-AR, Weetect,Scope AR |
Frequently Asked Questions
Ans: The North America is currently leading the pack in the virtual visor market by 40%.
Ans: Pricing and technological difficulties are delaying the widespread use of virtual visors. & Challenges in technology and financial limitations hinder the acceptance of virtual visors.
Ans: Road safety is a driving factor in the development of virtual visors. & Increased demand for virtual visors is being fueled by a focus on consumer preferences.
Ans: Virtual Visor Market size was USD 0.32 billion in 2025E and is expected to Reach USD 1.92 billion by 2033.
Ans: The Virtual Visor Market is expected to grow at a CAGR of 24.79%
Get in Touch
