Baler Market Report Scope & Overview:
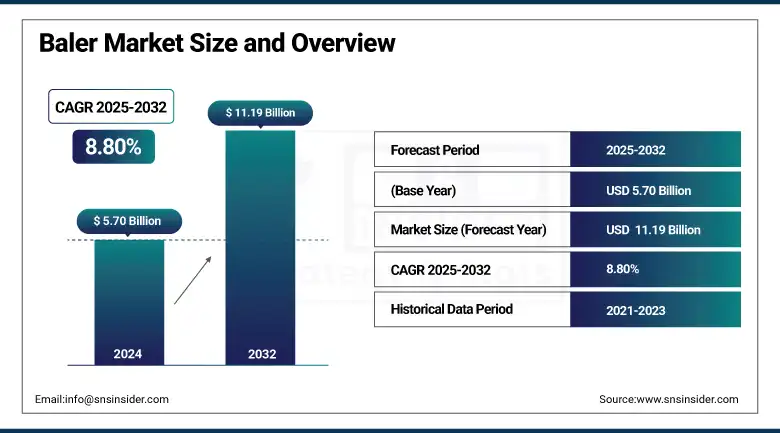
The Baler Market size was valued at USD 5.70 billion in 2024 and is expected to reach USD 11.19 billion by 2032, growing at a CAGR of 8.80% from 2025 to 2032.
The baler market is witnessing notable transformation driven by advancements in mechanized farming and growing demand for efficient waste management and crop residue handling. Agricultural straw balers are finding increasing adoption in the agriculture industry as average annual baler shipments are climbing due to an even greater demand for sustainable and efficient methods of collecting crop residue, especially for materials like hay, straw, and silage. They compress and pack material into compact bales, which allows for better storage, transportation, and operation. The baler market trend has been changing towards automation, smart controls, and energy-saving balers. Harnessing IoT sensory and telemetry features to monitor performance in real-time and predictive maintenance to reduce machine downtime. Moreover, the growing focus on environmental sustainability has further boosted the adoption of balers in recycling applications in the paper, plastic, and textile sectors.
From a demand perspective, more than 60% of baler use in agriculture is focused on straw and hay compaction, reflecting their core role in livestock feed and bedding management. The sale of agricultural straw baler units globally in the last few years has crossed over 30,000 units, indicating stable baler market growth. For both large-scale farms and smallholder users, manufacturers are focusing on easy-to-operate and multi-functional balers. This ongoing evolution is also enhancing the need for balers in contemporary farming and material handling.
In March 2025, KUHN’s Baler Automation system was awarded the Technological Innovation Award at FIGAN 2025. This advanced system features GPS-controlled pick-up, Tractor-Implement Management (TIM), and automated bale handling functions. It enhances operator comfort, reduces machine wear, and optimizes baling efficiency. The system also enables data logging and integration with farm management software.
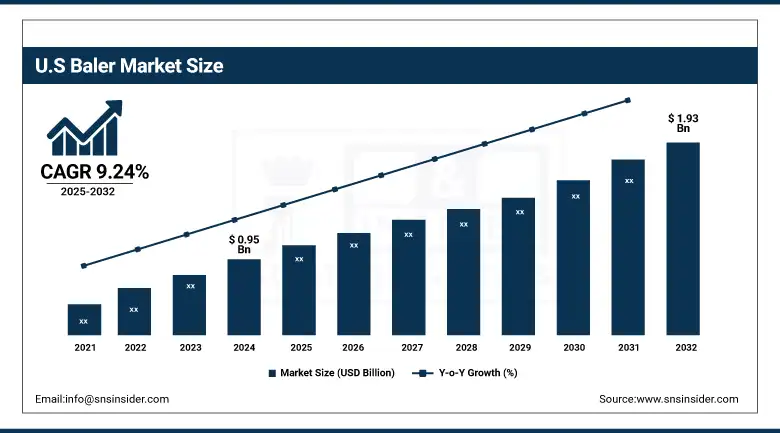
The U.S. baler market is projected to grow from 0.95 billion USD in 2024 to 1.93 billion USD by 2032, with a CAGR of 9.24%. This growth is driven by increasing adoption of advanced baling technologies and a focus on efficient crop residue management. The U.S. remains a key contributor to the overall North American baler market expansion.
Baler Market Dynamics:
Drivers
-
Rising Agricultural Mechanization Fuels Baler Adoption in Developing Economies Amid Labor Shortages and Efficiency Demands
Increasing mechanization of farming is expected to contribute significantly toward the adoption of global baler markets, especially in developing economies. Amid an ongoing labor shortage and growing pressure from increasing wages, farmers have begun looking to machines not just for productivity, but as a way to help lessen their reliance on human labor. Baler is used in modern farming and are most often used to collect the straw and hay when they are cut down. Meanwhile, research from a mutual partner company found more than 60% of farmers in emerging markets (such as India and Brazil) signaled interest in mechanized solutions to rising labor challenges over the next five years. In addition, a new study shows that mechanization can increase overall farm efficiency by an average of 25–30% with impacts on crop residue management. This trend is further driven by various subsidy schemes and awareness programs being held within different countries to encourage small and medium-scale farmers to invest in equipment, including baler, to improve their operational efficiencies and reduce the post-harvest losses.
In June 2025, Birsa Agriculture University (BAU) announced a survey on farm mechanization across seven districts in Jharkhand to assess current machine usage. The survey covers 70 villages and aims to identify areas needing improved mechanization, as most farmers still use traditional tools. While 26% of paddy tillage is mechanized, harvesting remains mostly manual. Results will help guide government efforts to promote farm mechanization in the region.
Restraints
-
High Initial Investment and Limited Financial Support Hinder Baler Adoption Among Small and Marginal Farmers
The high initial investment needed for balers makes it very challenging for small and marginal farmers who have very tight capital margins. Although machines can vary widely in price, these machines, especially those with automation and smart technology, can cost anywhere from thousands to tens of thousands of dollars, and therefore be out of reach for many. Recent agricultural equipment surveys show that close to 60% of small-scale farmers list high purchase price as a major obstacle for their adoption of mechanized solutions such as balers. Such a financial barrier is prohibitive to the adoption of balers in areas where small farms prevail. This lack of access to lower-cost credit or government support further compounds the issue by making it difficult for farmers to adopt more efficient harvesting and straw management technologies. This leads to a situation where most still depend on manual or traditional types of methods, which are less effective and consume more time. The second limitation can only be overcome through financial support schemes and flexible payment plans by farmers with limited availability of cash.
Baler Market Segmentation Outlook:
By Product
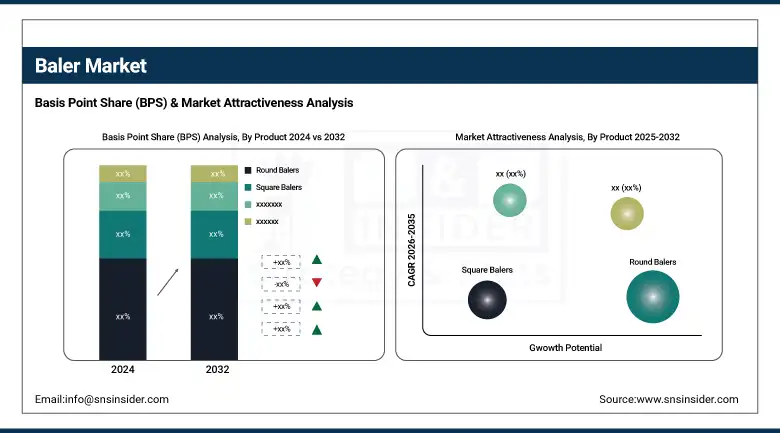
The Round Balers segment dominated the market, accounting for 58% of the Baler market share. Their vast popularity of applications is largely responsible for this prominence. Round balers are popular because they are efficient, presuming uniform loads develop easily, shippable, and stackable. Their strong design and dependability have made it a favorite among individuals and business users alike. Their continued market share, however, can be at least partially attributed to the round balers having a more established presence and proven performance. As a result, this segment remains the source of steady demand as well as the nucleus of product offering in the equipment for aromatherapy diffusers space.
The Square Balers segment is identified as the fastest-growing product category within the Aromatherapy Diffusers Market. This steep growth is driven by the requirement for smaller, more compact and dense bales which are easier to handle and stack. Users of square balers are interested in the greater storage space efficiency and improved bale uniformity that enable better logistics management with square balers. The adoption of square balers is also driven by technological advancements and innovations in square baler design, which enhance productivity and user-friendly operation. This has led consumers and commercial operation players to pivot towards more square balers, thus continuing their growth path as an important new contributor to the market tableau.
Baler Market Regional Analysis:
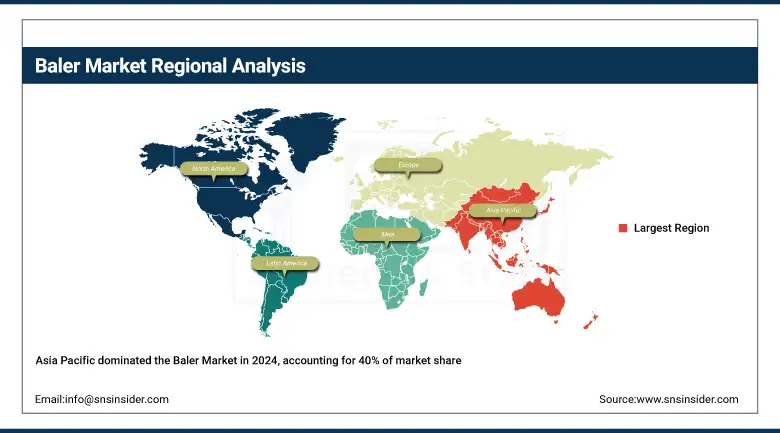
The Asia-Pacific region holds the dominant position in the baler market, accounting for approximately 40% of the market share in 2024. Such dominance has arisen from regional agriculture, particularly for countries such as China, India, and Southeast Asia, where agriculture continues to be an important sector of the economy. The market demand for balers is mainly driven by the increased mechanization of agriculture in order to achieve greater agricultural efficiency and productivity. In addition, the promotion of modern agricultural equipment by the governments in various nations, along with subsidies, also drives the market positively. With a wealth of large agro-industries and a vast rural population in the region, balers are used to handle crop residues and maximize the utilization of harvests, thus creating steady demand.
China is the dominant country in most markets due to its endless manufacturing base, consumer population, and speed of industrial growth. It tops technology, agriculture equipment, electronics, and consumer essentials offshore in the Asia-Pacific area, creating the most growth and market share.
North America is identified as the fastest-growing region in the baler market, fueled by advancements in agricultural technology and increased adoption of automated and smart balers. There is a growing trend among American and Canadian farmers to adopt mechanized farming solutions to increase the size of the functionality and reduce costs due to labor. Moreover, the increasing ease of access to sustainable agriculture practices and resourceful waste collection has stimulated the usage of balers. North America has advanced infrastructure, government policies favorable to the expansion of the market, and accelerated investment in the modernization of farms, which makes this region the most significant in terms of market value. The baler demand in this dynamic market is likely to see quick innovations, which will add further to the baler demand.
Europe holds a significant share in the baler market, backed by well-established agricultural practices and a strong emphasis on sustainability and environmental regulations. In Europe, more farmers use balers for crop residue management as a means to limit straw waste to promote bioenergy that aligns with the green energy goals of the continent. The region continues to benefit from widespread mechanisation, mature farm technologies, and strong supply chains. Germany, France, and the UK represent mature market conditions with continuous demand for quality balers. Also contributing to Europe’s large market share is the presence of supportive governmental policies based on agricultural efficiency and sustainable policies.
Key Players in the Baler Market are:
Baler Companies are Mahindra & Mahindra Ltd., KUHN SAS, CNH Industrial N.V., KUBOTA Corporation, SDF Group, CLAAS KGaA mbH, AGCO Corporation, Maschinenfabrik Bernard KRONE GmbH & Co.KG, Deere & Company, IHI Corporation
Recent Development:
-
In February 2025, KUHN received the Technological Innovation award at FIGAN 2025 for its advanced baler automation system. This system features GPS-controlled pickup and fully automated baling cycles, improving efficiency and operator comfort. It enhances tractor and baler performance, reduces wear, and boosts farm profitability.
-
In May 2025, CNH Industrial unveiled a new strategic business plan aiming to strengthen its market leadership and improve profit margins by 2030. The plan focuses on integrating advanced technology with traditional machinery, enhancing quality, and expanding operational efficiency. CNH targets a 16–17% EBIT margin in agriculture and plans over USD 550 million in cost improvements. This initiative is expected to boost profitability and increase cash generation significantly.
| Report Attributes | Details |
|---|---|
| Market Size in 2024 | USD 5.70 Billion |
| Market Size by 2032 | USD 11.19 Billion |
| CAGR | CAGR of 8.80% From 2025 to 2032 |
| Base Year | 2024 |
| Forecast Period | 2025-2032 |
| Historical Data | 2021-2023 |
| Report Scope & Coverage | Market Size, Segments Analysis, Competitive Landscape, Regional Analysis, DROC & SWOT Analysis, Forecast Outlook |
| Key Segments | • By Product (Round Balers, Square Balers [Small Square Balers, Large Square Balers]) |
| Regional Analysis/Coverage | North America (US, Canada, Mexico), Europe (Germany, France, UK, Italy, Spain, Poland, Turkey, Rest of Europe), Asia Pacific (China, India, Japan, South Korea, Singapore, Australia, Rest of Asia Pacific), Middle East & Africa (UAE, Saudi Arabia, Qatar, South Africa, Rest of Middle East & Africa), Latin America (Brazil, Argentina, Rest of Latin America) |
| Company Profiles | Mahindra & Mahindra Ltd., KUHN SAS, CNH Industrial N.V., KUBOTA Corporation, SDF Group, CLAAS KGaA mbH, AGCO Corporation, Maschinenfabrik Bernard KRONE GmbH & Co.KG, Deere & Company, IHI Corporation |
Frequently Asked Questions
The Asia-Pacific region dominated the Baler Market in 2024.
The “Round Balers” segment dominated the Baler Market.
Rising Agricultural Mechanization Fuels Baler Adoption in Developing Economies Amid Labor Shortages and Efficiency Demands
The Baler Market was USD 5.70 billion in 2024 and is expected to reach USD 11.19 billion by 2032.
The Baler Market is expected to grow at a CAGR of 8.80% from 2025 to 2032.
Get in Touch
