Beer Cans Market Report Scope And Overview:
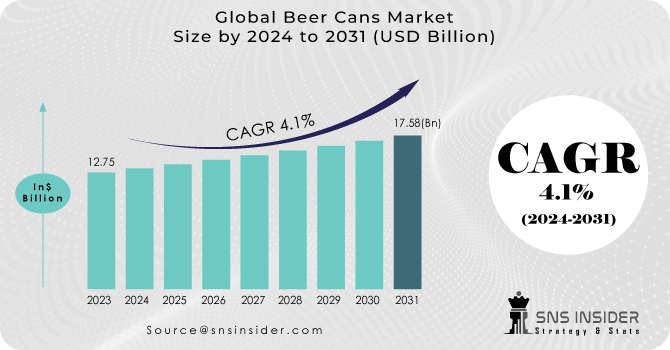
The Beer Cans Market size was USD 12.75 billion in 2023 and is expected to reach USD 17.58 billion by 2031 and grow at a CAGR of 4.1% over the forecast period of 2024-2031.
Get More Information on Beer Cans Market - Request Sample Report
MARKET DYNAMICS
The surge in the beer can market is driven by shifting consumer tastes towards a diverse selection of flavorful beers, highlighting a growing demand for convenient packaging solutions. Additionally, rising beer consumption in emerging markets such as China and India is expected to further drive demand for beer cans. In May 2019, Can Pack India Pvt Ltd, a beverage can manufacturer within the CANPACK group, unveiled the establishment of the Aluminum Beverages Can Association of India (ABCAI) in collaboration with Hindalco Industries Ltd and Ball Beverage Packaging (India) Pvt Ltd. The aim is to advocate for the adoption of aluminum cans for beverage packaging.
Resource Recycling Systems reports a global recycling rate of 69% for aluminum cans, while in the United States, aluminum cans contain 68% recycled material compared to only 3% for plastic bottles, as per the US Environmental Protection Agency (EPA). This higher recycling rate for aluminum cans is expected to drive increased consumption for craft brews. As per the Brewers Association, the count of breweries in the United States has risen to 8,386. A significant portion of these breweries are transitioning to aluminum due to its lower cost, superior beer protection qualities, and reduced environmental impact.
KEY DRIVERS:
-
Increasing worldwide beer consumption fuels the need for beer cans, which are indispensable packaging solutions for this widely consumed beverage.
Shifting cultural patterns, along with a 55% rise of urbanization worldwide, rising population, and the growing popularity of beer among the youth, contribute to the continuous growth in demand for packaging solutions such as beer cans.
-
The growth of the beverage industry, encompassing craft beers and ready-to-drink beverages, fuels the demand for efficient packaging solutions such as beer cans.
RESTRAIN:
-
The preference for wine among customers may present a challenge to the beer can industry.
-
Challenges in sourcing sustainable packaging materials and meeting environmental regulations.
OPPORTUNITY:
-
Government initiatives aimed at decreasing the usage of plastic and glass in alcohol packaging have created opportunities for metal packaging formats like beer cans to penetrate new markets.
-
Advancements in beer can manufacturing technology enhance both production quality and efficiency, rendering cans more cost-effective and readily available to breweries.
The robust beverage market, fueled by trends such as craft beers and ready-to-drink options, is generating a significant demand for efficient packaging solutions. Innovations in beer can manufacturing have enhanced the cost-effectiveness and quality of cans, making them increasingly favored by breweries and contributing to their widespread adoption.
CHALLENGES:
-
Stringent government regulations, such as taxation policies and limitations on alcohol advertising, could present obstacles to market expansion.
-
Escalating health concerns and evolving consumer preferences towards healthier options may influence the beer market.
IMPACT OF RUSSIAN UKRAINE WAR
The direct impacts of the Russia-Ukraine conflict on the beer value chain are relatively constrained, given that both countries are self-reliant. However, the indirect repercussions will be significant, intensifying existing inflationary pressures. Anticipated further cost escalations are likely to erode margins for industry operators, leading to increased prices for consumers, or potentially a blend of both. While companies have previously been cautious about restructuring their operations, the persistence of inflation suggests a growing momentum towards localizing the value chain. Malting barley prices in Western Europe have surged by 48%. This escalation will significantly affect maltsters, as barley inputs constitute 64% of their costs. While brewers will experience a less severe impact, with barley representing only 4.5% of their costs, there remains a risk of protectionist measures disrupting the entire value chain.
IMPACT OF ECONOMIC SLOWDOWN
While it may seem reasonable to expect that sales of inexpensive beers rise during economic downturns, resulting in a decrease in demand for high-end beers, the relationship between beer sales and recessions is often more nuanced than assumed. As consumer spending decreases during economic downturns, there is typically a shift towards more affordable beverage options, including beer. This can lead to an increase in demand for beer cans, as they are often perceived as a cost-effective packaging solution for breweries. Additionally, during economic downturns, consumers may opt for at-home consumption of beverages rather than dining out, further driving the demand for beer cans. However, the overall purchasing power of consumers may still be reduced, which could constrain the growth of the beer can market to some extent. The e-commerce sector for alcohol is significantly contributing to industry expansion.
KEY MARKET SEGMENTS
By Material
-
Aluminum
-
Steel
-
Tin
The aluminum segment dominates the global market, comprising over 62% of the total volume sold worldwide. Growing recycling initiatives and strict government regulations, driven by concerns about natural resource depletion, are contributing to the increasing demand for beer cans in the market.
By Capacity
-
330 ml
-
500 ml
-
1000 ml
-
Others
In terms of capacity, the 500 ml segment held the majority share, exceeding 55%, in the global beer market. This segment, including sizes of 16 ounces or larger, primarily dominated due to the presence of premium and economy brands in various outlets like convenience stores, pubs, and clubs. Conversely, the 330 ml segment is anticipated to witness rapid growth, driven by increasing demand for alcohol among millennials.
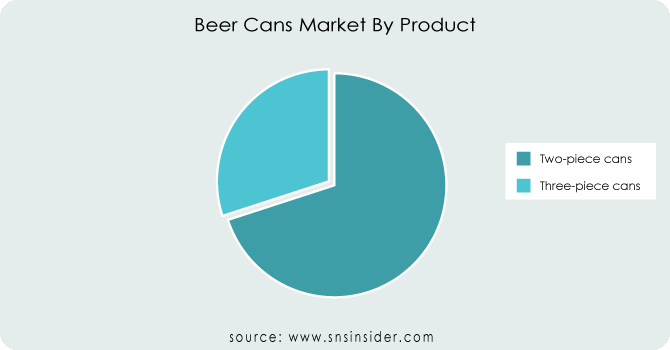
By Product
-
Two-piece cans
-
Three-piece cans
The segment for two-piece cans is forecasted to experience a higher growth rate. Two-piece cans offer numerous advantages over three-piece cans. With no side seam between the body and bottom end, two-piece cans ensure a tightly sealed container while consuming less raw material. Additionally, the manufacturing process for two-piece cans is simpler and more efficient compared to three-piece cans.
Get Customized Report as per Your Business Requirement - Request For Customized Report
By Filling Method
-
Vacuum Filling
-
Pressure Filling
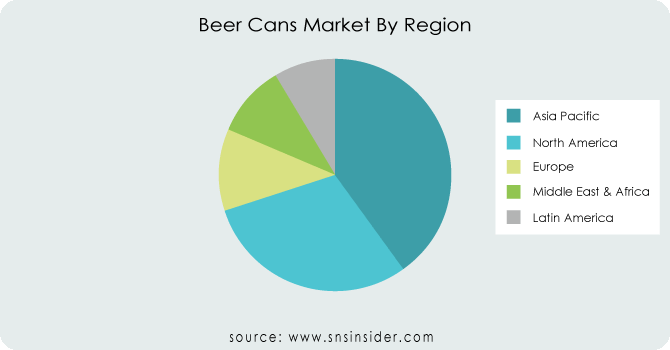
REGIONAL ANALYSIS
The Asia Pacific region is positioned to emerge as a prominent player in the beer can market, driven by its sizable and expanding population, which fuels rising beer consumption. The region's lower production costs further enhance its appeal to beer can manufacturers. The region has established itself as the leading provider of processed aluminum and steel sheets worldwide. The adoption of aluminum cans has risen alongside disposable income and the demand for convenient and portable food and beverages. Heineken, headquartered in Amsterdam, expanded its stake in United Breweries, the largest beer manufacturer in India located in Bangalore. This move highlights the substantial growth prospects in India's beer packaging industry, which is expected to boost the utilization of beer cans. Japanese companies are capitalizing on the region's growth by expanding their presence in Southeast Asia, with a particular focus on investing in food and beverage packaging containers.
In Canada, beer consumption accounts for the highest share at approximately 30% of total consumption, followed by wine and spirits. The increasing beer consumption in the US and Canada is significantly contributing the growth of beer can market in the region. Additionally, the growing emphasis on sustainable packaging materials for beer packaging is expected to drive the growth of the beer can market in North America.
REGIONAL COVERAGE:
North America
-
US
-
Canada
-
Mexico
Europe
-
Eastern Europe
-
Poland
-
Romania
-
Hungary
-
Turkey
-
Rest of Eastern Europe
-
-
Western Europe
-
Germany
-
France
-
UK
-
Italy
-
Spain
-
Netherlands
-
Switzerland
-
Austria
-
Rest of Western Europe
-
Asia Pacific
-
China
-
India
-
Japan
-
South Korea
-
Vietnam
-
Singapore
-
Australia
-
Rest of Asia Pacific
Middle East & Africa
-
Middle East
-
UAE
-
Egypt
-
Saudi Arabia
-
Qatar
-
Rest of Middle East
-
-
Africa
-
Nigeria
-
South Africa
-
Rest of Africa
-
Latin America
-
Brazil
-
Argentina
-
Colombia
-
Rest of Latin America
Key players
Major players in the Beer Cans Market are Orora Packaging Australia, Nampak Bevcan, Daiwa Can Co, Toyo Seikan Group Holdings Ltd, Ball Corporation, Metal Container Corporation, Ardagh Group, Can-Pack, CPMC Holdings, Silgan Containers, and others.
Orora Packaging Australia-Company Financial Analysis
RECENT DEVELOPMENT
-
In March 2023, Anheuser-Busch revealed limited-edition Budweiser beer cans commemorating the 2023 Major League Baseball season. This collection showcases baseball-themed designs for 14 different MLB teams, incorporating each team's logo, colors, and a distinctive city skyline.
-
In May 2022, American Brew Crafts Pvt. Ltd. unveiled BlockBuster beer in a novel can presentation, providing lager and strong variations for a revitalizing experience. The convenient 500 ml can is designed to elevate social gatherings, parties, travel, and events.
| Report Attributes | Details |
| Market Size in 2023 | US$ 12.75 Billion |
| Market Size by 2031 | US$ 17.58 Billion |
| CAGR | CAGR of 4.1 % From 2024 to 2031 |
| Base Year | 2023 |
| Forecast Period | 2024-2031 |
| Historical Data | 2020-2022 |
| Report Scope & Coverage | Market Size, Segments Analysis, Competitive Landscape, Regional Analysis, DROC & SWOT Analysis, Forecast Outlook |
| Key Segments | • By Material (Aluminum, Steel, Tin) • By Capacity (330 Ml, 500 Ml, 1000 Ml, Others) • By Product (Two-Piece Cans, Three-Piece Cans) • By Filling Method (Vacuum Filling, Pressure Filling) |
| Regional Analysis/Coverage | North America (US, Canada, Mexico), Europe (Eastern Europe [Poland, Romania, Hungary, Turkey, Rest of Eastern Europe] Western Europe] Germany, France, UK, Italy, Spain, Netherlands, Switzerland, Austria, Rest of Western Europe]), Asia Pacific (China, India, Japan, South Korea, Vietnam, Singapore, Australia, Rest of Asia Pacific), Middle East & Africa (Middle East [UAE, Egypt, Saudi Arabia, Qatar, Rest of Middle East], Africa [Nigeria, South Africa, Rest of Africa], Latin America (Brazil, Argentina, Colombia, Rest of Latin America) |
| Company Profiles | Orora Packaging Australia, Nampak Bevcan, Daiwa Can Co, Toyo Seikan Group Holdings Ltd, Ball Corporation, Metal Container Corporation, Ardagh Group, Can-Pack, CPMC Holdings, Silgan Containers |
| Key Drivers | • Increasing worldwide beer consumption fuels the need for beer cans, which are indispensable packaging solutions for this widely consumed beverage. • The growth of the beverage industry, encompassing craft beers and ready-to-drink beverages, fuels the demand for efficient packaging solutions such as beer cans. |
| Restraints | • The preference for wine among customers may present a challenge to the beer can industry. • Challenges in sourcing sustainable packaging materials and meeting environmental regulations. |
Frequently Asked Questions
Ans: The Asia-pacific region held the largest market share and will continue to dominate the market.
Ans: The preference for wine among customers may present a challenge to the beer can industry.
Ans: A key driver is increasing worldwide beer consumption fuels the need for beer cans, which are indispensable packaging solutions for this widely consumed beverage.
Ans: The Beer Cans Market size was USD 12.75 billion in 2023 and is expected to Reach USD 17.58 billion by 2031.
Ans: The Beer Cans Market is expected to grow at a CAGR of 4.1 %.
Get in Touch
