Biological Data Visualization Market Report Scope & Overview:
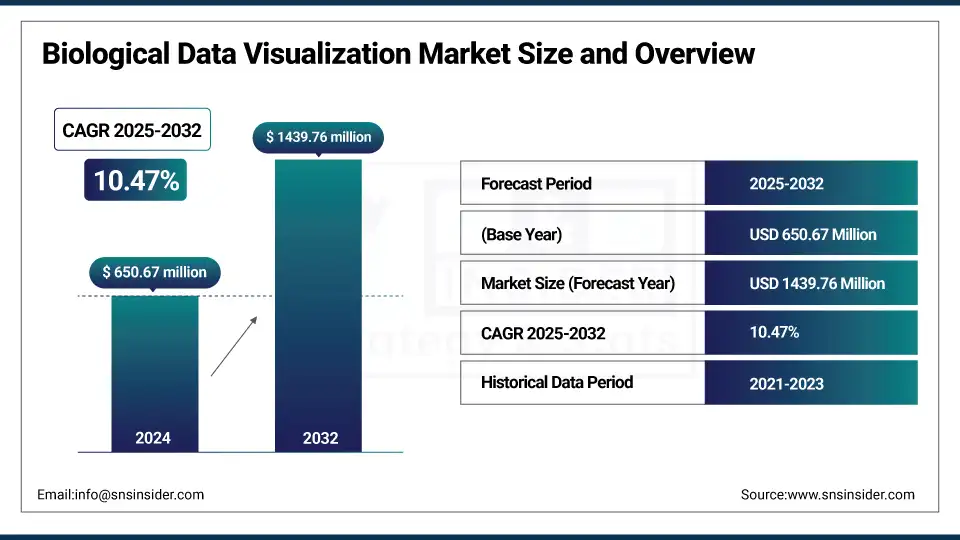
The biological data visualization market size was valued at USD 650.67 million in 2024 and is expected to reach USD 1439.76 million by 2032, growing at a CAGR of 10.47% over the forecast period of 2025-2032.
The global biological data visualization market is growing rapidly due to the trend that has stimulated the demand for biological data visualization is a reflection of tremendous growth characterized by expanding omics data generation and the requirement for high-throughput technologies, thus fuelling the need for intuitive tools for biological data. The increasing use of AI-enabled platforms and cloud-based visualisation solutions is additionally propelling the market growth. The major end-users of this technology are academic research institutions, biotech firms, and pharmaceutical companies. The growing momentum of precision medicine and data-driven biology is expected to drive the demand for visualization tools through 2032.
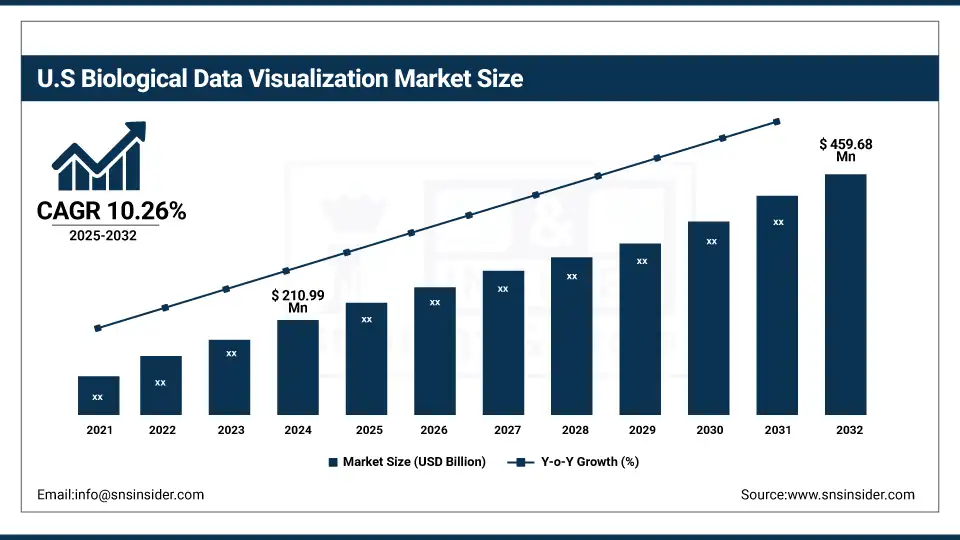
The U.S. biological data visualization market size was valued at USD 210.99 million in 2024 and is expected to reach USD 459.68 million by 2032, growing at a CAGR of 10.26% over the forecast period of 2025-2032.
The U.S. holds the major share in the biological data visualization market analysis in North America due to the supportive environment of technology and resources in biomedical research and increasing investments in bioinformatics. The rich biotech, pharmaceutical, and data analytics ecosystem keeps innovation flowing, and the continued development of visualization tools to handle complex biological data continues to fill that need.
Market Dynamics:
Drivers
-
Increasing Amounts of Biological and Genomic Data Are Boosting the Market Growth
Due to the development of technology, such as next-generation sequencing (NGS), single-cell RNA sequencing, and proteomics, researchers are producing vast volumes of biological data. With this explosion of highly complex and multidimensional datasets, powerful visualization tools are needed to render that data interpretable and actionable. With such large datasets, traditional spreadsheets and normal static charts fail to find the patterns, relationships, or anomalies. Consequently, the demand for biological data visualization tools has increased significantly, enabling effective comprehension of biological processes and spurring research conclusions for scientists, clinicians, and data analysts.
As reported by ScienceDirect, the urgent need to enhance integration of multi-omics data indicates the thousands-of-fold increase in biological datasets that require systems that harmonize analysis workflows among genomics, proteomics, metabolomics, etc.
As noted by The Wellcome Sanger Institute, each human genome is made up of ~3 billion base pairs, and hundreds of thousands of genomes are now being studied in large-scale studies, showcasing the vast amount of genomic data to be rendered through modern visualization platforms.
-
Integration of AI and Machine Learning is Driving the Market Growth
Artificial Intelligence (AI) and Machine Learning (ML) are taking place of many traditional biological data analysis techniques, which analyze extensive datasets more precisely and effectively. AI/ML algorithms scan biological data to identify trends, clusters, and outliers that would be missed, and these algorithms require visualization tools to be effective. This integration enables visualization that is not only dynamic but also predictive, encouraging insights into gene expression, protein interactions, and disease mechanisms. As a result, the rising significance of AI-driven visualization platforms for research and clinical applications is stimulating the market.
BiaPy: An open-source AI platform for non-specialist users, allowing deep‑learning analysis of biomedical images (Nature Methods, 2025) — a considerable step forward in providing easier access to AI-powered visualization tools for non-expert users.
Through modeling genomic DNA, Evo 2 becomes the first AI to predict genomic mutations and visualize the resulting DNA and protein changes (discusses their current research with integrated data to model widespread biological systems). Extreme modeling of biological context modeling.
Restraint
-
Market Growth is Constrained due to the High Complexity of Biological Data Interpretation
Biological data (especially genomics, proteomics, transcriptomics, and metabolomics data) are featured with large dimensions and non-linear, and large sample sizes, thus being inherently complex. A single human genome includes more than 3 billion base pairs, and there is additional complexity when profiling gene expression across time points or tissue types. And we need tools that can visualize such datasets in a meaningful way, keeping in mind multi-variable relationships, spatial-temporal patterns, and hierarchical structures.
In addition, understanding the graphic result from such techniques requires highly specialized knowledge of biology and data science. Particularly smaller academic labs or institutions without a bioinformatics focus might not have sufficient expertise to create the reliable visualizations necessary for interpreting their data. This can create a steep learning curve and require specialized training, which can hinder adoption and reduce accessibility, especially in the presence of limited resources due to computational or human limitations.
Segmentation Analysis:
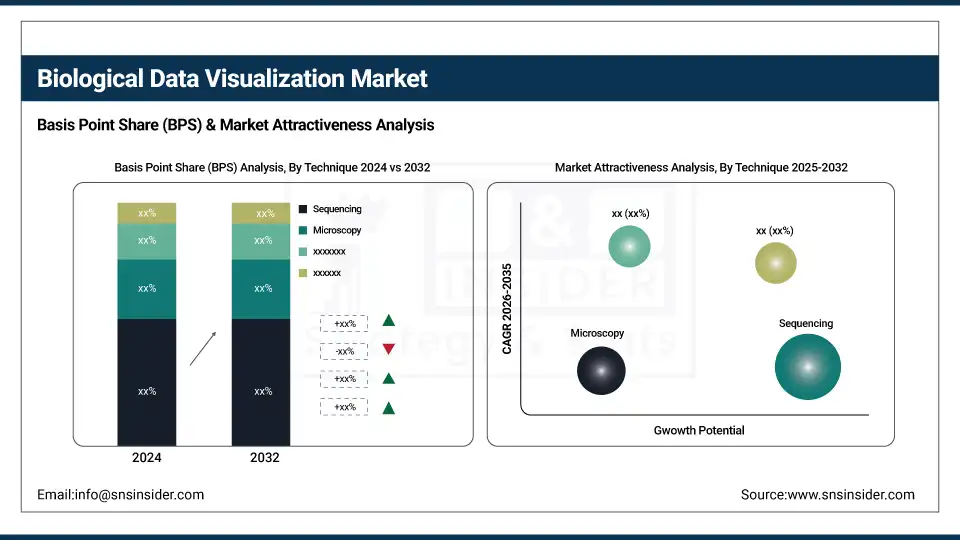
By Technique
The Sequencing segment dominated the biological data visualization market share, with around 40.4% in 2024, driven primarily by the increase in genomics and multi-omics research, especially in personalized medicine, cancer genomics, and infectious disease surveillance. Although high-throughput sequencing technologies are producing huge amounts of complex data, advanced visualization tools are required to visualize genomic variations, gene expression, and molecular interaction data. Demand for intuitive, scalable visualization platforms offerings for sequencing data will continue to increase as next-generation sequencing (NGS) technologies advance rapidly.
The magnetic resonance imaging (MRI) segment is projected to grow at the fastest CAGR throughout the forecast period, owing to its wide application in structural biology and clinical diagnostics. MRI is a non-invasive, high-resolution, time- and space-scale imaging technique that provides anatomical and functional data in real-time [1]. When combined with high-end visualization platforms, it facilitates detailed analysis of complex tissue structures, tissue structure over time, and informs treatment planning for both researchers and clinicians. The repeated use of MRI in both research and clinical settings has solidified its top market position.
By Platform
The biological data visualization market was dominated by the Windows segment in 2024, with a 68.5% market share 2024 due to its increasing global adoption, compatibility, and user-friendly interface. Many of the visualization tools and bioinformatics software are built, or at least designed, specifically for Windows; as such, it is the OS of choice for researchers, academic institutions, and healthcare professionals alike. In addition, Windows is more cost-effective and accessible than other systems, especially those that work with little to no IT infrastructure, thus strengthening the platform’s market position.
The Mac OS segment is projected to be the fastest-growing from 2025 to 2032, as a result of the higher adoption rate among high-end research institutions, biotech companies, and academic users. The Mac OS provides a stable and secure platform that has become popular with users addressing data-intensive biological research. It also improves visualization in case of complex biological datasets due to its enhanced graphics capabilities. Mac OS has been around for a while, but it is starting to gain traction among professionals looking for hardware performance integrated with high-performance computing and visualization applications as the industry demand for both capability and intuitiveness increases.
By Application
The biological data visualization market by Application was dominated by cell and organism imaging in 2024, with around 42.15%, due to its extensive application in life sciences research, drug discovery, and clinical diagnostics. High-resolution imaging strategies, including confocal microscopy and fluorescence imaging, constitute critical techniques for the study of cellular dynamics, tissue organization, and disease development. Such applications yield heterogeneous image-centric biological data, which requires sophisticated visualization approaches for interpretation, thus providing a robust impetus to this segment.
The genomic analysis segment is anticipated to register the fastest growth during the forecast period. Rapid advancements in next-generation sequencing (NGS), personalized medicine, and molecular diagnostics, which generate large, complex datasets, drive this growth. There is an increasing importance of visualization tools for genomic data to interpret the patterns, mutations, and gene expressions. With genomics becoming an essential part of disease understanding and treatment customisation, the demand for proper data visualisation in this area will only increase in the coming times.
By End Use
The academic research segment held the largest share of the biological data visualization market in 2024, with a 60.18% market share, owing to widespread fundamental biological research conducted at various universities and research institutions worldwide. With genomics, proteomics, and imaging studies generating complex datasets, these organizations often need advanced visualization tools to make sense of the data. The emphasis on exploratory research, biological discovery, and education leads to ongoing investments in these technologies in academia, where they tend to be the most established players.
The fastest-growing type of application segment is the pharmaceutical & biotechnology company segment during the forecast period. This is accelerating as more and more drug discovery, clinical trials, and precision medicine are being performed in a data-driven manner. With these companies increasingly embracing high-throughput technologies and omics datasets, the demand for an easy-to-use integrated visualization solution to facilitate decision-making and speed up innovation is on the rise. This is propelling the demand for biological data visualization tools, owing to the industry efforts that are rendering faster and more efficient R&D pipelines.
Regional Analysis:
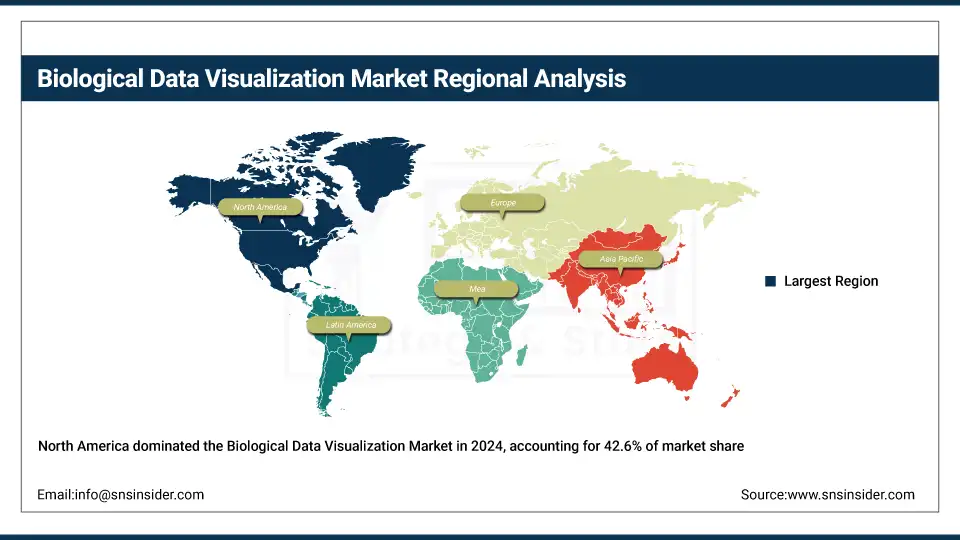
North America dominated the biological data visualization market trend with a 42.6% market share in 2024, owing to a strong biomedical research infrastructure, an early adoption of new technologies, and the presence of a large number of leading biotech and pharma companies in this region. The U.S. has a favorable environment because of high public and private investment in genomics, personalized medicine, and bioinformatics, further strengthening the region. Moreover, partnerships between academia and industry, coupled with a high density of software developers and AI innovators, are making advanced biological data visualization tools in research and clinical applications ubiquitous within the United States.
Asia Pacific is expected to grow at the highest CAGR due to growing government initiatives in life sciences, increasing investments in genomic research, and rapid digital transformation in healthcare. Nations such as China, India, Japan, South Korea, and others are growing their biotechnology domains and contributing to the foundation of such omics technologies. The regional market is further driven by increasing recognition of precision medicine, expansion of academic research output, and better accessibility to high-performance computing resources, which are hastening the adoption of biological data visualization platforms in the region.
Europe is witnessing a huge growth in the biological data visualization market analysis due to massive investment programs in life sciences research as well as technological innovation. Some of the countries that are leading in this field are Germany, France, and the UK, with new demand for genomics, proteomics, and bioinformatics. In line with the increasing emphasis on personalized medicine in the region, integration of multi-omics data, and academic and biotech companies' cooperative research activities, the adoption of advanced visualization solutions for research and clinical settings is also rising.
The biological data visualization market in Latin America is witnessing steady growth owing to the fact that there has been increasing adoption of visualization tools, besides genomic sequencing and academic research. With growing research infrastructure and increased demand for high-throughput sequencing analysis platforms, Brazil is leading regional growth.
The biological data visualization growth of the MEA region is moderate, with a significant compound annual growth rate, moving in line with the early state of investment in life sciences and tools for biological data. Thus, despite the continued dominance of sequencing as a driver, compelling new interest in imaging-based visualization that involves magnetic resonance imaging (MRI) is now apparent. The UAE is among the few countries driving growth, with gradual enhancement of research infrastructure and growing public sector investment expanding the potential for biological data visualization platforms in clinical and academic segments.
Key Players:
The biological data visualization market companies are Thermo Fisher Scientific, Agilent Technologies, Illumina, QIAGEN, PerkinElmer, Bruker, Bio-Rad Laboratories, GE Healthcare, ZEISS, Danaher, Waters Corporation, 10x Genomics, Oxford Nanopore Technologies, Pacific Biosciences, Genedata, Sartorius, Affymetrix, DNASTAR, Agios Pharmaceuticals, Schrödinger, and other players.
Recent Developments:
-
In July 2025, Thermo Fisher Scientific published a new article entitled "Tomo Software: Integrated Multigrid Data Visualization and Curation", published in Microscopy and Microanalysis, Volume 31, Supplement 1.
-
February 2025 – Illumina, Inc. unveiled a set of roadmap innovations, presenting the broadest offering of omics solutions and sequencing applications available in the market. These developments cover an immense array of technologies, such as genomics, spatial transcriptomics, single-cell analysis, CRISPR, epigenetics, and sophisticated data analytics software.
-
December 2024 – QIAGEN published the introduction of Ingenuity Pathway Analysis (IPA) Interpret, a new AI-driven feature to simplify and speed up the interpretation of intricate biological data. IPA Interpret applies artificial intelligence to convert complex differential expression analyses into simple, actionable results.
Report Attributes Details Market Size in 2024 USD 650.67 Million Market Size by 2032 USD 1439.76 Million CAGR CAGR of 10.47% From 2025 to 2032 Base Year 2024 Forecast Period 2025-2032 Historical Data 2021-2023 Report Scope & Coverage Market Size, Segments Analysis, Competitive Landscape, Regional Analysis, DROC & SWOT Analysis, Forecast Outlook Key Segments • By Technique (Microscopy, Magnetic Resonance Imaging, Sequencing, X-ray Crystallography, Others)
• By Platform (Windows, Mac OS, Linux, Others)
• By Application (Cell and Organism Imaging, Structural Biology and Molecular Modeling, Genomic Analysis, Alignment, Phylogeny, and Evolution, System Biology)
• By End Use (Pharmaceutical & Biotechnology Companies, Academic Research, Hospitals & Clinics, Others)Regional Analysis/Coverage North America (US, Canada, Mexico), Europe (Germany, France, UK, Italy, Spain, Poland, Turkey, Rest of Europe), Asia Pacific (China, India, Japan, South Korea, Singapore, Australia, Rest of Asia Pacific), Middle East & Africa (UAE, Saudi Arabia, Qatar, South Africa, Rest of Middle East & Africa), Latin America (Brazil, Argentina, Rest of Latin America) Company Profiles Thermo Fisher Scientific, Agilent Technologies, Illumina, QIAGEN, PerkinElmer, Bruker, Bio-Rad Laboratories, GE Healthcare, ZEISS, Danaher, Waters Corporation, 10x Genomics, Oxford Nanopore Technologies, Pacific Biosciences, Genedata, Sartorius, Affymetrix, DNASTAR, Agios Pharmaceuticals, Schrödinger, and other players.
Table Of Contents
1. Introduction
1.1 Market Definition & Scope
1.2 Research Assumptions & Abbreviations
1.3 Research Methodology
2. Executive Summary
2.1 Market Snapshot
2.2 Market Absolute $ Opportunity Assessment & Y-o-Y Analysis, 2021–2032
2.3 Market Size & Forecast, By Segmentation, 2021–2032
2.3.1 Market Size By Technique
2.3.2 Market Size By Platform
2.3.2 Market Size By Application
2.3.2 Market Size By End Use
2.4 Market Share & Bps Analysis By Region, 2024
2.5 Industry Growth Scenarios – Conservative, Likely & Optimistic
2.6 Industry CxO’s Perspective
3. Market Overview
3.1 Market Dynamics
3.1.1 Drivers
3.1.2 Restraints
3.1.3 Opportunities
3.1.4 Key Market Trends
3.2 Industry PESTLE Analysis
3.3 Key Industry Forces (Porter’s) Impacting Market Growth
3.4 Industry Life Cycle Assessment
3.5 Parent Market Overview
3.6 Market Risk Assessment
4. Statistical Insights & Trends Reporting
4.1 Volume of Biological Data Generated (2020–2024)
4.1.1 Genomic Data
4.1.2 Proteomic Data
4.1.3 Metabolomic Data
4.1.4 Other Omics Data (Transcriptomic, Epigenomic, etc.)
4.2 Adoption Rate of Biological Data Visualization Tools (2024)
4.2.1 By End User
4.2.1.1 Pharmaceutical & Biotechnology Companies
4.2.1.2 Academic & Research Institutions
4.2.1.3 Contract Research Organizations (CROs)
4.2.1.4 Hospitals & Clinical Settings
4.3 Platform Usage Trends (2024)
4.3.1 Standalone Visualization Platforms
4.3.2 Integrated Bioinformatics Suites
4.3.3 Open-source vs. Commercial Tools
4.4 Deployment Trends (2020–2024)
4.4.1 Cloud-based Platforms
4.4.2 On-premise Installations
4.4.3 Hybrid Deployment Models
4.5 User Base Growth Rate by Region (2020–2024)
4.5.1 North America
4.5.2 Europe
4.5.3 Asia Pacific
4.5.4 Latin America
4.5.5 Middle East & Africa
5. Biological Data Visualization Market Segmental Analysis & Forecast, By Technique, 2021 – 2032, Value (USD Billion)
5.1 Introduction
5.2 Microscopy
5.2.1 Key Trends
5.2.2 Market Size & Forecast, 2021 – 2032
5.3 Magnetic Resonance Imaging
5.3.1 Key Trends
5.3.2 Market Size & Forecast, 2021 – 2032
5.4 Sequencing
5.4.1 Key Trends
5.4.2 Market Size & Forecast, 2021 – 2032
5.5 X-ray Crystallography
5.5.1 Key Trends
5.5.2 Market Size & Forecast, 2021 – 2032
5.6 Others (Cryo-Electron Microscopy, Computed Tomography, Spectroscopy-based Techniques, etc)
5.6.1 Key Trends
5.6.2 Market Size & Forecast, 2021 – 2032
6. Biological Data Visualization Market Segmental Analysis & Forecast, By Platform, 2021 – 2032, Value (USD Billion)
6.1 Introduction
6.2 Windows
6.2.1 Key Trends
6.2.2 Market Size & Forecast, 2021 – 2032
6.3 Mac OS
6.3.1 Key Trends
6.3.2 Market Size & Forecast, 2021 – 2032
6.4 Linux
6.4.1 Key Trends
6.4.2 Market Size & Forecast, 2021 – 2032
6.5 Others (Android-based and iOS-based Mobile Visualization Apps, Cloud-based Platforms, Cross-platform Software Tools, etc)
6.5.1 Key Trends
6.5.2 Market Size & Forecast, 2021 – 2032
7. Biological Data Visualization Market Segmental Analysis & Forecast, By Application, 2021 – 2032, Value (USD Billion)
7.1 Introduction
7.2 Cell and Organism Imaging
7.2.1 Key Trends
7.2.2 Market Size & Forecast, 2021 – 2032
7.3 Structural Biology and Molecular Modeling
7.3.1 Key Trends
7.3.2 Market Size & Forecast, 2021 – 2032
7.4 Genomic Analysis
7.4.1 Key Trends
7.4.2 Market Size & Forecast, 2021 – 2032
7.5 Alignment, Phylogeny, and Evolution
7.5.1 Key Trends
7.5.2 Market Size & Forecast, 2021 – 2032
7.6 Systems Biology
7.6.1 Key Trends
7.6.2 Market Size & Forecast, 2021 – 2032
7.7 Metabolomics Data Visualization
7.7.1 Key Trends
7.7.2 Market Size & Forecast, 2021 – 2032
7.8 Proteomics Analysis
7.8.1 Key Trends
7.8.2 Market Size & Forecast, 2021 – 2032
7.9 Drug Interaction and Pathway Analysis
7.9.1 Key Trends
7.9.2 Market Size & Forecast, 2021 – 2032
8. Biological Data Visualization Market Segmental Analysis & Forecast, By End Use, 2021 – 2032, Value (USD Billion)
8.1 Introduction
8.2 Pharmaceutical & Biotechnology Companies
8.2.1 Key Trends
8.2.2 Market Size & Forecast, 2021 – 2032
8.3 Academic Research
8.3.1 Key Trends
8.3.2 Market Size & Forecast, 2021 – 2032
8.4 Hospitals & Clinics
8.4.1 Key Trends
8.4.2 Market Size & Forecast, 2021 – 2032
8.5 Contract Research Organizations (CROs)
8.5.1 Key Trends
8.5.2 Market Size & Forecast, 2021 – 2032
8.6 Others (Government Research Institutes, Nonprofit Biomedical Foundations, Diagnostic Laboratories)
8.6.1 Key Trends
8.6.2 Market Size & Forecast, 2021 – 2032
9. Biological Data Visualization Market Segmental Analysis & Forecast By Region, 2021 – 2025, Value (USD Billion)
9.1 Introduction
9.2 North America
9.2.1 Key Trends
9.2.2 Biological Data Visualization Market Size & Forecast, By Technique, 2021 – 2032
9.2.3 Biological Data Visualization Market Size & Forecast, By Platform, 2021 – 2032
9.2.4 Biological Data Visualization Market Size & Forecast, By Application, 2021 – 2032
9.2.5 Biological Data Visualization Market Size & Forecast, By End Use, 2021 – 2032
9.2.6 Biological Data Visualization Market Size & Forecast, By Country, 2021 – 2032
9.2.6.1 USA
9.2.6.1.1 Biological Data Visualization Market Size & Forecast, By Technique, 2021 – 2032
9.2.6.1.2 Biological Data Visualization Market Size & Forecast, By Platform, 2021 – 2032
9.2.6.1.3 Biological Data Visualization Market Size & Forecast, By Application, 2021 – 2032
9.2.6.1.4 Biological Data Visualization Market Size & Forecast, By End Use, 2021 – 2032
9.2.6.2 Canada
9.2.6.2.1 Biological Data Visualization Market Size & Forecast, By Technique, 2021 – 2032
9.2.6.2.2 Biological Data Visualization Market Size & Forecast, By Platform, 2021 – 2032
9.2.6.2.3 Biological Data Visualization Market Size & Forecast, By Application, 2021 – 2032
9.2.6.2.4 Biological Data Visualization Market Size & Forecast, By End Use, 2021 – 2032
9.3 Europe
9.3.1 Key Trends
9.3.2 Biological Data Visualization Market Size & Forecast, By Technique, 2021 – 2032
9.3.3 Biological Data Visualization Market Size & Forecast, By Platform, 2021 – 2032
9.3.4 Biological Data Visualization Market Size & Forecast, By Application, 2021 – 2032
9.3.5 Biological Data Visualization Market Size & Forecast, By End Use, 2021 – 2032
9.3.6 Biological Data Visualization Market Size & Forecast, By Country, 2021 – 2032
9.3.6.1 Germany
9.3.6.1.1 Biological Data Visualization Market Size & Forecast, By Technique, 2021 – 2032
9.3.6.1.2 Biological Data Visualization Market Size & Forecast, By Platform, 2021 – 2032
9.3.6.1.3 Biological Data Visualization Market Size & Forecast, By Application, 2021 – 2032
9.3.6.1.4 Biological Data Visualization Market Size & Forecast, By End Use, 2021 – 2032
9.3.6.2 UK
9.3.6.2.1 Biological Data Visualization Market Size & Forecast, By Technique, 2021 – 2032
9.3.6.2.2 Biological Data Visualization Market Size & Forecast, By Platform, 2021 – 2032
9.3.6.2.3 Biological Data Visualization Market Size & Forecast, By Application, 2021 – 2032
9.3.6.2.4 Biological Data Visualization Market Size & Forecast, By End Use, 2021 – 2032
9.3.6.3 France
9.3.6.3.1 Biological Data Visualization Market Size & Forecast, By Technique, 2021 – 2032
9.3.6.3.2 Biological Data Visualization Market Size & Forecast, By Platform, 2021 – 2032
9.3.6.3.3 Biological Data Visualization Market Size & Forecast, By Application, 2021 – 2032
9.3.6.3.4 Biological Data Visualization Market Size & Forecast, By End Use, 2021 – 2032
9.3.6.4 Italy
9.3.6.4.1 Biological Data Visualization Market Size & Forecast, By Technique, 2021 – 2032
9.3.6.4.2 Biological Data Visualization Market Size & Forecast, By Platform, 2021 – 2032
9.3.6.4.3 Biological Data Visualization Market Size & Forecast, By Application, 2021 – 2032
9.3.6.4.4 Biological Data Visualization Market Size & Forecast, By End Use, 2021 – 2032
9.3.6.5 Spain
9.3.6.5.1 Biological Data Visualization Market Size & Forecast, By Technique, 2021 – 2032
9.3.6.5.2 Biological Data Visualization Market Size & Forecast, By Platform, 2021 – 2032
9.3.6.5.3 Biological Data Visualization Market Size & Forecast, By Application, 2021 – 2032
9.3.6.5.4 Biological Data Visualization Market Size & Forecast, By End Use, 2021 – 2032
9.3.6.6 Russia
9.3.6.6.1 Biological Data Visualization Market Size & Forecast, By Technique, 2021 – 2032
9.3.6.6.2 Biological Data Visualization Market Size & Forecast, By Platform, 2021 – 2032
9.3.6.6.3 Biological Data Visualization Market Size & Forecast, By Application, 2021 – 2032
9.3.6.6.4 Biological Data Visualization Market Size & Forecast, By End Use, 2021 – 2032
9.3.6.7 Poland
9.3.6.7.1 Biological Data Visualization Market Size & Forecast, By Technique, 2021 – 2032
9.3.6.7.2 Biological Data Visualization Market Size & Forecast, By Platform, 2021 – 2032
9.3.6.7.3 Biological Data Visualization Market Size & Forecast, By Application, 2021 – 2032
9.3.6.7.4 Biological Data Visualization Market Size & Forecast, By End Use, 2021 – 2032
9.3.6.8 Rest of Europe
9.3.6.8.1 Biological Data Visualization Market Size & Forecast, By Technique, 2021 – 2032
9.3.6.8.2 Biological Data Visualization Market Size & Forecast, By Platform, 2021 – 2032
9.3.6.8.3 Biological Data Visualization Market Size & Forecast, By Application, 2021 – 2032
9.3.6.8.4 Biological Data Visualization Market Size & Forecast, By End Use, 2021 – 2032
9.4 Asia-Pacific
9.4.1 Key Trends
9.4.2 Biological Data Visualization Market Size & Forecast, By Technique, 2021 – 2032
9.4.3 Biological Data Visualization Market Size & Forecast, By Platform, 2021 – 2032
9.4.4 Biological Data Visualization Market Size & Forecast, By Application, 2021 – 2032
9.4.5 Biological Data Visualization Market Size & Forecast, By End Use, 2021 – 2032
9.4.6 Biological Data Visualization Market Size & Forecast, By Country, 2021 – 2032
9.4.6.1 China
9.4.6.1.1 Biological Data Visualization Market Size & Forecast, By Technique, 2021 – 2032
9.4.6.1.2 Biological Data Visualization Market Size & Forecast, By Platform, 2021 – 2032
9.4.6.1.3 Biological Data Visualization Market Size & Forecast, By Application, 2021 – 2032
9.4.6.1.4 Biological Data Visualization Market Size & Forecast, By End Use, 2021 – 2032
9.4.6.2 India
9.4.6.2.1 Biological Data Visualization Market Size & Forecast, By Technique, 2021 – 2032
9.4.6.2.2 Biological Data Visualization Market Size & Forecast, By Platform, 2021 – 2032
9.4.6.2.3 Biological Data Visualization Market Size & Forecast, By Application, 2021 – 2032
9.4.6.2.4 Biological Data Visualization Market Size & Forecast, By End Use, 2021 – 2032
9.4.6.3 Japan
9.4.6.3.1 Biological Data Visualization Market Size & Forecast, By Technique, 2021 – 2032
9.4.6.3.2 Biological Data Visualization Market Size & Forecast, By Platform, 2021 – 2032
9.4.6.3.3 Biological Data Visualization Market Size & Forecast, By Application, 2021 – 2032
9.4.6.3.4 Biological Data Visualization Market Size & Forecast, By End Use, 2021 – 2032
9.4.6.4 South Korea
9.4.6.4.1 Biological Data Visualization Market Size & Forecast, By Technique, 2021 – 2032
9.4.6.4.2 Biological Data Visualization Market Size & Forecast, By Platform, 2021 – 2032
9.4.6.4.3 Biological Data Visualization Market Size & Forecast, By Application, 2021 – 2032
9.4.6.4.4 Biological Data Visualization Market Size & Forecast, By End Use, 2021 – 2032
9.4.6.5 Australia
9.4.6.5.1 Biological Data Visualization Market Size & Forecast, By Technique, 2021 – 2032
9.4.6.5.2 Biological Data Visualization Market Size & Forecast, By Platform, 2021 – 2032
9.4.6.5.3 Biological Data Visualization Market Size & Forecast, By Application, 2021 – 2032
9.4.6.5.4 Biological Data Visualization Market Size & Forecast, By End Use, 2021 – 2032
9.4.6.6 ASEAN Countries
9.4.6.6.1 Biological Data Visualization Market Size & Forecast, By Technique, 2021 – 2032
9.4.6.6.2 Biological Data Visualization Market Size & Forecast, By Platform, 2021 – 2032
9.4.6.6.3 Biological Data Visualization Market Size & Forecast, By Application, 2021 – 2032
9.4.6.6.4 Biological Data Visualization Market Size & Forecast, By End Use, 2021 – 2032
9.4.6.7 Rest of Asia-Pacific
9.4.6.7.1 Biological Data Visualization Market Size & Forecast, By Technique, 2021 – 2032
9.4.6.7.2 Biological Data Visualization Market Size & Forecast, By Platform, 2021 – 2032
9.4.6.7.3 Biological Data Visualization Market Size & Forecast, By Application, 2021 – 2032
9.4.6.7.4 Biological Data Visualization Market Size & Forecast, By End Use, 2021 – 2032
9.5 Latin America
9.5.1 Key Trends
9.5.2 Biological Data Visualization Market Size & Forecast, By Technique, 2021 – 2032
9.5.3 Biological Data Visualization Market Size & Forecast, By Platform, 2021 – 2032
9.5.4 Biological Data Visualization Market Size & Forecast, By Application, 2021 – 2032
9.5.5 Biological Data Visualization Market Size & Forecast, By End Use, 2021 – 2032
9.5.6 Biological Data Visualization Market Size & Forecast, By Country, 2021 – 2032
9.5.6.1 Brazil
9.5.6.1.1 Biological Data Visualization Market Size & Forecast, By Technique, 2021 – 2032
9.5.6.1.2 Biological Data Visualization Market Size & Forecast, By Platform, 2021 – 2032
9.5.6.1.3 Biological Data Visualization Market Size & Forecast, By Application, 2021 – 2032
9.5.6.1.4 Biological Data Visualization Market Size & Forecast, By End Use, 2021 – 2032
9.5.6.2 Argentina
9.5.6.2.1 Biological Data Visualization Market Size & Forecast, By Technique, 2021 – 2032
9.5.6.2.2 Biological Data Visualization Market Size & Forecast, By Platform, 2021 – 2032
9.5.6.2.3 Biological Data Visualization Market Size & Forecast, By Application, 2021 – 2032
9.5.6.2.4 Biological Data Visualization Market Size & Forecast, By End Use, 2021 – 2032
9.5.6.3 Mexico
9.5.6.3.1 Biological Data Visualization Market Size & Forecast, By Technique, 2021 – 2032
9.5.6.3.2 Biological Data Visualization Market Size & Forecast, By Platform, 2021 – 2032
9.5.6.3.3 Biological Data Visualization Market Size & Forecast, By Application, 2021 – 2032
9.5.6.3.4 Biological Data Visualization Market Size & Forecast, By End Use, 2021 – 2032
9.5.6.4 Colombia
9.5.6.4.1 Biological Data Visualization Market Size & Forecast, By Technique, 2021 – 2032
9.5.6.4.2 Biological Data Visualization Market Size & Forecast, By Platform, 2021 – 2032
9.5.6.4.3 Biological Data Visualization Market Size & Forecast, By Application, 2021 – 2032
9.5.6.4.4 Biological Data Visualization Market Size & Forecast, By End Use, 2021 – 2032
9.5.6.5 Rest of Latin America
9.5.6.5.1 Biological Data Visualization Market Size & Forecast, By Technique, 2021 – 2032
9.5.6.5.2 Biological Data Visualization Market Size & Forecast, By Platform, 2021 – 2032
9.5.6.5.3 Biological Data Visualization Market Size & Forecast, By Application, 2021 – 2032
9.5.6.5.4 Biological Data Visualization Market Size & Forecast, By End Use, 2021 – 2032
9.6 Middle East & Africa
9.6.1 Key Trends
9.6.2 Biological Data Visualization Market Size & Forecast, By Technique, 2021 – 2032
9.6.3 Biological Data Visualization Market Size & Forecast, By Platform, 2021 – 2032
9.6.4 Biological Data Visualization Market Size & Forecast, By Application, 2021 – 2032
9.6.5 Biological Data Visualization Market Size & Forecast, By End Use, 2021 – 2032
9.6.6 Biological Data Visualization Market Size & Forecast, By Country, 2021 – 2032
9.6.6.1 UAE
9.6.6.1.1 Biological Data Visualization Market Size & Forecast, By Technique, 2021 – 2032
9.6.6.1.2 Biological Data Visualization Market Size & Forecast, By Platform, 2021 – 2032
9.6.6.1.3 Biological Data Visualization Market Size & Forecast, By Application, 2021 – 2032
9.6.6.1.4 Biological Data Visualization Market Size & Forecast, By End Use, 2021 – 2032
9.6.6.2 Saudi Arabia
9.6.6.2.1 Biological Data Visualization Market Size & Forecast, By Technique, 2021 – 2032
9.6.6.2.2 Biological Data Visualization Market Size & Forecast, By Platform, 2021 – 2032
9.6.6.2.3 Biological Data Visualization Market Size & Forecast, By Application, 2021 – 2032
9.6.6.2.4 Biological Data Visualization Market Size & Forecast, By End Use, 2021 – 2032
9.6.6.3 Qatar
9.6.6.3.1 Biological Data Visualization Market Size & Forecast, By Technique, 2021 – 2032
9.6.6.3.2 Biological Data Visualization Market Size & Forecast, By Platform, 2021 – 2032
9.6.6.3.3 Biological Data Visualization Market Size & Forecast, By Application, 2021 – 2032
9.6.6.3.4 Biological Data Visualization Market Size & Forecast, By End Use, 2021 – 2032
9.6.6.4 Egypt
9.6.6.4.1 Biological Data Visualization Market Size & Forecast, By Technique, 2021 – 2032
9.6.6.4.2 Biological Data Visualization Market Size & Forecast, By Platform, 2021 – 2032
9.6.6.4.3 Biological Data Visualization Market Size & Forecast, By Application, 2021 – 2032
9.6.6.4.4 Biological Data Visualization Market Size & Forecast, By End Use, 2021 – 2032
9.6.6.5 South Africa
9.6.6.5.1 Biological Data Visualization Market Size & Forecast, By Technique, 2021 – 2032
9.6.6.5.2 Biological Data Visualization Market Size & Forecast, By Platform, 2021 – 2032
9.6.6.5.3 Biological Data Visualization Market Size & Forecast, By Application, 2021 – 2032
9.6.6.5.4 Biological Data Visualization Market Size & Forecast, By End Use, 2021 – 2032
9.6.6.6 Rest of Middle East & Africa
9.6.6.6.1 Biological Data Visualization Market Size & Forecast, By Technique, 2021 – 2032
9.6.6.6.2 Biological Data Visualization Market Size & Forecast, By Platform, 2021 – 2032
9.6.6.6.3 Biological Data Visualization Market Size & Forecast, By Application, 2021 – 2032
9.6.6.6.4 Biological Data Visualization Market Size & Forecast, By End Use, 2021 – 2032
10. Competitive Landscape
10.1 Key Players' Positioning
10.2 Competitive Developments
10.2.1 Key Strategies Adopted (%), By Key Players, 2024
10.2.2 Year-Wise Strategies & Development, 2021 – 2025
10.2.3 Number Of Strategies Adopted By Key Players, 2024
10.3 Market Share Analysis, 2024
10.4 Product/Service & Application Benchmarking
10.4.1 Product/Service Specifications & Features By Key Players
10.4.2 Product/Service Heatmap By Key Players
10.4.3 Application Heatmap By Key Players
10.5 Industry Start-Up & Innovation Landscape
10.6 Key Company Profiles
10.6.1 Thermo Fisher Scientific
10.6.1.1 Company Overview & Snapshot
10.6.1.2 Product/Service Portfolio
10.6.1.3 Key Company Financials
10.6.1.4 SWOT Analysis
10.6.2 Agilent Technologies
10.6.2.1 Company Overview & Snapshot
10.6.2.2 Product/Service Portfolio
10.6.2.3 Key Company Financials
10.6.2.4 SWOT Analysis
10.6.3 Illumina
10.6.3.1 Company Overview & Snapshot
10.6.3.2 Product/Service Portfolio
10.6.3.3 Key Company Financials
10.6.3.4 SWOT Analysis
10.6.4 QIAGEN
10.6.4.1 Company Overview & Snapshot
10.6.4.2 Product/Service Portfolio
10.6.4.3 Key Company Financials
10.6.4.4 SWOT Analysis
10.6.5 PerkinElmer
10.6.5.1 Company Overview & Snapshot
10.6.5.2 Product/Service Portfolio
10.6.5.3 Key Company Financials
10.6.5.4 SWOT Analysis
10.6.6 Bruker
10.6.6.1 Company Overview & Snapshot
10.6.6.2 Product/Service Portfolio
10.6.6.3 Key Company Financials
10.6.6.4 SWOT Analysis
10.6.7 Bio-Rad Laboratories
10.6.7.1 Company Overview & Snapshot
10.6.7.2 Product/Service Portfolio
10.6.7.3 Key Company Financials
10.6.7.4 SWOT Analysis
10.6.8 GE Healthcare
10.6.8.1 Company Overview & Snapshot
10.6.8.2 Product/Service Portfolio
10.6.8.3 Key Company Financials
10.6.8.4 SWOT Analysis
10.6.9 ZEISS
10.6.9.1 Company Overview & Snapshot
10.6.9.2 Product/Service Portfolio
10.6.9.3 Key Company Financials
10.6.9.4 SWOT Analysis
10.6.10 Danaher Corporation
10.6.10.1 Company Overview & Snapshot
10.6.10.2 Product/Service Portfolio
10.6.10.3 Key Company Financials
10.6.10.4 SWOT Analysis
10.6.11 Waters Corporation
10.6.11.1 Company Overview & Snapshot
10.6.11.2 Product/Service Portfolio
10.6.11.3 Key Company Financials
10.6.11.4 SWOT Analysis
10.6.12 10x Genomics
10.6.12.1 Company Overview & Snapshot
10.6.12.2 Product/Service Portfolio
10.6.12.3 Key Company Financials
10.6.12.4 SWOT Analysis
10.6.13 Oxford Nanopore Technologies
10.6.13.1 Company Overview & Snapshot
10.6.13.2 Product/Service Portfolio
10.6.13.3 Key Company Financials
10.6.13.4 SWOT Analysis
10.6.14 Pacific Biosciences
10.6.14.1 Company Overview & Snapshot
10.6.14.2 Product/Service Portfolio
10.6.14.3 Key Company Financials
10.6.14.4 SWOT Analysis
10.6.15 Genedata
10.6.15.1 Company Overview & Snapshot
10.6.15.2 Product/Service Portfolio
10.6.15.3 Key Company Financials
10.6.15.4 SWOT Analysis
10.6.16 Sartorius
10.6.16.1 Company Overview & Snapshot
10.6.16.2 Product/Service Portfolio
10.6.16.3 Key Company Financials
10.6.16.4 SWOT Analysis
10.6.17 Affymetrix (Part of Thermo Fisher)
10.6.17.1 Company Overview & Snapshot
10.6.17.2 Product/Service Portfolio
10.6.17.3 Key Company Financials
10.6.17.4 SWOT Analysis
10.6.18 DNASTAR
10.6.18.1 Company Overview & Snapshot
10.6.18.2 Product/Service Portfolio
10.6.18.3 Key Company Financials
10.6.18.4 SWOT Analysis
10.6.19 Agios Pharmaceuticals
10.6.19.1 Company Overview & Snapshot
10.6.19.2 Product/Service Portfolio
10.6.19.3 Key Company Financials
10.6.19.4 SWOT Analysis
10.6.20 Schrödinger
10.6.20.1 Company Overview & Snapshot
10.6.20.2 Product/Service Portfolio
10.6.20.3 Key Company Financials
10.6.20.4 SWOT Analysis
11. Analyst Recommendations
11.1 SNS Insider Opportunity Map
11.2 Industry Low-Hanging Fruit Assessment
11.3 Market Entry & Growth Strategy
11.4 Analyst Viewpoint & Suggestions On Market Growth
12. Assumptions
13. Disclaimer
14. Appendix
14.1 List Of Tables
14.2 List Of Figures
Key Segments:
By Technique
-
- Microscopy
- Magnetic Resonance Imaging
- Sequencing
- X-ray Crystallography
- Others (Cryo-Electron Microscopy, Computed Tomography, Spectroscopy-based Techniques, etc)
By Platform
-
- Windows
- Mac OS
- Linux
- Others (Android-based and iOS-based Mobile Visualization Apps, Cloud-based Platforms, Cross-platform Software Tools, etc)
By Application
-
- Cell and Organism Imaging
- Structural Biology and Molecular Modeling
- Genomic Analysis
- Alignment, Phylogeny, and Evolution
- Systems Biology
- Metabolomics Data Visualization
- Proteomics Analysis
- Drug Interaction and Pathway Analysis
By End Use
-
- Pharmaceutical & Biotechnology Companies
- Academic Research
- Hospitals & Clinics
- Contract Research Organizations (CROs)
- Others (Government Research Institutes, Nonprofit Biomedical Foundations, Diagnostic Laboratories)
Request for Segment Customization as per your Business Requirement: Segment Customization Request
Regional Coverage:
North America
- US
- Canada
Europe
- Germany
- France
- UK
- Italy
- Spain
- Russia
- Poland
- Rest of Europe
Asia Pacific
- China
- India
- Japan
- South Korea
- Australia
- ASEAN Countries
- Rest of Asia Pacific
Middle East & Africa
- UAE
- Saudi Arabia
- Qatar
- Egypt
- South Africa
- Rest of Middle East & Africa
Latin America
- Brazil
- Argentina
- Mexico
- Colombia
- Rest of Latin America
Request for Country Level Research Report: Country Level Customization Request
Available Customization
With the given market data, SNS Insider offers customization as per the company’s specific needs. The following customization options are available for the report:
- Detailed Volume Analysis
- Criss-Cross segment analysis (e.g., Product X Application)
- Competitive Product Benchmarking
- Geographic Analysis
- Additional countries in any of the regions
- Customized Data Representation
- Detailed analysis and profiling of additional market players
An accurate research report requires proper strategizing as well as implementation. There are multiple factors involved in the completion of good and accurate research report and selecting the best methodology to compete the research is the toughest part. Since the research reports we provide play a crucial role in any company’s decision-making process, therefore we at SNS Insider always believe that we should choose the best method which gives us results closer to reality. This allows us to reach at a stage wherein we can provide our clients best and accurate investment to output ratio.
Each report that we prepare takes a timeframe of 350-400 business hours for production. Starting from the selection of titles through a couple of in-depth brain storming session to the final QC process before uploading our titles on our website we dedicate around 350 working hours. The titles are selected based on their current market cap and the foreseen CAGR and growth.
The 5 steps process:
Step 1: Secondary Research:
Secondary Research or Desk Research is as the name suggests is a research process wherein, we collect data through the readily available information. In this process we use various paid and unpaid databases which our team has access to and gather data through the same. This includes examining of listed companies’ annual reports, Journals, SEC filling etc. Apart from this our team has access to various associations across the globe across different industries. Lastly, we have exchange relationships with various university as well as individual libraries.

Step 2: Primary Research
When we talk about primary research, it is a type of study in which the researchers collect relevant data samples directly, rather than relying on previously collected data. This type of research is focused on gaining content specific facts that can be sued to solve specific problems. Since the collected data is fresh and first hand therefore it makes the study more accurate and genuine.
We at SNS Insider have divided Primary Research into 2 parts.
Part 1 wherein we interview the KOLs of major players as well as the upcoming ones across various geographic regions. This allows us to have their view over the market scenario and acts as an important tool to come closer to the accurate market numbers. As many as 45 paid and unpaid primary interviews are taken from both the demand and supply side of the industry to make sure we land at an accurate judgement and analysis of the market.
This step involves the triangulation of data wherein our team analyses the interview transcripts, online survey responses and observation of on filed participants. The below mentioned chart should give a better understanding of the part 1 of the primary interview.

Part 2: In this part of primary research the data collected via secondary research and the part 1 of the primary research is validated with the interviews from individual consultants and subject matter experts.
Consultants are those set of people who have at least 12 years of experience and expertise within the industry whereas Subject Matter Experts are those with at least 15 years of experience behind their back within the same space. The data with the help of two main processes i.e., FGDs (Focused Group Discussions) and IDs (Individual Discussions). This gives us a 3rd party nonbiased primary view of the market scenario making it a more dependable one while collation of the data pointers.
Step 3: Data Bank Validation
Once all the information is collected via primary and secondary sources, we run that information for data validation. At our intelligence centre our research heads track a lot of information related to the market which includes the quarterly reports, the daily stock prices, and other relevant information. Our data bank server gets updated every fortnight and that is how the information which we collected using our primary and secondary information is revalidated in real time.

Step 4: QA/QC Process
After all the data collection and validation our team does a final level of quality check and quality assurance to get rid of any unwanted or undesired mistakes. This might include but not limited to getting rid of the any typos, duplication of numbers or missing of any important information. The people involved in this process include technical content writers, research heads and graphics people. Once this process is completed the title gets uploader on our platform for our clients to read it.
Step 5: Final QC/QA Process:
This is the last process and comes when the client has ordered the study. In this process a final QA/QC is done before the study is emailed to the client. Since we believe in giving our clients a good experience of our research studies, therefore, to make sure that we do not lack at our end in any way humanly possible we do a final round of quality check and then dispatch the study to the client.