Intravenous Immunoglobulin Market Size Analysis:
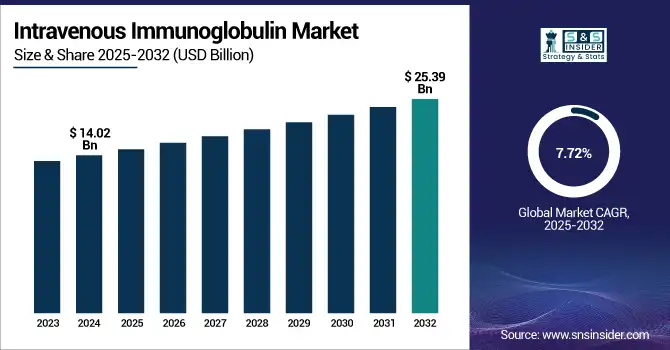
The Intravenous Immunoglobulin Market size was valued at USD 14.02 billion in 2024 and is expected to reach USD 25.39 billion by 2032, growing at a CAGR of 7.72% over the forecast period of 2025-2032.
With the rising prevalence of autoimmune diseases, an aging global population, and developments in plasma-derived products, intravenous immunoglobulin (IVIG) therapy remains a pillar in the treatment of a wide spectrum of immune-mediated and neurological conditions.
To Get more information on Intravenous Immunoglobulin Market - Request Free Sample Report
IVIG is licensed for primary immunodeficiency, chronic inflammatory demyelinating polyneuropathy (CIDP), Kawasaki disease, and other severe disorders, according latest statistics from the U.S. Food and Drug Administration (FDA) and the Centers for Disease Control and Prevention (CDC). IVIG administration routes now include intravenous, subcutaneous, and intramuscular versions, therefore improving accessibility and safety.
Reflecting strong demand and a predicted 7.62% compound annual growth rate (CAGR), the U.S. intravenous immunoglobulin market size was valued at USD 4.98 billion in 2024 and is anticipated to reach USD 8.95 billion by 2032. Supported by government-backed expansion of plasma collection infrastructure and the launch of new IVIG dosage forms, the worldwide intravenous immunoglobulin market is seeing a robust increase. Public health campaigns and regulatory approvals support these intravenous immunoglobulin market trends, therefore establishing the United States as a leader in IVIG market share and innovation.
The growing need for antibody replacement therapy and the growing immunodeficiency treatment market drive the worldwide intravenous immunoglobulin industry. Patients with primary immunodeficiency, autoimmune diseases, and those with neurological disorders depend on IVIG treatment, derived from pooled human plasma. Emphasizing both safety and effectiveness, regulatory authorities including the U.S. FDA and the European Medicines Agency (EMA), have approved several IVIG medicines for various indications, including CIDP and Kawasaki disease. Strong government support for plasma-derived products and better IVIG administration techniques is highlighted by intravenous immunoglobulin sector data, which also shows continuous research and infrastructure investments to fulfill increasing clinical needs.
Intravenous Immunoglobulin Market Dynamics
Drivers
-
Growing Geriatric Population Dramatically Affects Global Intravenous Immunoglobulin Demand
Demand for intravenous immunoglobulin treatment is mostly driven by the fast expanding worldwide elderly population. People's immune systems naturally decrease with age, which increases their vulnerability to autoimmune diseases and immunodeficiency disorders, most of which call for IVIG treatment. The Population Reference Bureau projects a 47% increase in Americans aged 65 and above from 58 million in 2022 to 82 million by 2050. Furthermore, predicted to increase from 17% to 23% in the same period is the proportion of this age group within the whole population. This population change is not restricted to the United States but rather is seen all around, especially in industrialized areas with sophisticated healthcare systems.
The rising demand for IVIG treatments results directly from the increased frequency of age-related immune dysfunction and chronic diseases among older persons, since these treatments are necessary to control antibody shortages and enhance quality of life in this vulnerable population. The demand for IVIG is likely to be sustained and accelerated across different healthcare environments by the continuous expansion of the older demographic, together with growing healthcare awareness and improved diagnostic capabilities, therefore acting as a vital driver for the continuous expansion of the market.
Restraints
-
Persistent Supply and Demand Imbalance of Human Plasma Constrains IVIG Market Growth and Accessibility
The continuous mismatch between the growing demand for IVIG treatments and the restricted supply of human plasma, the fundamental raw material for IVIG manufacturing, presents a major constraint on the intravenous immunoglobulin industry. A difficult, time-consuming operation, plasma collecting calls for careful regulation to guarantee quality and safety. Driven by a growing patient population and expanding therapeutic indications, the increasing demand for IVIG is beyond the capacity of plasma donation centers all around. This supply-demand mismatch affects patients as well as healthcare providers by causing periodic shortages and variable prices. Particularly in low- and middle-income areas, the rising cost of acquiring plasma keeps raising the general cost of IVIG products and makes them less accessible.
Furthermore, varying among nations are regulatory and reimbursement issues, which complicate market access and restrict the availability of IVIG treatments in some regions. Together with the high cost of manufacturing and distribution, these ongoing supply limitations continue to be a major obstacle to the broad acceptance and fair distribution of IVIG therapies all around.
Intravenous Immunoglobulin Market Segmentation Analysis
By Application
Withheld 20% revenue share in 2024, the immunodeficiency diseases segment dominated the market. The fact that IVIG treatment significantly reduces recurrent infections and enhances outcomes for patients with initial immunodeficiency helps explain this predominance. The drive toward creative, high-purity IVG dosage forms is best shown by the recent approval of Biotest's Yimmugo in June 2024, a new IVG product for substitute therapy in primary immunodeficiencies. According to government figures from the CDC, hundreds of thousands of Americans suffer from primary immunodeficiency; many instances are still unidentified. Federal efforts to increase plasma collecting, such as Grifols' opening of 20 new centers in 2024, thereby guaranteeing a consistent supply for IVIG producers, also boost the U.S. intravenous immunoglobulin market growth.
Over the projected period, the segment on Kawasaki disease is likely to show the fastest expansion. The main cause of acquired heart disease in children is still Kawasaki disease; hence, intravenous immunoglobulin treatment is the usual treatment. Rising incidence rates, especially in Asia-Pacific, and government initiatives to enhance diagnosis and access fuel the fast expansion of this category. Reflecting national investment in local IVIG manufacturers and firms, China's National Medical Products Administration (NMPA) approved a domestic IVG formulation for Kawasaki disease in March 2025.
By Distribution Channel
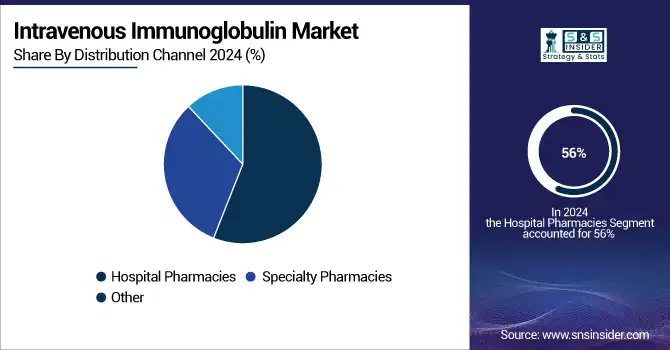
Hospitals held the dominant intravenous immunoglobulin market share of 56% in 2024, due in great part to IVG therapy's intricacy and the need for thorough patient monitoring during administration., Especially for hematological and neurology conditions, data from the U.S. Department of Health and Human Services shows a consistent rise in hospital-based IVIG infusions. To improve patient safety and flexibility, hospitals also remain the early adopters of innovative IVIG products and administration routes, including subcutaneous and intramuscular formulations. According to the intravenous immunoglobulin market analysis, strong patient numbers and thorough reimbursement regulations help to highlight the dominance of the hospital segment even more.
Over the next forecast period, specialty pharmacies are expected to show the fastest increase in the intravenous immunoglobulin market. Their emphasis on patient-centric treatment, flexible schedule, and connection with home infusion programs drives this. The U.S. Centers for Medicare & Medicaid Services (CMS) extended funding for home-based IVIG infusions in 2024, therefore enabling specialist clinics to provide these treatments to be financially viable. For chronic disorders as CIDP and IVIG for autoimmune diseases, where many infusions are needed, this trend is particularly important. Recent events, including Takeda Pharmaceuticals' April 2025 alliance with specialty clinics and Ridgemont Equity Partners' acquisition of American Outcomes Management in February 2024, underline the increasing relevance of specialized clinics in the IVIG industry.
Regional Insights
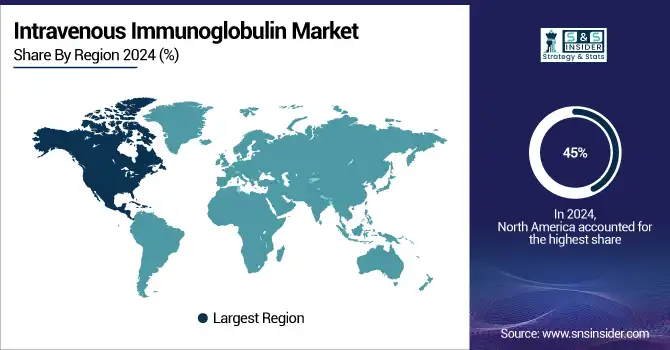
With 45% of the global intravenous immunoglobulin market share North America region dominated in 2024. Strong plasma collecting networks, innovative manufacturing technologies, and thorough reimbursement procedures support this leadership. In 2024, the U.S. intravenous immunoglobulin market size is expected to be USD 4.98 billion; by 2032, it will be USD 8.95 billion. Government projects, including Grifols' expansion of plasma donation centers in 2024, directly address the growing need for IVIG treatment and goods generated from plasma.
Asia-Pacific is expected to have the fastest intravenous immunoglobulin market growth, driven by growing healthcare expenditure, expanding plasma collecting, and rising prevalence of Kawasaki disease and other immune disorders. Reflecting China's commitment to local IVG makers and enhanced access, China's NMPA approved a domestic IVG product for Kawasaki illness in March 2025.
With strong government reimbursement and recent regulatory clearance, including Biotest's Yimmugo in the UK in September 2023, Europe continues to be a major contributor to the worldwide intravenous immunoglobulin industry. While national health authorities encourage early diagnosis and access to IVIG treatment, the European Medicines Agency has expeditious clearance for plasma-derived treatments. Supported by better healthcare infrastructure and growing knowledge of immunodeficiency and autoimmune illnesses, LAMEA areas are seeing a modest increase.
Get Customized Report as per Your Business Requirement - Enquiry Now
Intravenous Immunoglobulin Market Key Players
The key Intravenous Immunoglobulin Companies are CSL, Biotest AG, Kedrion, BDI Pharma Inc., Baxter, Octapharma AG, LFB, China Biologics Products Inc., Shanghai RAAS Blood products, Shire, Grifols SA, and others
Recent Developments in the Intravenous Immunoglobulin Market
-
In January 2024, CSL unveiled a prefilled syringe form of Hizentra, a subcutaneous immunoglobulin meant to treat chronic inflammatory demyelinating polyneuropathy (CIDP) and primary immunodeficiency (PI).
-
Following maintenance dosing, the FDA approved GAMMAGARD LIQUID for treating neuromuscular impairment in adults with CIDP in January 2024. Still lacking research, its use in immunoglobulin-naive patients and for maintenance beyond six months remains unstudied.
| Report Attributes | Details |
|---|---|
| Market Size in 2024 | USD 14.02 Billion |
| Market Size by 2032 | USD 25.39 Billion |
| CAGR | CAGR of 7.72% From 2025 to 2032 |
| Base Year | 2024 |
| Forecast Period | 2025-2032 |
| Historical Data | 2021-2023 |
| Report Scope & Coverage | Market Size, Segments Analysis, Competitive Landscape, Regional Analysis, DROC & SWOT Analysis, Forecast Outlook |
| Key Segments | • By Application (Myasthenia Gravis, CIDP, Immunodeficiency diseases, Congenital AIDS, Chronic Lymphocytic Leukemia, Hypogammaglobulinemia, Multifocal motor neuropathy, Guillain-Barre syndrome, ITP, Kawasaki disease, and Others) • By Distribution Channel (Hospital Pharmacies, Specialty Pharmacies, and Other) |
| Regional Analysis/Coverage | North America (US, Canada, Mexico), Europe (Germany, France, UK, Italy, Spain, Poland, Turkey, Rest of Europe), Asia Pacific (China, India, Japan, South Korea, Singapore, Australia, Rest of Asia Pacific), Middle East & Africa (UAE, Saudi Arabia, Qatar, South Africa, Rest of Middle East & Africa), Latin America (Brazil, Argentina, Rest of Latin America) |
| Company Profiles | CSL, Biotest AG, Kedrion, BDI Pharma Inc., Baxter, Octapharma AG, LFB, China Biologics Products Inc., Shanghai RAAS Blood products, Shire, Grifols SA, and others |
Frequently Asked Questions
Ans: The Hospital Pharmacies segment dominated the Intravenous Immunoglobulin Market.
Ans: Persistent Supply and Demand Imbalance of Human Plasma Constrain IVIG Market Growth and Accessibility
Ans. The CAGR of the Intravenous Immunoglobulin Market is 7.72% during the forecast period of 2025-2032.
Ans: The North America region dominated the Intravenous Immunoglobulin Market in 2024.
Ans. The projected market size for the Intravenous Immunoglobulin Market is USD 25.39 billion by 2032.
Get in Touch
