Bluetooth Low Energy Market Report Scope & Overview:
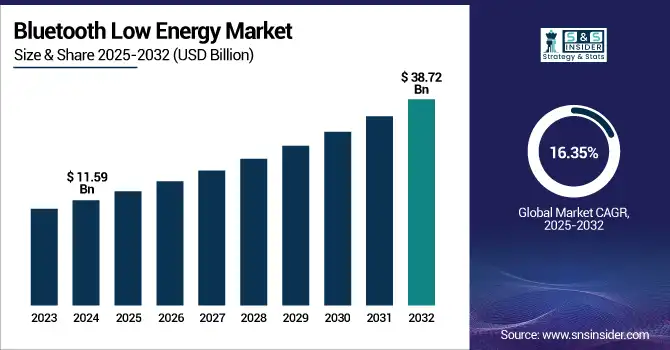
The Bluetooth Low Energy Market size was worth USD 11.59 billion in 2024 and is projected to reach USD 38.72 billion by 2032, expanding at a CAGR of 16.35% during 2025-2032.
To Get more information on Bluetooth Low Energy Market - Request Free Sample Report
The bluetooth low energy (BLE) market growth is witnessing high growth due to the surging adoption of BLE by wearable technology, smart devices, and IoT applications. The cost-effectiveness, ease of connectivity, and low power consumption makes it perfect for healthcare, automotive, and smart home industries, further boosting the global integration and market growth.
In 2024, Bluetooth device shipments reached 5.4 billion units, including 1.1 billion connected devices and 1 billion Bluetooth-enabled network devices, indicating widespread deployment across various device categories.
The U.S. bluetooth low energy market size accounted for a valuation of USD 2.34 billion in 2024 and is expected to reach USD 9.05 billion by 2032, propelling at a CAGR of 18.42% over forecast period.
The growing adoption of industrial IoT applications, smart home devices, and connected healthcare devices is driving the market expansion. The high usage of smart wearable technology by consumers and growing interest in energy-efficient wireless communication also drives the market expansion, driven by a stringent technology infrastructure.
For instance, tech-giant Intel boosted its BLE integration with Wi-Fi 6E modules including BLE 5.2 and BLE 5.4 in 2023 and 2024. The company also planning to launch new Bluetooth 6.0-enabled modules for next-generation connected devices in 2025.
Bluetooth Low Energy Market Dynamics:
Drivers:
-
Burgeoning Battery-Efficient Wireless Communication in Consumer Electronics' Demand is Propelling Market Expansion
The growing requirement for energy-efficient wireless communication is boosting the deployment of Bluetooth Low Energy (BLE) globally. BLE's ultra-low-power characteristics extend device life, so important for wearables, the connected home and fitness gadgets. As user and enterprise demand for electricity-efficient mobile devices continues to grow, BLE could be a perfect choice due to its low energy output while maintaining performance. Its application also extends to industries including home and healthcare automation, further boosting the market expansion. BLE's power efficiency creates it vital for the next-generation intelligent, portable electronics.
Murata Manufacturing introduced the LBEE5KL1DX module with BLE 5.0 for IoT in 2023, followed by the LBEE5KL1DX-2 with BLE 5.2 and enhanced coexistence in 2024. The launch of BLE 5.4 modules is under process by the company for the automotive and other industries in 2025.
Restraints:
-
Shorter Range Limitations Compared to Other Wireless Technologies Restrict Bluetooth Low Energy Applications in Large-scale or Industrial Deployments
Bluetooth Low Energy (BLE) has a limited range when compared with other wireless technologies, and can reach up to 100 meters in line-of-sight conditions. Performance degrades with interference or obstacles and less suitable for industrial or mass-scale installations including production facilities, multi-storied buildings, and outdoor sensor networks. In such environments, the penetration and range of LoRa, Wi-Fi, or Zigbee are all higher, which further hamper BLE's deployment in infrastructure-dense industries. Restricting these limitations are expected to bring hybrid solutions or the evolution of BLE technology to widen its range and enhance its competitiveness in large-scale applications.
Opportunities:
-
Growing Adoption of Wearable Health Devices and Fitness Monitors Opens Scalable Growth Opportunities for Bluetooth Low Energy Technology Globally
Increased wearable health devices and fitness monitor adoption is driving the growth of Bluetooth Low Energy (BLE) technology. BLE’s efficiency allows long data transmission durations, useful for medical alert systems, heart rate monitoring, and smartwatches. Rising chronic disease drive for real-time tracking of health and telehealth services will fuel the demand for BLE which uses low battery and is robust against shutdowns. The increased use of BLE in healthcare products indicates the integration trend, which may be attributed to the enhanced awareness toward wellness and health problems on a global scale, making BLE a leading technology for nascent healthcare solutions.
For instance, Nordic’s nRF54L Series SoCs and nRF52 Series were largely adopted in wearable health devices. Qualcomm's Snapdragon mobile platforms including the Snapdragon 7 Gen 1 and 7 Gen 2, have incorporated BLE 5.2 and beyond, further allowing better connectivity for wearable health devices.
Challenges:
-
Wireless Signal Interference from Surrounding Technologies Impacts Bluetooth Low Energy performance in high-density deployment environments
Bluetooth Low Energy (BLE) uses the 2.4 GHz frequency band, which is also used by Wi-Fi, Zigbee, and other technologies, and hence is prone to interference in high-density environments, such as offices, hospitals, and apartment buildings. This cause disconnections, delays, and data losses that adversely impact user experience, especially in mission-critical applications, where real-time communication is required. The interference management has now become crucial due to the increase in the number of connected devices. As BLE incorporates features to mitigate conflict, they may not necessarily stop performance deterioration. Overcoming this challenge demands better protocols, frequency management, and potentially the inclusion of alternative connectivity solutions.
Segmentation Analysis:
By Network Topology
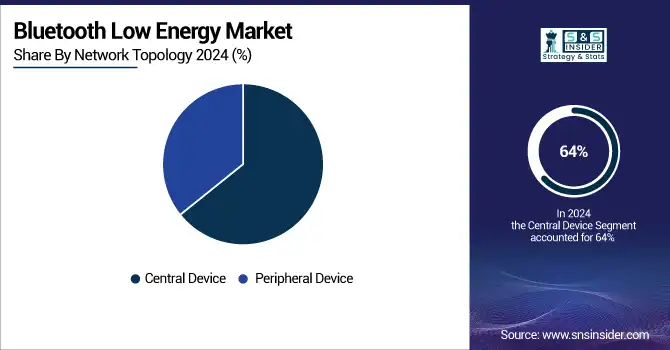
Central Device segment led the Bluetooth Low Energy market share of around 64% in 2024 as it plays a crucial role in controlling and managing peripheral devices in BLE networks. The devices including smartphones, tablets, and gateways act as the central point for data processing, collection, and command execution. The pervasive use of central devices in consumer electronics and IoT environments has entrenched their leadership in BLE architecture and applications.
Peripheral Device segment is expected to grow at the fastest CAGR of about 17.03% from 2025–2032 due to the explosive rise in demand for connected wearables, fitness trackers, sensors, and smart appliances. These devices rely heavily on BLE for efficient, low-power communication. The peripheral devices are proliferating due to the high adoption of IoT-based solutions by industries, further propelling segment's expansion in the market.
By Technology
Integrated Modules segment led the Bluetooth Low Energy market with the largest revenue share of approximately 69% in 2024 due to their plug-and-play simplicity, simplicity of integration, and reduced time-to-market. Appearing as small, reliable packages, these components and firmware help simplify deployment of BLE for manufacturers. They have garnered wide adoption in consumer electronics as well as in medical devices and various industrial equipment making them the go-to choice for BLE implementation.
The Discrete Solutions segment is expected to experience the fastest CAGR of about 18.14% during 2025-2032 due to the growing demand for tailored hardware configurations and performance optimization in specific applications. Discrete components provide for customized BLE solutions, as OEMs require separate control of designs, power consumption, and space. Such versatility is currently being adopted for differentiated product features in automotive, medical, and industrial applications.
By Application
Consumer Electronics segment dominated the Bluetooth Low Energy market with the largest revenue share of around 36% in 2024 because of the widespread adoption of BLE in smartphones, smartwatches, earbuds, and home automation devices. Large shipment volumes, swift technology refreshes, and user adoption of connected experiences have fueled steady BLE adoption, making this segment the main contributor to BLE-based connectivity revenue.
Automotive segment is expected to grow at the fastest CAGR of around 20.38% during 2025–2032, owing to increasing use of BLE for keyless entry, infotainment management, tire pressure monitoring, and vehicle diagnostics. With the increasing connectivity and software definition of vehicles, BLE is gaining traction due to its low-power, short-range communication features, which facilitate effortless interaction between smartphones, onboard systems, and smart infrastructure outside the vehicle.
By Bluetooth Type
The Bluetooth 5.x segment held the largest share of the Bluetooth Low Energy market in terms of revenue of around 50% in 2024 and is anticipated to progress at the fastest CAGR of around 17.36% during the forecast period from 2025 to 2032. Its dominant position mainly owes to its substantial improvements over earlier versions such as increased range, improved data transmission speed, and higher broadcasting capacity, which are of utmost importance for contemporary IoT applications. The growth of the segment is also backed by its increasing integration into smart home networks, automotive systems, and healthcare devices, all of which require efficient, reliable, and scalable wireless communication for smooth user experiences.
Regional Analysis:
Asia Pacific led the Bluetooth Low Energy market holding the largest revenue share of approximately 38% in 2024 due to its robust consumer electronics manufacturing sector, particularly in countries including South Korea, China, and Japan. Asia Pacific's massive population, swift urbanization, and strong smartphone penetration have propelled BLE uptake across wearables, home appliances, and industrial automation, thus establishing Asia Pacific as the major hub for both production and consumption of BLE devices.
China led the bluetooth low energy market owing to its advanced IoT infrastructure, wide electronics manufacturing sector, and large smart wearables, devices, and industrial automation solutions' adoption.
North America is projected to grow with the fastest CAGR of around 18.28% over the forecast period due to the high demand for internet-of-things, cutting-edge automotive solutions, intelligent infrastructure, and connected healthcare devices. High levels of consumer awareness, strong IoT development investments, and early adoption of technology are propelling the integration of BLE across different industry verticals. In addition, support via regulations and a strong ecosystem of technology innovators are consistently boosting the BLE adoption in both consumer and enterprise segments.
The U.S. dominated the Bluetooth Low Energy market in 2024 due to strong IoT adoption, advanced consumer electronics demand, and robust R&D investment across industries.
Europe held a strong position in the Bluetooth Low Energy market in 2024 with its highly developed automotive industry, expanding smart home environment, strong healthcare infrastructure, and rising concentration on energy-efficient, connected IoT solutions in a variety of industries.
Germany led the European bluetooth low energy market owing to its strong automotive industry, substantial investment, and advanced manufacturing base in smart infrastructure and industrial IoT solutions.
The Middle East & Africa and Latin America have an emerging presence in the Bluetooth Low Energy market in 2024 owing to the rising smartphone penetration, growing IoT adoption, and growing demand for connected devices in industries such as healthcare, automotive, and consumer electronics.

Get Customized Report as per Your Business Requirement - Enquiry Now
Key Players:
Bluetooth low energy market companies include Nordic Semiconductor, Qualcomm Technologies, Texas Instruments, NXP Semiconductors, STMicroelectronics, Cypress Semiconductor (Infineon Technologies), MediaTek, Silicon Labs, Dialog Semiconductor (Renesas), Murata Manufacturing, Intel Corporation, Telink, Renesas Electronics Corporation, InsightSIP, Silicon Laboratories.
Recent Developments:
-
In 2024, Nordic introduced the nRF54H series, offering twice the energy efficiency and performance compared to its predecessor. This series supports BLE, LE Audio, Matter, and Auracast, targeting applications like asset tracking and smart home devices.
-
In 2024, Infineon expanded its BLE portfolio with the AIROC CYW89829 MCU, designed for automotive applications like car access and wireless battery management systems. It features robust RF performance and supports Bluetooth 5.4.
-
In 2024, Silicon Labs introduced support for Bluetooth Channel Sounding on its xG24 platform, enabling sub-meter accuracy in distance measurements between BLE devices. This advancement enhances applications like smart locks, geofencing, and access control.
-
In 2024, ST introduced the STM32WBA5 wireless microcontrollers, supporting BLE 5.4, Zigbee, Thread, and Matter. These MCUs aim to simplify the development of secure and connected IoT devices.
| Report Attributes | Details |
|---|---|
| Market Size in 2024 | USD 11.59 Billion |
| Market Size by 2032 | USD 38.37 Billion |
| CAGR | CAGR of 16.35% From 2025 to 2032 |
| Base Year | 2024 |
| Forecast Period | 2025-2032 |
| Historical Data | 2021-2023 |
| Report Scope & Coverage | Market Size, Segments Analysis, Competitive Landscape, Regional Analysis, DROC & SWOT Analysis, Forecast Outlook |
| Key Segments | • By Technology (Integrated Modules, Discrete Solutions) • By Network Topology (Central Device, Peripheral Device) • By Bluetooth Type (Bluetooth 4.0, Bluetooth 4.x, Bluetooth 5.x) • By Application (Consumer Electronics, Sports & Fitness, Automotive, Healthcare, Industrial Automation, Sensing, Medical Applications) |
| Regional Analysis/Coverage | North America (US, Canada, Mexico), Europe (Germany, France, UK, Italy, Spain, Poland, Turkey, Rest of Europe), Asia Pacific (China, India, Japan, South Korea, Singapore, Australia, Rest of Asia Pacific), Middle East & Africa (UAE, Saudi Arabia, Qatar, South Africa, Rest of Middle East & Africa), Latin America (Brazil, Argentina, Rest of Latin America) |
| Company Profiles | Nordic Semiconductor, Qualcomm Technologies, Texas Instruments, NXP Semiconductors, STMicroelectronics, Cypress Semiconductor (Infineon Technologies), MediaTek, Silicon Labs, Dialog Semiconductor (Renesas), Murata Manufacturing, Intel Corporation, Telink, Renesas Electronics Corporation, InsightSIP, Silicon Laboratories. |
Frequently Asked Questions
Ans: North America is expected to grow at the fastest CAGR of 18.28% from 2025–2032, driven by IoT demand and innovation.
Ans: The Peripheral Device segment is expected to grow at the fastest CAGR of about 17.03% from 2025–2032.
Ans: The U.S. Bluetooth Low Energy market is expected to grow at a CAGR of 18.42% from 2025–2032.
Ans: Rising adoption in smart devices, IoT, wearables, low power consumption, and seamless connectivity are key growth drivers.
Ans: Bluetooth Low Energy Market size was valued at USD 11.59 billion in 2024 and is expected to reach USD 38.72 billion by 2032, growing at a CAGR of 16.35% from 2025-2032.
Get in Touch
