image

Visible Light Communication (VLC) Market Size, Share, and Segmentation by Component (Light Emitting Diodes, Photodetectors, Microcontrollers, Software, and Services), Transmission Type (Uni-directional and Bi-directional), Application (Consumer Electronics, Defense and Security, Transportation, Public Infrastructure, Life Sciences, and Other Applications), and Region | Global Forecast 2025-2032

Date: July 2025 Report Code: SNS/ICT/7919 Page 300

Visible Light Communication (VLC) Market Report Scope & Overview:

The Visible Light Communication (VLC) Market Size was valued at USD 2.28 billion in 2024 and is expected to reach USD 31.28 billion by 2032 and grow at a CAGR of 36.6% over the forecast period 2025-2032.
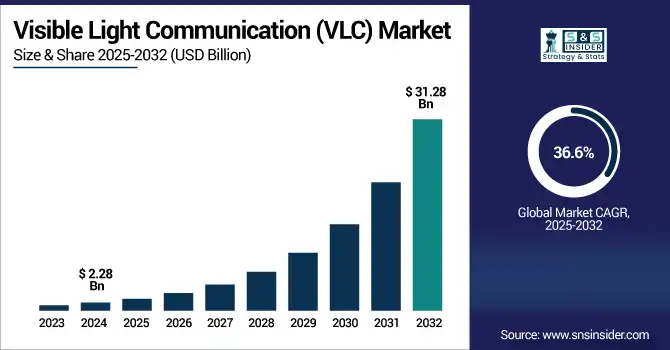
The market is developing rapidly due to increasing demand for interference-free, high-speed speed and secure data connectivity. VLC utilizes LED light for transporting information and is a potential substitute for RF communication. Consumer electronics, automotive, defense, healthcare, and smart infrastructure are a few key industries seeing growing potential for the technology. Rapid urbanization, rising adoption of LED lighting and proliferation of IoT, and advancements in Li-Fi technology are also expected to spur market growth.

According to a recent study, more than 80% of today´s newly installed lighting systems globally are based on LED technology, which provides an excellent launching pad for VLC implementation. Further, the number of Li-Fi-enabled devices is set to exceed 1 billion devices by 2026, indicating increasing commercial and consumer usage. Average VLC throughput is also more than 10 Gbps, much higher than conventional Wi-Fi under some use cases were considered. Some 60-plus smart city pilot projects globally have integrated VLC-based infrastructure for uses including traffic management and indoor navigation.

The U.S. Visible Light Communication (VLC) Market size was USD 0.39 billion in 2024 and is expected to reach USD 4.09 billion by 2032, growing at a CAGR of 34.01% over the forecast period of 2025-2032. The primary factor that is driving the U.S. Visible Light Communication (VLC) market is the Increasing integration of LED lighting as a potential use case for urban VLC access points in the U.S. North America is the largest market for industrial 3D metrology, since the region has a strong infrastructure with the most advanced R&D facilities, and early adoption of new technologies. Moreover, government efforts for the implementation of Li-Fi in secure communications systems fuel the market growth and technological advancements in the region.

Market Dynamics:

Key Drivers:

  • Large-Scale Smart LED Rollouts Across U.S. Cities Drive Visible Light Communication (VLC) Market Growth

The accelerating rollout of smart LED lighting infrastructure across major U.S. cities is a primary driver of the Visible Light Communication (VLC) market. As governments and private sectors replace traditional lighting with connected, energy-efficient LED systems, the opportunity to embed VLC technology within this existing infrastructure becomes economically and technically viable. VLC leverages visible light from LEDs to transmit high-speed data securely and with low latency, offering a compelling alternative to radio-frequency-based systems. In urban environments, these dual-use networks support not only illumination but also advanced connectivity for smart city applications such as traffic management, parking systems, and public safety.

For instance, recent municipal retrofitting projects have included integrated VLC modules to enable real-time communication across dense city environments, unlocking efficiency without increasing the digital footprint. The expansion of smart lighting thus lays the groundwork for VLC technology to be scaled rapidly and cost-effectively in commercial and public infrastructure settings, boosting adoption and technological maturity across sectors.

Restraints:

  • High Deployment Costs and Complex System Integration Impede Widespread VLC Market Penetration

Despite its promising capabilities, the widespread adoption of VLC faces a key restraint in the form of high initial deployment costs and complex system integration. VLC systems require specialized hardware, including optical sensors, LED drivers, and compatible communication interfaces, all of which add to the upfront investment required by businesses or municipalities.

Additionally, integrating VLC into existing infrastructure, especially in legacy buildings or mixed-technology environments, demands tailored engineering solutions, which increases time-to-deployment and resource allocation. These factors can discourage adoption among smaller enterprises, educational institutions, and public organizations with limited budgets. The complexity is further compounded by the need for system compatibility across lighting, networking, and data management platforms, which may not have been designed with VLC in mind. As a result, even with growing interest in high-speed and interference-free communication, these cost and complexity barriers serve as significant friction points, delaying implementation timelines and limiting the technology’s reach in price-sensitive or highly regulated industries.

Opportunities:

  • Increased Demand for Interference-Free Communication in Healthcare Unlocks VLC Market Growth Potential

Healthcare environments are increasingly seeking wireless communication solutions that are immune to electromagnetic interference, which is a unique advantage of VLC systems. This creates a strong growth opportunity for VLC in critical care zones such as surgical suites, diagnostic labs, and MRI rooms, where conventional RF-based communication is often restricted. The ability of VLC to deliver secure, real-time data transmission without interfering with sensitive medical equipment makes it an ideal solution in this context.

Recently, healthcare facilities have started testing VLC networks for applications such as patient monitoring, real-time asset tracking, and staff coordination in high-sensitivity zones. These pilots have demonstrated not only improved data reliability but also enhanced operational efficiency in environments where other wireless technologies fall short. As hospital networks expand and digitization becomes central to modern healthcare delivery, VLC stands out as a viable and innovative alternative. This evolving demand across healthcare institutions opens a substantial pathway for VLC integration and long-term market expansion.

Challenges:

  • Signal Obstruction and Line-of-Sight Dependency Pose Operational Limitations to VLC Technology

A major challenge facing the VLC market is the technology’s dependence on direct line-of-sight between transmitter and receiver. Unlike RF signals, visible light cannot penetrate walls or opaque obstacles, making VLC vulnerable to disruptions caused by moving people, physical barriers, and dynamic room layouts. In practical deployment scenarios, such as retail stores, manufacturing floors, or open office environments, this constraint can severely impact signal continuity and user experience.

Maintaining stable connectivity requires precise lighting alignment and potentially redundant transmission points, which adds to infrastructure complexity and operational cost. Additionally, sudden ambient light changes or interference from other LED sources can impact signal clarity and require real-time adjustment mechanisms. These technical limitations necessitate advanced system designs and hybrid solutions to ensure consistent performance. Until robust solutions for mobility, auto-tracking, or fallback communication modes are universally implemented, these operational vulnerabilities remain a significant challenge to VLC scalability and usability in diverse real-world settings.

Segmentation Analysis:

By Component

Light Emitting Diodes (LEDs) lead the VLC Market in 2024 with a 43% revenue share, driven by widespread deployment in illumination and data communication and its ability to perform dual functions, lighting and data transmission, making it a foundational element of VLC systems. Its high efficiency, long life, and compatibility with modern lighting systems make LEDs a natural choice for smart lighting and VLC-based communication across homes, offices, hospitals, and vehicles. The segment’s leadership is reinforced by growing investments in smart cities and sustainable infrastructure, where energy-efficient lighting and high-speed connectivity converge.

Microcontrollers are projected to grow at the fastest CAGR of 42.14% Over 2025-2032, due to their essential role in processing VLC signals. Microcontrollers are vital to VLC technology as they manage signal processing, encoding, and communication protocols. Their compact size and integration flexibility make them suitable for embedded systems in consumer devices, lighting infrastructure, and medical equipment. As VLC applications become more complex, the demand for high-performance, energy-efficient microcontrollers rises, accelerating their growth. This trend is further amplified by the shift toward edge computing and autonomous control in VLC-enabled environments.

By Application

Public Infrastructure leads VLC applications in 2024 with 33% of total revenue, supported by growing smart city and smart lighting initiatives. The segment dominates as municipalities and government agencies implement VLC in street lighting, traffic systems, and building networks. VLC offers secure, interference-free communication in crowded RF environments, making it ideal for mission-critical urban applications. Its integration with LED-based lighting enables cost-effective deployment without the need for additional hardware, supporting environmental monitoring, pedestrian safety, and citywide communication in a spectrum-congested world.

Consumer Electronics is the fastest-growing application segment and is expected to grow at a CAGR of 41.27% through 2032, driven by high-speed wireless demands. This segment is accelerating as users seek faster, more secure wireless alternatives to traditional RF communication. VLC is being embedded in devices, such as smartphones, laptops, and AR/VR systems, providing high-bandwidth, and low-latency data transfer. Its immunity to electromagnetic interference makes it ideal for indoor environments, enhancing user experience in bandwidth-heavy applications such as media streaming, online gaming, and immersive digital interfaces.

By Transmission Type

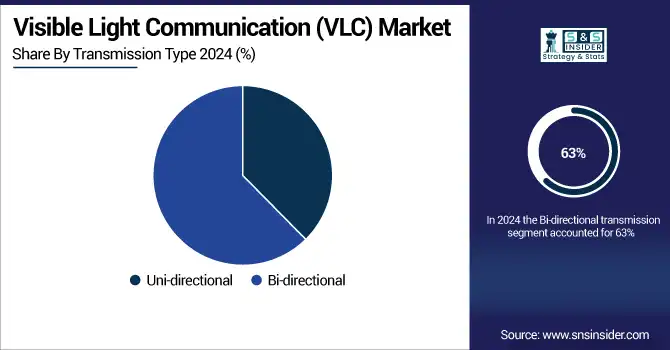
Bi-directional transmission dominates the VLC Market with 63% revenue share in 2024, due to its support for full-duplex communication. The segment leads owing to allows simultaneous transmission and reception of data, enabling real-time applications in healthcare, industrial automation, and secure communications. This capability is critical for enterprise and defense environments, where high-speed, two-way data exchange is essential. The increasing demand for responsive, low-latency communication systems in structured indoor spaces continues to support the dominance of this segment.

Unidirectional transmission is growing at a CAGR of 39.12%, driven by its simplicity and effectiveness in one-way data dissemination. The unidirectional segment is expanding rapidly in use cases, such as indoor navigation, advertising, and information broadcasting. It is particularly useful in public places such as airports, malls, and museums, where VLC can transmit location-specific content to users without the need for back-channel communication. This segment benefits from lower complexity and cost, making it an attractive solution for organizations looking to enhance user engagement and operational efficiency through one-way data communication.
Regional Analysis:

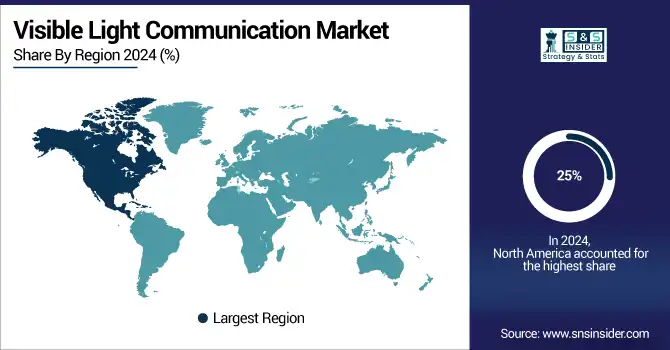
North America holds a dominant visible light communication (VLC) market share25% share of the Visible Light Communication Market in 2024, driven by advanced LED infrastructure, increasing smart city initiatives, and growing demand for interference-free data transmission in dense environments. The U.S. leads the region, supported by strong government initiatives, a high adoption rate of Li-Fi in public and defense sectors, and robust R&D capabilities. With the rapid integration of VLC in smart lighting and connected infrastructure, the U.S. is reinforcing its leadership in the region’s VLC ecosystem.

Asia Pacific is the fastest-growing region in the Visible Light Communication Market in 2024, with a projected CAGR of 41.89% over 2025–2032. The region benefits from rising urbanization, LED adoption in commercial infrastructure, and strong governmental support for smart technologies. China dominates this growth due to its aggressive investment in smart cities, local manufacturing of VLC components, and broad deployment of IoT applications. Strong domestic players and public sector initiatives are accelerating VLC deployment, positioning China as the regional leader in innovation and large-scale implementation.

Europe remains a key contributor to the Visible Light Communication Market in 2024, fueled by EU-led energy efficiency mandates, digital infrastructure policies, and increasing use of VLC in public spaces and transportation. Germany leads the regional market, supported by industrial automation, automotive innovation, and smart mobility projects that incorporate Li-Fi for secure, high-speed communication. The country’s advanced R&D environment and support for emerging technologies are enhancing VLC penetration across both public and private sectors, solidifying its leadership position in Europe.

The Middle East & Africa and Latin America are emerging markets in the Visible Light Communication Market in 2024, driven by increasing demand for secure, high-speed communication and LED-based lighting systems. In the Middle East, the UAE, and Saudi Arabia are integrating VLC into smart city frameworks, including NEOM and urban transport. Meanwhile, Latin America sees traction in Brazil and Mexico, where public lighting upgrades and smart infrastructure projects are paving the way for VLC adoption in urban and commercial applications.
Key Players:

The Visible Light Communication (VLC) Market Companies are Koninklijke Philips NV, LVX System, Bytelight Inc. (Acuity Brands), Panasonic Corporation, PureLiFi Ltd., Oledcomm, Lucibel SA, Outstanding Technology Co. Ltd., Axrtek Company, Firefly Wireless Networks LLC, and others.

Recent Developments:

  • January 2024 – Philips is recognized as a key player in the VLC market. A January 15, 2024, Research‑Nester report listed “Koninklijke Philips NV” among major companies in the visible light communication market 

  • July 2024 – LVX System signed a five-year agreement with NASA’s Kennedy Space Center to explore VLC applications. The partnership, initiated in July, aims to deploy VLC in classrooms and support future NASA space and ground communication research.

Visible Light Communication Market Report Scope:

Report Attributes Details
Market Size in 2024 USD 2.58 Billion 
Market Size by 2032 USD 31.28 Billion 
CAGR CAGR of 36.6% From 2025 to 2032
Base Year 2024
Forecast Period 2025-2032
Historical Data 2021-2023
Report Scope & Coverage Market Size, Segments Analysis, Competitive Landscape, Regional Analysis, DROC & SWOT Analysis, Forecast Outlook
Key Segments by Component (Light Emitting Diodes, Photodetectors, Microcontrollers, Software and Services), Transmission Type (Uni-directional, Bi-directional), and Application (Consumer Electronics, Defense and Security, Transportation, Public Infrastructure, Life Sciences, and Other Applications)
Regional Analysis/Coverage North America (US, Canada, Mexico), Europe (Germany, France, UK, Italy, Spain, Poland, Turkey, Rest of Europe), Asia Pacific (China, India, Japan, South Korea, Singapore, Australia, Taiwan,  Rest of Asia Pacific), Middle East & Africa (UAE, Saudi Arabia, Qatar, South Africa, Rest of Middle East & Africa), Latin America (Brazil, Argentina, Rest of Latin America)
Company Profiles Koninklijke Philips NV, LVX System, Bytelight Inc. (Acuity Brands), Panasonic Corporation, PureLiFi Ltd., Oledcomm, Lucibel SA, Outstanding Technology Co. Ltd., Axrtek Company, Firefly Wireless Networks LLC, and Others.

Frequently Asked Questions

Ans: The Visible Light Communication (VLC) Market is expected to grow at a CAGR of 36.6% during 2025-2032.

Ans: The Visible Light Communication (VLC) Market size was USD 2.28 billion in 2024 and is expected to reach USD 31.28 billion by 2032.

Ans: The major growth factor of the Visible Light Communication (VLC) Market is the rising demand for high-speed, secure, and interference-free wireless communication using energy-efficient LED infrastructure.

Ans: The Public Infrastructure segment dominated the Visible Light Communication (VLC) Market.

Ans: North America dominated the Visible Light Communication (VLC) Market in 2024.


Table of Contents

1. Introduction

1.1 Market Definition

1.2 Scope (Inclusion and Exclusions)

1.3 Research Assumptions

2. Executive Summary

2.1 Market Overview

2.2 Regional Synopsis

2.3 Competitive Summary

3. Research Methodology

3.1 Top-Down Approach

3.2 Bottom-up Approach

3.3. Data Validation

3.4 Primary Interviews

4. Market Dynamics Impact Analysis

4.1 Market Driving Factors Analysis

4.1.1 Drivers

4.1.2 Restraints

4.1.3 Opportunities

4.1.4 Challenges

4.2 PESTLE Analysis

4.3 Porter’s Five Forces Model

5. Statistical Insights and Trends Reporting

5.1 Patent Analysis and Innovation Trends

5.2 Environmental & Energy Efficiency Metrics

5.3 Error Margins and Scenario-Based Projections

5.4 Investment and Funding Statistics

6. Competitive Landscape

6.1 List of Major Companies, By Region

6.2 Market Share Analysis, By Region

6.3 Product Benchmarking

6.3.1 Product specifications and features

6.3.2 Pricing

6.4 Strategic Initiatives

6.4.1 Marketing and promotional activities

6.4.2 Distribution and Supply Chain Strategies

6.4.3 Expansion plans and new Product launches

6.4.4 Strategic partnerships and collaborations

6.5 Technological Advancements

6.6 Market Positioning and Branding

7. Visible Light Communication Market Segmentation By Component

7.1 Chapter Overview

7.2 Light Emitting Diodes

7.2.1 Light Emitting Diodes Market Trends Analysis (2021-2032)

7.2.2 Light Emitting Diodes Market Size Estimates and Forecasts to 2032 (USD Billion)

7.3 Photodetectors

     7.3.1 Photodetectors Market Trends Analysis (2021-2032)

           7.3.2 Photodetectors Market Size Estimates and Forecasts to 2032 (USD Billion)

7.4 Microcontrollers

     7.4.1 Microcontrollers Market Trends Analysis (2021-2032)

           7.4.2 Microcontrollers Market Size Estimates and Forecasts to 2032 (USD Billion)

7.5 Software and Services

     7.5.1 Software and Services Market Trends Analysis (2021-2032)

           7.5.2 Software and Services Market Size Estimates and Forecasts to 2032 (USD Billion)

8. Visible Light Communication Market Segmentation By Transmission Type

8.1 Chapter Overview

8.2 Uni-directional

     8.2.1 Unidirectional Market Trend Analysis (2021-2032)

           8.2.2 Unidirectional Market Size Estimates and Forecasts to 2032 (USD Billion)

8.3 Bi-directional

      8.3.1 Bi-directional Market Trends Analysis (2021-2032)

           8.3.2 Bi-directional Market Size Estimates and Forecasts to 2032 (USD Billion)

9. Visible Light Communication Market Segmentation By Application

9.1 Chapter Overview

9.2 Consumer Electronics

        9.2.1 Consumer Electronics Market Trends Analysis (2021-2032)

9.2.2 Consumer Electronics Market Size Estimates and Forecasts to 2032 (USD Billion)

9.3 Defense and Security

        9.3.1 Defense and Security Market Trends Analysis (2021-2032)

9.3.2 Defense and Security Market Size Estimates and Forecasts to 2032 (USD Billion)

9.4 Transportation

        9.4.1 Transportation Market Trends Analysis (2021-2032)

9.4.2 Transportation Market Size Estimates and Forecasts to 2032 (USD Billion)

9.5 Public Infrastructure

        9.5.1 Public Infrastructure Market Trends Analysis (2021-2032)

9.5.2 Public Infrastructure Market Size Estimates and Forecasts to 2032 (USD Billion)

9.6 Life Sciences

        9.6.1 Life Sciences Market Trends Analysis (2021-2032)

9.6.2 Life Sciences Market Size Estimates and Forecasts to 2032 (USD Billion)

9.7 Other Applications

        9.4.1 Other Applications Market Trends Analysis (2021-2032)

9.7.2 Other Applications Market Size Estimates and Forecasts to 2032 (USD Billion)

10. Regional Analysis

10.1 Chapter Overview

10.2 North America

10.2.1 Trends Analysis

10.2.2 North America Visible Light Communication Market Estimates and Forecasts, by Country (2021-2032) (USD Billion)

10.2.3 North America Visible Light Communication Market Estimates and Forecasts, By Component (2021-2032) (USD Billion) 

10.2.4 North America Visible Light Communication Market Estimates and Forecasts, By Transmission Type (2021-2032) (USD Billion)

10.2.5 North America Visible Light Communication Market Estimates and Forecasts, By Application (2021-2032) (USD Billion)

10.2.6 USA

10.2.6.1 USA Visible Light Communication Market Estimates and Forecasts, By Component (2021-2032) (USD Billion)

10.2.6.2 USA Visible Light Communication Market Estimates and Forecasts, By Transmission Type (2021-2032) (USD Billion)

10.2.6.3 USA Visible Light Communication Market Estimates and Forecasts, By Application (2021-2032) (USD Billion)

10.2.7 Canada

10.2.7.1 Canada Visible Light Communication Market Estimates and Forecasts, By Component (2021-2032) (USD Billion)

10.2.7.2 Canada Visible Light Communication Market Estimates and Forecasts, By Transmission Type (2021-2032) (USD Billion)

10.2.7.3 Canada Visible Light Communication Market Estimates and Forecasts, By Application (2021-2032) (USD Billion)

10.2.8 Mexico

10.2.8.1 Mexico Visible Light Communication Market Estimates and Forecasts, By Component (2021-2032) (USD Billion)

10.2.8.2 Mexico Visible Light Communication Market Estimates and Forecasts, By Transmission Type (2021-2032) (USD Billion)

10.2.8.3 Mexico Visible Light Communication Market Estimates and Forecasts, By Application (2021-2032) (USD Billion)

10.3 Europe

10.3.1 Trends Analysis

10.3.2 Europe Visible Light Communication Market Estimates and Forecasts, by Country (2021-2032) (USD Billion)

10.3.3 Europe Visible Light Communication Market Estimates and Forecasts, By Component (2021-2032) (USD Billion) 

10.3.4 Europe Visible Light Communication Market Estimates and Forecasts, By Transmission Type (2021-2032) (USD Billion)

10.3.5 Europe Visible Light Communication Market Estimates and Forecasts, By Application(2021-2032) (USD Billion)

10.3.6 Germany

10.3.1.6.1 Germany Visible Light Communication Market Estimates and Forecasts, By Component (2021-2032) (USD Billion)

10.3.1.6.2 Germany Visible Light Communication Market Estimates and Forecasts, By Transmission Type (2021-2032) (USD Billion)

10.3.1.6.3 Germany Visible Light Communication Market Estimates and Forecasts, By Application (2021-2032) (USD Billion)

10.3.7 France

10.3.7.1 France Visible Light Communication Market Estimates and Forecasts, By Component (2021-2032) (USD Billion)

10.3.7.2 France a Visible Light Communication Market Estimates and Forecasts, By Transmission Type (2021-2032) (USD Billion)

10.3.7.3 France Visible Light Communication Market Estimates and Forecasts, By Application (2021-2032) (USD Billion)

10.3.8 UK

10.3.8.1 UK Visible Light Communication Market Estimates and Forecasts, By Component (2021-2032) (USD Billion)

10.3.8.2 UK Visible Light Communication Market Estimates and Forecasts, By Transmission Type (2021-2032) (USD Billion)

10.3.8.3 UK Visible Light Communication Market Estimates and Forecasts, By Application (2021-2032) (USD Billion)

10.3.9 Italy

10.3.9.1 Italy Visible Light Communication Market Estimates and Forecasts, By Component (2021-2032) (USD Billion)

10.3.9.2 Italy Visible Light Communication Market Estimates and Forecasts, By Transmission Type (2021-2032) (USD Billion)

10.3.9.3 Italy Visible Light Communication Market Estimates and Forecasts, By Application (2021-2032) (USD Billion)

10.3.10 Spain

10.3.10.1 Spain Visible Light Communication Market Estimates and Forecasts, By Component (2021-2032) (USD Billion)

10.3.10.2 Spain Visible Light Communication Market Estimates and Forecasts, By Transmission Type (2021-2032) (USD Billion)

10.3.10.3 Spain Visible Light Communication Market Estimates and Forecasts, By Application (2021-2032) (USD Billion)

10.3.12 Poland

10.3.12.1 Poland Visible Light Communication Market Estimates and Forecasts, by Country (2021-2032) (USD Billion)

10.3.12.1 Poland Visible Light Communication Market Estimates and Forecasts, By Component (2021-2032) (USD Billion) 

10.3.12.3 Poland Visible Light Communication Market Estimates and Forecasts, By Transmission Type (2021-2032) (USD Billion)

10.3.12.3 Poland Visible Light Communication Market Estimates and Forecasts, By Application (2021-2032) (USD Billion)

10.3.13 Turkey

10.3.13.1 Turkey Visible Light Communication Market Estimates and Forecasts, By Component (2021-2032) (USD Billion)

10.3.13.2 Turkey Visible Light Communication Market Estimates and Forecasts, By Transmission Type (2021-2032) (USD Billion)

10.3.13.3 Turkey Visible Light Communication Market Estimates and Forecasts, By Application (2021-2032) (USD Billion)

10.3.14 Rest of Europe

10.3.14.1 Rest of Europe Visible Light Communication Market Estimates and Forecasts, By Component (2021-2032) (USD Billion)

10.3.14.2 Rest of Europe Visible Light Communication Market Estimates and Forecasts, By Transmission Type (2021-2032) (USD Billion)

10.3.14.3 Rest of Europe Visible Light Communication Market Estimates and Forecasts, By Application(2021-2032) (USD Billion)

10.4 Asia-Pacific

10.4.1 Trends Analysis

  10.4.2 Asia-Pacific Visible Light Communication Market Estimates and Forecasts, by Country (2021-2032) (USD Billion)

 10.4.3 Asia-Pacific Visible Light Communication Market Estimates and Forecasts, By Component (2021-2032) (USD Billion) 

 10.4.4 Asia-Pacific Visible Light Communication Market Estimates and Forecasts, By Transmission Type (2021-2032) (USD Billion)

 10.4.5 Asia-Pacific Visible Light Communication Market Estimates and Forecasts, By Application (2021-2032) (USD Billion)

10.4.6 China

10.4.6.1 China Visible Light Communication Market Estimates and Forecasts, By Component (2021-2032) (USD Billion)

10.4.6.2 China Visible Light Communication Market Estimates and Forecasts, By Transmission Type (2021-2032) (USD Billion)

10.4.6.3 China Visible Light Communication Market Estimates and Forecasts, By Application (2021-2032) (USD Billion)

10.4.7 India

10.4.7.1 India Visible Light Communication Market Estimates and Forecasts, By Component (2021-2032) (USD Billion)

10.4.7.2 India Visible Light Communication Market Estimates and Forecasts, By Transmission Type (2021-2032) (USD Billion)

10.4.7.3 India Visible Light Communication Market Estimates and Forecasts, By Application (2021-2032) (USD Billion)

10.4.8 Japan

10.4.8.1 Japan Visible Light Communication Market Estimates and Forecasts, By Component (2021-2032) (USD Billion)

10.4.8.2 Japan Visible Light Communication Market Estimates and Forecasts, By Transmission Type (2021-2032) (USD Billion)

10.4.8.3 Japan Visible Light Communication Market Estimates and Forecasts, By Application (2021-2032) (USD Billion)

10.4.9 South Korea

10.4.9.1 South Korea Visible Light Communication Market Estimates and Forecasts, By Component (2021-2032) (USD Billion)

10.4.9.2 South Korea Visible Light Communication Market Estimates and Forecasts, By Transmission Type (2021-2032) (USD Billion)

10.4.9.3 South Korea Visible Light Communication Market Estimates and Forecasts, By Application (2021-2032) (USD Billion)

10.4.10 Singapore

10.4.10.1 Singapore Visible Light Communication Market Estimates and Forecasts, By Component (2021-2032) (USD Billion)

10.4.10.2 Singapore Visible Light Communication Market Estimates and Forecasts, By Transmission Type (2021-2032) (USD Billion)

10.4.10.3 Singapore Visible Light Communication Market Estimates and Forecasts, By Application (2021-2032) (USD Billion)

10.4.11 Australia

10.4.11.1 Australia Visible Light Communication Market Estimates and Forecasts, By Component (2021-2032) (USD Billion)

10.4.11.2 Australia Visible Light Communication Market Estimates and Forecasts, By Transmission Type (2021-2032) (USD Billion)

10.4.11.3 Australia Visible Light Communication Market Estimates and Forecasts, By Application (2021-2032) (USD Billion)

10.4.12 Rest of Asia-Pacific

10.4.12.1 Rest of Asia-Pacific Visible Light Communication Market Estimates and Forecasts, By Component (2021-2032) (USD Billion)

10.4.12.2 Rest of Asia-Pacific Visible Light Communication Market Estimates and Forecasts, By Transmission Type (2021-2032) (USD Billion)

10.4.12.3 Rest of Asia-Pacific Visible Light Communication Market Estimates and Forecasts, By Application (2021-2032) (USD Billion)

10.5 Middle East and Africa

10.5.1 Trends Analysis

10.5.2 Middle East and Africa East Visible Light Communication Market Estimates and Forecasts, by Country (2021-2032) (USD Billion)

10.5.3Middle East and Africa Visible Light Communication Market Estimates and Forecasts, By Component (2021-2032) (USD Billion) 

10.5.4 Middle East and Africa Visible Light Communication Market Estimates and Forecasts, By Transmission Type (2021-2032) (USD Billion)

10.5.5 Middle East and Africa Visible Light Communication Market Estimates and Forecasts, By Application (2021-2032) (USD Billion)

10.5.6 UAE

10.5.6.1 UAE Visible Light Communication Market Estimates and Forecasts, By Component (2021-2032) (USD Billion)

10.5.6.2 UAE Visible Light Communication Market Estimates and Forecasts, By Transmission Type (2021-2032) (USD Billion)

10.5.6.3 UAE Visible Light Communication Market Estimates and Forecasts, By Application (2021-2032) (USD Billion)

10.5.7 Saudi Arabia

10.5.7.1 Saudi Arabia Visible Light Communication Market Estimates and Forecasts, By Component (2021-2032) (USD Billion)

10.5.7.2 Saudi Arabia Visible Light Communication Market Estimates and Forecasts, By Transmission Type (2021-2032) (USD Billion)

10.5.7.3 Saudi Arabia Visible Light Communication Market Estimates and Forecasts, By Application (2021-2032) (USD Billion)

10.5.8 Qatar

10.5.8.1 Qatar Visible Light Communication Market Estimates and Forecasts, By Component (2021-2032) (USD Billion)

10.5.8.2 Qatar Visible Light Communication Market Estimates and Forecasts, By Transmission Type (2021-2032) (USD Billion)

10.5.8.3 Qatar Visible Light Communication Market Estimates and Forecasts, By Application (2021-2032) (USD Billion)

10.5.9 South Africa

10.5.9 1 South Africa Visible Light Communication Market Estimates and Forecasts, By Component (2021-2032) (USD Billion)

10.5.9 2 South Africa Visible Light Communication Market Estimates and Forecasts By Transmission Type (2021-2032) (USD Billion)

10.5.9 3 South Africa Visible Light Communication Market Estimates and Forecasts, By Application (2021-2032) (USD Billion)

10.5.10 Rest of Middle East & Africa

10.5.10.1 Rest of Middle East & Africa Visible Light Communication Market Estimates and Forecasts, By Component (2021-2032) (USD Billion)

10.5.10.2 Rest of Middle East & Africa Visible Light Communication Market Estimates and Forecasts, By Transmission Type (2021-2032) (USD Billion)

10.5.10.3 Rest of Middle East & Africa Visible Light Communication Market Estimates and Forecasts, By Application (2021-2032) (USD Billion)

10.6 Latin America

10.6.1 Trends Analysis

10.6.2 Latin America Visible Light Communication Market Estimates and Forecasts, by Country (2021-2032) (USD Billion)

10.6.3 Latin America Visible Light Communication Market Estimates and Forecasts, By Component (2021-2032) (USD Billion) 

10.6.4 Latin America Visible Light Communication Market Estimates and Forecasts, By Transmission Type (2021-2032) (USD Billion)

10.6.5 Latin America Visible Light Communication Market Estimates and Forecasts, By Application (2021-2032) (USD Billion)

10.6.6 Brazil

10.6.6.1 Brazil Visible Light Communication Market Estimates and Forecasts, By Component (2021-2032) (USD Billion)

10.6.6.2 Brazil Visible Light Communication Market Estimates and Forecasts, By Transmission Type (2021-2032) (USD Billion)

10.6.6.3 Brazil Visible Light Communication Market Estimates and Forecasts, By Application (2021-2032) (USD Billion)

10.6.7 Argentina

10.6.7.1 Argentina Visible Light Communication Market Estimates and Forecasts, By Component (2021-2032) (USD Billion)

10.6.7.2 Argentina Visible Light Communication Market Estimates and Forecasts, By Transmission Type (2021-2032) (USD Billion)

10.6.7.3 Argentina Visible Light Communication Market Estimates and Forecasts, By Application (2021-2032) (USD Billion)

10.6.8 Rest of Latin America

10.6.8.1 Rest of Latin America Visible Light Communication Market Estimates and Forecasts, By Component (2021-2032) (USD Billion)

10.6.8.2 Rest of Latin America Visible Light Communication Market Estimates and Forecasts, By Transmission Type (2021-2032) (USD Billion)

10.6.8.3 Rest of Latin America Visible Light Communication Market Estimates and Forecasts, By Application (2021-2032) (USD Billion)

12. Company Profiles

12.1 Koninklijke Philips NV

          12.1.1 Company Overview

12.1.2 Financial

12.1.3 Products/ Services Offered

12.1.4 SWOT Analysis

12.2 LVX System

           12.2.1 Company Overview

12.2.2 Financial

12.2.3 Products/ Services Offered

12.2.4 SWOT Analysis

12.3 Bytelight Inc.

          12.3.1 Company Overview

12.3.2 Financial

12.3.3 Products/ Services Offered

12.3.4 SWOT Analysis

12.4 Panasonic Corporation

          12.4.1 Company Overview

12.4.2 Financial

12.4.3 Products/ Services Offered

12.4.4 SWOT Analysis

12.5 PureLiFi Ltd.

          12.5.1 Company Overview

12.5.2 Financial

12.5.3 Products/ Services Offered

12.5.4 SWOT Analysis

12.6 Oledcomm

            12.6.1 Company Overview

12.6.2 Financial

12.6.3 Products/ Services Offered

12.6.4 SWOT Analysis

12.7 Lucibel SA

          12.7.1 Company Overview

12.7.2 Financial

12.7.3 Products/ Services Offered

12.7.4 SWOT Analysis

12.8 Outstanding Technology Co. Ltd.

12.8.1 Company Overview

12.8.2 Financial

12.8.3 Products/ Services Offered

12.8.4 SWOT Analysis

12.9 Axrtek Company

12.9.1 Company Overview

12.9.2 Financial

12.9.3 Products/ Services Offered

12.9.4 SWOT Analysis

12.10 Firefly Wireless Networks LLC

12.10.1 Company Overview

12.10.2 Financial

12.10.3 Products/ Services Offered

12.10.4 SWOT Analysis

12. Use Cases and Best Practices

13. Conclusion

An accurate research report requires proper strategizing as well as implementation. There are multiple factors involved in the completion of good and accurate research report and selecting the best methodology to compete the research is the toughest part. Since the research reports we provide play a crucial role in any company’s decision-making process, therefore we at SNS Insider always believe that we should choose the best method which gives us results closer to reality. This allows us to reach at a stage wherein we can provide our clients best and accurate investment to output ratio.

Each report that we prepare takes a timeframe of 350-400 business hours for production. Starting from the selection of titles through a couple of in-depth brain storming session to the final QC process before uploading our titles on our website we dedicate around 350 working hours. The titles are selected based on their current market cap and the foreseen CAGR and growth.


The 5 steps process:

Step 1: Secondary Research:

Secondary Research or Desk Research is as the name suggests is a research process wherein, we collect data through the readily available information. In this process we use various paid and unpaid databases which our team has access to and gather data through the same. This includes examining of listed companies’ annual reports, Journals, SEC filling etc. Apart from this our team has access to various associations across the globe across different industries. Lastly, we have exchange relationships with various university as well as individual libraries.

Secondary Research

Step 2: Primary Research

When we talk about primary research, it is a type of study in which the researchers collect relevant data samples directly, rather than relying on previously collected data.  This type of research is focused on gaining content specific facts that can be sued to solve specific problems. Since the collected data is fresh and first hand therefore it makes the study more accurate and genuine.

We at SNS Insider have divided Primary Research into 2 parts.

Part 1 wherein we interview the KOLs of major players as well as the upcoming ones across various geographic regions. This allows us to have their view over the market scenario and acts as an important tool to come closer to the accurate market numbers. As many as 45 paid and unpaid primary interviews are taken from both the demand and supply side of the industry to make sure we land at an accurate judgement and analysis of the market.

This step involves the triangulation of data wherein our team analyses the interview transcripts, online survey responses and observation of on filed participants. The below mentioned chart should give a better understanding of the part 1 of the primary interview.

Primary Research

Part 2: In this part of primary research the data collected via secondary research and the part 1 of the primary research is validated with the interviews from individual consultants and subject matter experts.

Consultants are those set of people who have at least 12 years of experience and expertise within the industry whereas Subject Matter Experts are those with at least 15 years of experience behind their back within the same space. The data with the help of two main processes i.e., FGDs (Focused Group Discussions) and IDs (Individual Discussions). This gives us a 3rd party nonbiased primary view of the market scenario making it a more dependable one while collation of the data pointers.

Step 3: Data Bank Validation

Once all the information is collected via primary and secondary sources, we run that information for data validation. At our intelligence centre our research heads track a lot of information related to the market which includes the quarterly reports, the daily stock prices, and other relevant information. Our data bank server gets updated every fortnight and that is how the information which we collected using our primary and secondary information is revalidated in real time.

Data Bank Validation

Step 4: QA/QC Process

After all the data collection and validation our team does a final level of quality check and quality assurance to get rid of any unwanted or undesired mistakes. This might include but not limited to getting rid of the any typos, duplication of numbers or missing of any important information. The people involved in this process include technical content writers, research heads and graphics people. Once this process is completed the title gets uploader on our platform for our clients to read it.

Step 5: Final QC/QA Process:

This is the last process and comes when the client has ordered the study. In this process a final QA/QC is done before the study is emailed to the client. Since we believe in giving our clients a good experience of our research studies, therefore, to make sure that we do not lack at our end in any way humanly possible we do a final round of quality check and then dispatch the study to the client.

Key Segments: 

By Component          

  • Light Emitting Diodes

  • Photodetectors

  • Microcontrollers

  • Software and Services

By Transmission Type        

  • Uni-directional

  • Bi-directional

By Application          

  • Consumer Electronics

  • Defense and Security

  • Transportation

  • Public Infrastructure

  • Life Sciences

  • Other Applications

Request for Segment Customization as per your Business Requirement: Segment Customization Request

Regional Coverage: 

North America

  • US

  • Canada

  • Mexico

Europe

  • Germany

  • France

  • UK

  • Italy

  • Spain

  • Poland

  • Turkey

  • Rest of Europe

Asia Pacific

  • China

  • India

  • Japan

  • South Korea

  • Singapore

  • Australia

  • Rest of Asia Pacific

Middle East & Africa

  • UAE

  • Saudi Arabia

  • Qatar

  • South Africa

  • Rest of Middle East & Africa

Latin America

  • Brazil

  • Argentina

  • Rest of Latin America

Request for Country Level Research Report: Country Level Customization Request

Available Customization 

With the given market data, SNS Insider offers customization as per the company’s specific needs. The following customization options are available for the report: 

  • Detailed Volume Analysis 

  • Criss-Cross segment analysis (e.g. Product X Application) 

  • Competitive Product Benchmarking 

  • Geographic Analysis 

  • Additional countries in any of the regions 

  • Customized Data Representation 

  • Detailed analysis and profiling of additional market players

Explore Key Insights.


  • Analyzes market trends, forecasts, and regional dynamics
  • Covers core offerings, innovations, and industry use cases
  • Profiles major players, value chains, and strategic developments
  • Highlights innovation trends, regulatory impacts, and growth opportunities
Request an Analyst Call