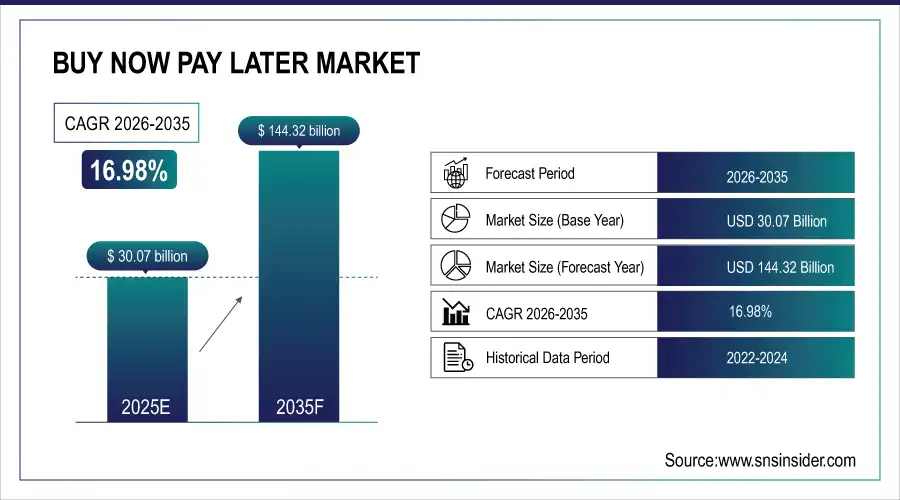
The Buy Now Pay Later Market size was valued at USD 25.71 billion in 2024 and is expected to reach USD 90.15 billion by 2032, expanding at a CAGR of 16.98% over the forecast period of 2025-2032.
The Buy Now Pay Later market is disrupting the world of consumer credit by offering flexible, interest-free payment solutions that allow shoppers to split a purchase into several instalments. As e-commerce skyrockets, bolstered by smartphone penetration and the need for click-and-collect, no-strings-attached purchases, BNPL intrigues millennials (regardless of their age) and Gen Z, and the ability to quickly drive conversion and basket size increases is hard to offer to retailers. Even as technological growth will help with further integration of digital wallets, a good deal of regulatory concern as well as risks of consumer debt present. North America and Europe are the most prominent markets, while the Asia-Pacific region shows the fastest growth potential. With key players leveraging partnerships and innovation, BNPL is rapidly becoming a leading force in contemporary retail payments.
According to research, integrating BNPL options significantly reduces cart abandonment, averaging 70.19%, while over 94% of users return, reflecting strong customer satisfaction and trust in flexible, high-conversion payment solutions.
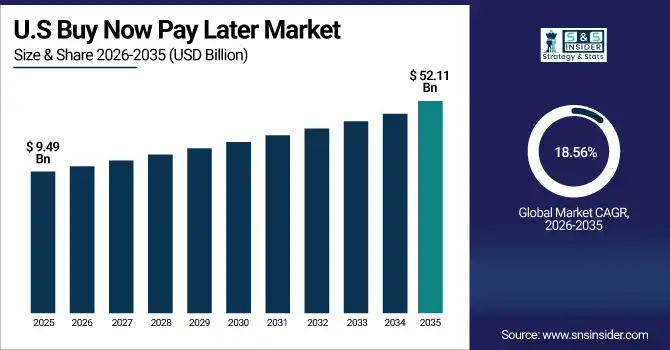
The U.S Buy Now Pay Later market size reached USD 8.01 billion in 2024 and is expected to reach USD 26.37 billion in 2032 at a CAGR of 18.56% from 2025 to 2032.
The U.S. accounts for the largest share of the global buy-now-pay-later (BNPL) market, driven by favourable digital infrastructure, a mature e-commerce landscape, and a preference for interest-free BNPL products. Fintech innovation, a strong credit ecosystem, and BNPL merchant partnerships with large retailers have also encouraged its growth. It further fuels market traction as millennial and Gen Z consumers develop a rising demand for alternative credit, alongside climbing smartphone penetration and instant app-based transactions. In addition, the favourable regulatory developments and changing consumer behaviour are further strengthening the U.S. market growth.
Drivers:
Integration of Artificial Intelligence and Digital Wallets Enhances Consumer Experience and Drives Market Growth.
Integration of Artificial Intelligence and digital wallets is improving the BNPL consumer experience, leading to the growth of the market. Artificial-intelligence driven credit assessments allow providers to analyse purchasing behaviour and credit behaviour, providing tailored credit limits to customers despite a low or non-existent credit track record. The amount of repayment flexibility is also boosted by the utilisation of Machine Learning (ML) algorithms, which calculate a customer's repayment ability in predicting repayment possibilities, enabling organisations to dynamically change a repayment schedule with flexibility.
Restraints:
Rising Concerns Around Consumer Debt and Regulatory Scrutiny Pose Challenges to Market Expansion.
The swift rise of BNPL services has prompted worries over consumer debt stacking and regulatory interest. consumer debt is within reach of a record high, and federal student loan collections are going back into effect. Regulators globally are taking action, such as the UK government having announced new regulations to place BNPL providers under the purview of the Financial Conduct Authority to ensure these short-term credit services are appropriate to contemporary financial conditions.
Opportunities:
Expansion into Healthcare and High-Ticket Categories Presents Significant Growth Opportunities.
In many industries, from healthcare to education & travel, BNPL offers a measly service that lacks the significant upside that the BNPL alternative offers. Elective medical procedures funded through BNPL rose 31% in the U.S. in 2023ZigZag Global. In the early months of 2024, educational course providers also reported that almost 18% of enrolments in online certifications used BNPL. BNPL booking values on travel platforms surged by 22%. Such high-ticket categories create a massive revenue pool as well as long-term user retention.
Challenges:
Operational Complexity and Fraud Risks Challenge the Stability of BNPL Services.
As rising BNPL rises, the challenges of combating fraud and preventing payment failures, however, only get more complex. More than 14% of users from Brazil and Argentina indicated they had BNPL transactions without permission. Regulations around facial recognition have begun, which means fraud prevention tools must also face the challenge of managing the increasing demand for real-time approvals by integrating AI and biometric verification.
By Channel
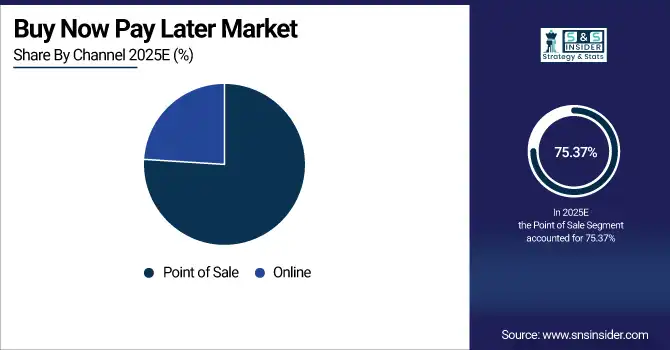
The Point-of-Sale (POS) channel dominates the BNPL market, accounting for 75.37% of the revenue share in 2024. This dominance is fueled by the smooth adoption of BNPL solutions at physical retail locations, which not only increases the purchasing power of the consumer but incites sales conversion as well. Retailers get the advantage of a higher average order value and helps in obtaining customer retention. One instance is Klarna and Adyen's recent partnership which will see BNPL at checkout for over 450,000 brick-and-mortar retail establishments globally, while simultaneously providing consumers a simple approach to diversify their payment channels with flexible payment options.
The online channel is experiencing the fastest buy now pay later market growth in the BNPL market, with a projected CAGR of 21.06% during the forecast period. The rising global trend of e-commerce and customers wanting flexible payment outlets, Built-in BNPL makes ultra-fast credit as easily accessible as functioning checkouts on digital commerce platforms. Major updates are that Affirm has partnered with Apple to offer BNPL options through Apple Pay, thus giving it wider exposure online to consumers. Likewise, with the rise of online consumerism, multiple buy now pay later market companies, such as Zepto, are stepping up with products like Zepto Postpaid to address this need for BNPL.
By Enterprise Type
Large enterprises account for 66.12% of the BNPL market share in 2024. They have the broad customer bases and financial infrastructures to support effective PNPL solution integrations, providing high-ticket consumers with flexible payment solutions. This combination improves satisfaction and boosts sales. Such is the case for Affirm's partnership with Booking. And instead of making travellers pay in full upfront, it allows to get paid slowly as they book, enabling a wider range of people to book with pay-as-you-go payment plans.
The SMEs are expected to achieve an incredible CAGR of 20.27% during the forecast period. SMEs are adopting BNPL solutions as they enable improving customer acquisition and retention through flexible payment solutions. These solutions assist SMEs in boosting their sales conversions and their average order values.
For instance, Dukaan has teamed up with Simple so that SMEs can provide BNPL services seamlessly to their end customers too, making it easier for every customer to be available access to the products & services available.
By Category
The consumer electronics category has a 12.55% revenue share that leads the segment. With BNPL, consumers can pay for expensive electronic devices now and avoid paying interest by only making small payments over time. For retailers, this gives an increased number of purchases and fewer cases of cart abandonment. BNPL providers such as Klarna and Affirm have teamed up with large electronics sellers to provide BNPL services, which furthers the market expansion by increasing customer purchasing power.
The BFSI category is anticipated to grow at the highest CAGR of 22.45% in the BNPL market during the forecast period. The wider adoption of BNPL solutions can drive consumer-friendly financing within financial services, ultimately improving customer experience and satisfaction. As such, financial institutions are getting their own BNPL models to convert customers and build long-term relationships.
For example, Citigroup is distributing deferred payment loans via Citi Pay and Apple Pay to widen its solutions for changing consumer habits. The growth indicates that BNPL is playing an expanding role in the BFSI.
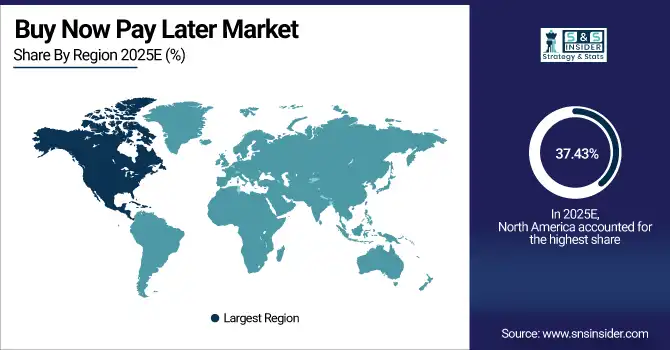
North America accounts for 37.43% of the total market share, owing to better digital infrastructure, rising awareness of BNPL among consumers, and greater uptake of e-commerce. These growing partnerships between retailers and BNPL providers, combined with the increasing dominance of agile fintech heavyweights supporting regional growth.
The U.S. remains the leader in the region on the back of technological infrastructure, increasing use by millennials and Gen Z users, and strong BNPL integration with online and point-of-sale environments.
Europe has strong growth potential, fueled by an increasing appetite for flexible credit, supportive regulations, and a substantial e-commerce user base. The propensity of consumers to choose financing options outside traditional credit only further increases adoption throughout the region.
The UK comes out on top in the region to early uptake of BNPL, a growing number of fintechs, and a progressive regulatory environment promoting responsible lending behaviour.
The Asia Pacific led fastest growth with a CAGR of 20.73%, driven by high smartphone penetration, expanding digital payments infrastructure, and a young, tech-savvy population. BNPL adoption in this part of the world is a product of the growing middle class and expanding e-commerce ecosystem in the region.
China is the dominant player with a substantial aggregate of digital consumers, ubiquitous and integrated payment systems such as Alipay and WeChat Pay, and fast-tracked developments of e-commerce.
The Middle East & Africa and Latin America are still emerging BNPL markets but they are clearly rising on the buy now pay later market trends of growing digital and mobile access, payment efficiency, and the great demand for affordable credit as there are two BNPL leaders in this region the Emirates as the omnichannel country and Brazil due to their robust fintech ecosystem and a strong government institutional environment.
The major key players of the Buy Now Pay Later Market are Affirm Holdings Inc., PayPal, Klarna Bank AB, Sezzle, ZestMoney, Paytm Postpaid, Amazon Pay Later, Laybuy Group Holdings Limited, Splitit, Capital Float, and others.
In May 2025, Sezzle recorded a 64.1% YoY GMV growth and introduced new features such as Pay-in-5 and Money IQ, increasing user engagement and merchant partnerships with brands including Scheels.
In December 2023, Indian BNPL company ZestMoney announced its closure due to failed revival attempts and regulatory issues. Later, in January 2024, DMI Group acquired ZestMoney in a distressed sale, having exclusive rights to its brand name, and it merged its checkout financing platform into DMI's products.
Report Attributes | Details |
---|---|
Market Size in 2024 | USD 25.71 Billion |
Market Size by 2032 | USD 90.15 Billion |
CAGR | CAGR of 16.98% From 2025 to 2032 |
Base Year | 2024 |
Forecast Period | 2025-2032 |
Historical Data | 2021-2023 |
Report Scope & Coverage | Market Size, Segments Analysis, Competitive Landscape, Regional Analysis, DROC & SWOT Analysis, Forecast Outlook |
Key Segments | •By Channel: (Point of Sale (POS), Online) •By Enterprise Type: (SMEs, Large Enterprises) •By Category: (Banking, Financial Services and Insurance (BFSI), Consumer Electronics, Fashion & Garment, Healthcare, Retail, Media and Entertainment, Others (Travel and Transportation, Education, Logistics)) |
Regional Analysis/Coverage | North America (US, Canada, Mexico), Europe (Germany, France, UK, Italy, Spain, Poland, Turkey, Rest of Europe), Asia Pacific (China, India, Japan, South Korea, Singapore, Australia, Rest of Asia Pacific), Middle East & Africa (UAE, Saudi Arabia, Qatar, South Africa, Rest of Middle East & Africa), Latin America (Brazil, Argentina, Rest of Latin America) |
Company Profiles | Affirm Holdings Inc., PayPal, Klarna Bank AB, Sezzle, ZestMoney, Paytm Postpaid, Amazon Pay Later, Laybuy Group Holdings Limited, Splitit, Capital Float, and others. |
Ans: The Buy Now Pay Later Market is expected to grow at a CAGR of 16.98% from 2025 to 2032, reaching USD 90.15 billion by the end of the forecast period.
Ans: The Buy Now Pay Later Market was valued at USD 25.71 billion in 2024, reflecting increasing adoption across retail, electronics, and e-commerce sectors.
Ans: A major growth factor driving the Buy Now Pay Later Market is the integration of Artificial Intelligence and digital wallets, which enhances consumer experience by enabling tailored credit limits and flexible repayment options through data-driven insights.
Ans: The Point-of-Sale (POS) channel dominated the Buy Now Pay Later Market by type in 2024, capturing 75.37% of the market share. This is due to seamless BNPL integration in physical retail, boosting consumer purchasing power and sales conversion rates.
Ans: North America dominated the Buy Now Pay Later Market in 2024, accounting for 37.43% of the total market share. This was driven by robust digital infrastructure, rising consumer awareness, and widespread adoption among millennials and Gen Z.
Table of Contents
1. Introduction
1.1 Market Definition
1.2 Scope (Inclusion and Exclusions)
1.3 Research Assumptions
2. Executive Summary
2.1 Market Overview
2.2 Regional Synopsis
2.3 Competitive Summary
3. Research Methodology
3.1 Top-Down Approach
3.2 Bottom-up Approach
3.3. Data Validation
3.4 Primary Interviews
4. Market Dynamics Impact Analysis
4.1 Market Driving Factors Analysis
4.1.1 Drivers
4.1.2 Restraints
4.1.3 Opportunities
4.1.4 Challenges
4.2 PESTLE Analysis
4.3 Porter’s Five Forces Model
5. Statistical Insights and Trends Reporting
5.1 Consumer Behavior & Demographics
5.2 Financial Impact Metrics
5.3 Regulatory & Compliance Trends
5.4 User Experience & Satisfaction
6. Competitive Landscape
6.1 List of Major Companies, By Region
6.2 Market Share Analysis, By Region
6.3 Product Benchmarking
6.3.1 Product specifications and features
6.3.2 Pricing
6.4 Strategic Initiatives
6.4.1 Marketing and promotional activities
6.4.2 Distribution and Supply Chain Strategies
6.4.3 Expansion plans and new Product launches
6.4.4 Strategic partnerships and collaborations
6.5 Technological Advancements
6.6 Market Positioning and Branding
7. Buy Now Pay Later Market Segmentation By Channel
7.1 Chapter Overview
7.2 Point of Sale (POS)
7.2.1 Point of Sale (POS) Market Trends Analysis (2021-2032)
7.2.2 Point of Sale (POS) Market Size Estimates and Forecasts to 2032 (USD Billion)
7.3 Online
7.3.1 Online Market Trends Analysis (2021-2032)
7.3.2 Online Market Size Estimates and Forecasts to 2032 (USD Billion)
8. Buy Now Pay Later Market Segmentation By Enterprise Type
8.1 Chapter Overview
8.2 Small & Mid-sized Enterprises
8.2.1 Small & Mid-sized Enterprises Market Trend Analysis (2021-2032)
8.2.2 Small & Mid-sized Enterprises Market Size Estimates and Forecasts to 2032 (USD Billion)
8.3 Large Enterprises
8.3.1 Large Enterprises Market Trends Analysis (2021-2032)
8.3.2 Large Enterprises Market Size Estimates and Forecasts to 2032 (USD Billion)
9. Buy Now Pay Later Market Segmentation By End-user Vertical
9.1 Chapter Overview
9.2 BFSI
9.2.1 BFSI Market Trends Analysis (2021-2032)
9.2.2 BFSI Market Size Estimates and Forecasts to 2032 (USD Billion)
9.3 Consumer Electronics
9.3.1 Consumer Electronics Market Trends Analysis (2021-2032)
9.3.2 Consumer Electronics Market Size Estimates and Forecasts to 2032 (USD Billion)
9.4 Fashion & Garment
9.4.1 Fashion & Garment Market Trends Analysis (2021-2032)
9.4.2 Fashion & Garment Market Size Estimates and Forecasts to 2032 (USD Billion)
9.5 Retail
9.5.1 Retail Market Trends Analysis (2021-2032)
9.5.2 Retail Market Size Estimates and Forecasts to 2032 (USD Billion)
9.6 Healthcare
9.6.1 Healthcare Market Trends Analysis (2021-2032)
9.6.2 Healthcare Market Size Estimates and Forecasts to 2032 (USD Billion)
9.7 Media and Entertainment
9.7.1 Media and Entertainment Market Trends Analysis (2021-2032)
9.7.2 Media and Entertainment Market Size Estimates and Forecasts to 2032 (USD Billion)
9.7 Others
9.7.1 Others Market Trends Analysis (2021-2032)
9.7.2 Others Market Size Estimates and Forecasts to 2032 (USD Billion)
10. Regional Analysis
10.1 Chapter Overview
10.2 North America
10.2.1 Trends Analysis
10.2.2 North America Buy Now Pay Later Market Estimates and Forecasts, by Country (2021-2032) (USD Billion)
10.2.3 North America Buy Now Pay Later Market Estimates and Forecasts, By Channel (2021-2032) (USD Billion)
10.2.4 North America Buy Now Pay Later Market Estimates and Forecasts, By Enterprise Type (2021-2032) (USD Billion)
10.2.5 North America Buy Now Pay Later Market Estimates and Forecasts, By End-user Vertical (2021-2032) (USD Billion)
10.2.6 USA
10.2.6.1 USA Buy Now Pay Later Market Estimates and Forecasts, By Channel (2021-2032) (USD Billion)
10.2.6.2 USA Buy Now Pay Later Market Estimates and Forecasts, By Enterprise Type (2021-2032) (USD Billion)
10.2.6.3 USA Buy Now Pay Later Market Estimates and Forecasts, By End-user Vertical (2021-2032) (USD Billion)
10.2.7 Canada
10.2.7.1 Canada Buy Now Pay Later Market Estimates and Forecasts, By Channel (2021-2032) (USD Billion)
10.2.7.2 Canada Buy Now Pay Later Market Estimates and Forecasts, By Enterprise Type (2021-2032) (USD Billion)
10.2.7.3 Canada Buy Now Pay Later Market Estimates and Forecasts, By End-user Vertical (2021-2032) (USD Billion)
10.2.8 Mexico
10.2.8.1 Mexico Buy Now Pay Later Market Estimates and Forecasts, By Channel (2021-2032) (USD Billion)
10.2.8.2 Mexico Buy Now Pay Later Market Estimates and Forecasts, By Enterprise Type (2021-2032) (USD Billion)
10.2.8.3 Mexico Buy Now Pay Later Market Estimates and Forecasts, By End-user Vertical (2021-2032) (USD Billion)
10.3 Europe
10.3.1 Trends Analysis
10.3.2 Europe Buy Now Pay Later Market Estimates and Forecasts, by Country (2021-2032) (USD Billion)
10.3.3 Europe Buy Now Pay Later Market Estimates and Forecasts, By Channel (2021-2032) (USD Billion)
10.3.4 Europe Buy Now Pay Later Market Estimates and Forecasts, By Enterprise Type (2021-2032) (USD Billion)
10.3.5 Europe Buy Now Pay Later Market Estimates and Forecasts, By End-user Vertical(2021-2032) (USD Billion)
10.3.6 Germany
10.3.1.6.1 Germany Buy Now Pay Later Market Estimates and Forecasts, By Channel (2021-2032) (USD Billion)
10.3.1.6.2 Germany Buy Now Pay Later Market Estimates and Forecasts, By Enterprise Type (2021-2032) (USD Billion)
10.3.1.6.3 Germany Buy Now Pay Later Market Estimates and Forecasts, By End-user Vertical (2021-2032) (USD Billion)
10.3.7 France
10.3.7.1 France Buy Now Pay Later Market Estimates and Forecasts, By Channel (2021-2032) (USD Billion)
10.3.7.2 France a Buy Now Pay Later Market Estimates and Forecasts, By Enterprise Type (2021-2032) (USD Billion)
10.3.7.3 France Buy Now Pay Later Market Estimates and Forecasts, By End-user Vertical (2021-2032) (USD Billion)
10.3.8 UK
10.3.8.1 UK Buy Now Pay Later Market Estimates and Forecasts, By Channel (2021-2032) (USD Billion)
10.3.8.2 UK Buy Now Pay Later Market Estimates and Forecasts, By Enterprise Type (2021-2032) (USD Billion)
10.3.8.3 UK Buy Now Pay Later Market Estimates and Forecasts, By End-user Vertical (2021-2032) (USD Billion)
10.3.9 Italy
10.3.9.1 Italy Buy Now Pay Later Market Estimates and Forecasts, By Channel (2021-2032) (USD Billion)
10.3.9.2 Italy Buy Now Pay Later Market Estimates and Forecasts, By Enterprise Type (2021-2032) (USD Billion)
10.3.9.3 Italy Buy Now Pay Later Market Estimates and Forecasts, By End-user Vertical (2021-2032) (USD Billion)
10.3.10 Spain
10.3.10.1 Spain Buy Now Pay Later Market Estimates and Forecasts, By Channel (2021-2032) (USD Billion)
10.3.10.2 Spain Buy Now Pay Later Market Estimates and Forecasts, By Enterprise Type (2021-2032) (USD Billion)
10.3.10.3 Spain Buy Now Pay Later Market Estimates and Forecasts, By End-user Vertical (2021-2032) (USD Billion)
10.3.12 Poland
10.3.12.1 Poland Buy Now Pay Later Market Estimates and Forecasts, by Country (2021-2032) (USD Billion)
10.3.12.1 Poland Buy Now Pay Later Market Estimates and Forecasts, By Channel (2021-2032) (USD Billion)
10.3.12.3 Poland Buy Now Pay Later Market Estimates and Forecasts, By Enterprise Type (2021-2032) (USD Billion)
10.3.12.3 Poland Buy Now Pay Later Market Estimates and Forecasts, By End-user Vertical (2021-2032) (USD Billion)
10.3.13 Turkey
10.3.13.1 Turkey Buy Now Pay Later Market Estimates and Forecasts, By Channel (2021-2032) (USD Billion)
10.3.13.2 Turkey Buy Now Pay Later Market Estimates and Forecasts, By Enterprise Type (2021-2032) (USD Billion)
10.3.13.3 Turkey Buy Now Pay Later Market Estimates and Forecasts, By End-user Vertical (2021-2032) (USD Billion)
10.3.14 Rest of Europe
10.3.14.1 Rest of Europe Buy Now Pay Later Market Estimates and Forecasts, By Channel (2021-2032) (USD Billion)
10.3.14.2 Rest of Europe Buy Now Pay Later Market Estimates and Forecasts, By Enterprise Type (2021-2032) (USD Billion)
10.3.14.3 Rest of Europe Buy Now Pay Later Market Estimates and Forecasts, By End-user Vertical(2021-2032) (USD Billion)
10.4 Asia-Pacific
10.4.1 Trends Analysis
10.4.2 Asia-Pacific Buy Now Pay Later Market Estimates and Forecasts, by Country (2021-2032) (USD Billion)
10.4.3 Asia-Pacific Buy Now Pay Later Market Estimates and Forecasts, By Channel (2021-2032) (USD Billion)
10.4.4 Asia-Pacific Buy Now Pay Later Market Estimates and Forecasts, By Enterprise Type (2021-2032) (USD Billion)
10.4.5 Asia-Pacific Buy Now Pay Later Market Estimates and Forecasts, By End-user Vertical (2021-2032) (USD Billion)
10.4.6 China
10.4.6.1 China Buy Now Pay Later Market Estimates and Forecasts, By Channel (2021-2032) (USD Billion)
10.4.6.2 China Buy Now Pay Later Market Estimates and Forecasts, By Enterprise Type (2021-2032) (USD Billion)
10.4.6.3 China Buy Now Pay Later Market Estimates and Forecasts, By End-user Vertical (2021-2032) (USD Billion)
10.4.7 India
10.4.7.1 India Buy Now Pay Later Market Estimates and Forecasts, By Channel (2021-2032) (USD Billion)
10.4.7.2 India Buy Now Pay Later Market Estimates and Forecasts, By Enterprise Type (2021-2032) (USD Billion)
10.4.7.3 India Buy Now Pay Later Market Estimates and Forecasts, By End-user Vertical (2021-2032) (USD Billion)
10.4.8 Japan
10.4.8.1 Japan Buy Now Pay Later Market Estimates and Forecasts, By Channel (2021-2032) (USD Billion)
10.4.8.2 Japan Buy Now Pay Later Market Estimates and Forecasts, By Enterprise Type (2021-2032) (USD Billion)
10.4.8.3 Japan Buy Now Pay Later Market Estimates and Forecasts, By End-user Vertical (2021-2032) (USD Billion)
10.4.9 South Korea
10.4.9.1 South Korea Buy Now Pay Later Market Estimates and Forecasts, By Channel (2021-2032) (USD Billion)
10.4.9.2 South Korea Buy Now Pay Later Market Estimates and Forecasts, By Enterprise Type (2021-2032) (USD Billion)
10.4.9.3 South Korea Buy Now Pay Later Market Estimates and Forecasts, By End-user Vertical (2021-2032) (USD Billion)
10.4.10 Singapore
10.4.10.1 Singapore Buy Now Pay Later Market Estimates and Forecasts, By Channel (2021-2032) (USD Billion)
10.4.10.2 Singapore Buy Now Pay Later Market Estimates and Forecasts, By Enterprise Type (2021-2032) (USD Billion)
10.4.10.3 Singapore Buy Now Pay Later Market Estimates and Forecasts, By End-user Vertical (2021-2032) (USD Billion)
10.4.11 Australia
10.4.11.1 Australia Buy Now Pay Later Market Estimates and Forecasts, By Channel (2021-2032) (USD Billion)
10.4.11.2 Australia Buy Now Pay Later Market Estimates and Forecasts, By Enterprise Type (2021-2032) (USD Billion)
10.4.11.3 Australia Buy Now Pay Later Market Estimates and Forecasts, By End-user Vertical (2021-2032) (USD Billion)
10.4.12 Rest of Asia-Pacific
10.4.12.1 Rest of Asia-Pacific Buy Now Pay Later Market Estimates and Forecasts, By Channel (2021-2032) (USD Billion)
10.4.12.2 Rest of Asia-Pacific Buy Now Pay Later Market Estimates and Forecasts, By Enterprise Type (2021-2032) (USD Billion)
10.4.12.3 Rest of Asia-Pacific Buy Now Pay Later Market Estimates and Forecasts, By End-user Vertical (2021-2032) (USD Billion)
10.5 Middle East and Africa
10.5.1 Trends Analysis
10.5.2 Middle East and Africa East Buy Now Pay Later Market Estimates and Forecasts, by Country (2021-2032) (USD Billion)
10.5.3Middle East and Africa Buy Now Pay Later Market Estimates and Forecasts, By Channel (2021-2032) (USD Billion)
10.5.4 Middle East and Africa Buy Now Pay Later Market Estimates and Forecasts, By Enterprise Type (2021-2032) (USD Billion)
10.5.5 Middle East and Africa Buy Now Pay Later Market Estimates and Forecasts, By End-user Vertical (2021-2032) (USD Billion)
10.5.6 UAE
10.5.6.1 UAE Buy Now Pay Later Market Estimates and Forecasts, By Channel (2021-2032) (USD Billion)
10.5.6.2 UAE Buy Now Pay Later Market Estimates and Forecasts, By Enterprise Type (2021-2032) (USD Billion)
10.5.6.3 UAE Buy Now Pay Later Market Estimates and Forecasts, By End-user Vertical (2021-2032) (USD Billion)
10.5.7 Saudi Arabia
10.5.7.1 Saudi Arabia Buy Now Pay Later Market Estimates and Forecasts, By Channel (2021-2032) (USD Billion)
10.5.7.2 Saudi Arabia Buy Now Pay Later Market Estimates and Forecasts, By Enterprise Type (2021-2032) (USD Billion)
10.5.7.3 Saudi Arabia Buy Now Pay Later Market Estimates and Forecasts, By End-user Vertical (2021-2032) (USD Billion)
10.5.8 Qatar
10.5.8.1 Qatar Buy Now Pay Later Market Estimates and Forecasts, By Channel (2021-2032) (USD Billion)
10.5.8.2 Qatar Buy Now Pay Later Market Estimates and Forecasts, By Enterprise Type (2021-2032) (USD Billion)
10.5.8.3 Qatar Buy Now Pay Later Market Estimates and Forecasts, By End-user Vertical (2021-2032) (USD Billion)
10.5.9 South Africa
10.5.9 1 South Africa Buy Now Pay Later Market Estimates and Forecasts, By Channel (2021-2032) (USD Billion)
10.5.9 2 South Africa Buy Now Pay Later Market Estimates and Forecasts By Enterprise Type (2021-2032) (USD Billion)
10.5.9 3 South Africa Buy Now Pay Later Market Estimates and Forecasts, By End-user Vertical (2021-2032) (USD Billion)
10.5.10 Rest of Middle East & Africa
10.5.10.1 Rest of Middle East & Africa Buy Now Pay Later Market Estimates and Forecasts, By Channel (2021-2032) (USD Billion)
10.5.10.2 Rest of Middle East & Africa Buy Now Pay Later Market Estimates and Forecasts, By Enterprise Type (2021-2032) (USD Billion)
10.5.10.3 Rest of Middle East & Africa Buy Now Pay Later Market Estimates and Forecasts, By End-user Vertical (2021-2032) (USD Billion)
10.6 Latin America
10.6.1 Trends Analysis
10.6.2 Latin America Buy Now Pay Later Market Estimates and Forecasts, by Country (2021-2032) (USD Billion)
10.6.3 Latin America Buy Now Pay Later Market Estimates and Forecasts, By Channel (2021-2032) (USD Billion)
10.6.4 Latin America Buy Now Pay Later Market Estimates and Forecasts, By Enterprise Type (2021-2032) (USD Billion)
10.6.5 Latin America Buy Now Pay Later Market Estimates and Forecasts, By End-user Vertical (2021-2032) (USD Billion)
10.6.6 Brazil
10.6.6.1 Brazil Buy Now Pay Later Market Estimates and Forecasts, By Channel (2021-2032) (USD Billion)
10.6.6.2 Brazil Buy Now Pay Later Market Estimates and Forecasts, By Enterprise Type (2021-2032) (USD Billion)
10.6.6.3 Brazil Buy Now Pay Later Market Estimates and Forecasts, By End-user Vertical (2021-2032) (USD Billion)
10.6.7 Argentina
10.6.7.1 Argentina Buy Now Pay Later Market Estimates and Forecasts, By Channel (2021-2032) (USD Billion)
10.6.7.2 Argentina Buy Now Pay Later Market Estimates and Forecasts, By Enterprise Type (2021-2032) (USD Billion)
10.6.7.3 Argentina Buy Now Pay Later Market Estimates and Forecasts, By End-user Vertical (2021-2032) (USD Billion)
10.6.8 Rest of Latin America
10.6.8.1 Rest of Latin America Buy Now Pay Later Market Estimates and Forecasts, By Channel (2021-2032) (USD Billion)
10.6.8.2 Rest of Latin America Buy Now Pay Later Market Estimates and Forecasts, By Enterprise Type (2021-2032) (USD Billion)
10.6.8.3 Rest of Latin America Buy Now Pay Later Market Estimates and Forecasts, By End-user Vertical (2021-2032) (USD Billion)
12. Company Profiles
12.1 Affirm Holdings Inc.
12.1.1 Company Overview
12.1.2 Financial
12.1.3 Products/ Services Offered
12.1.4 SWOT Analysis
12.2 PayPal
12.2.1 Company Overview
12.2.2 Financial
12.2.3 Products/ Services Offered
12.2.4 SWOT Analysis
12.3 Klarna Bank AB
12.3.1 Company Overview
12.3.2 Financial
12.3.3 Products/ Services Offered
12.3.4 SWOT Analysis
12.4 Sezzle
12.4.1 Company Overview
12.4.2 Financial
12.4.3 Products/ Services Offered
12.4.4 SWOT Analysis
12.5 ZestMoney
12.5.1 Company Overview
12.5.2 Financial
12.5.3 Products/ Services Offered
12.5.4 SWOT Analysis
12.6 Paytm Postpaid
12.6.1 Company Overview
12.6.2 Financial
12.6.3 Products/ Services Offered
12.6.4 SWOT Analysis
12.7 Amazon Pay Later
12.7.1 Company Overview
12.7.2 Financial
12.7.3 Products/ Services Offered
12.7.4 SWOT Analysis
12.8 Laybuy Group Holdings Limited
12.8.1 Company Overview
12.8.2 Financial
12.8.3 Products/ Services Offered
12.8.4 SWOT Analysis
12.9 Splitit
12.9.1 Company Overview
12.9.2 Financial
12.9.3 Products/ Services Offered
12.9.4 SWOT Analysis
12.10 Capital Float
12.10.1 Company Overview
12.10.2 Financial
12.10.3 Products/ Services Offered
12.10.4 SWOT Analysi
12. Use Cases and Best Practices
13. Conclusion
An accurate research report requires proper strategizing as well as implementation. There are multiple factors involved in the completion of good and accurate research report and selecting the best methodology to compete the research is the toughest part. Since the research reports we provide play a crucial role in any company’s decision-making process, therefore we at SNS Insider always believe that we should choose the best method which gives us results closer to reality. This allows us to reach at a stage wherein we can provide our clients best and accurate investment to output ratio.
Each report that we prepare takes a timeframe of 350-400 business hours for production. Starting from the selection of titles through a couple of in-depth brain storming session to the final QC process before uploading our titles on our website we dedicate around 350 working hours. The titles are selected based on their current market cap and the foreseen CAGR and growth.
The 5 steps process:
Step 1: Secondary Research:
Secondary Research or Desk Research is as the name suggests is a research process wherein, we collect data through the readily available information. In this process we use various paid and unpaid databases which our team has access to and gather data through the same. This includes examining of listed companies’ annual reports, Journals, SEC filling etc. Apart from this our team has access to various associations across the globe across different industries. Lastly, we have exchange relationships with various university as well as individual libraries.
Step 2: Primary Research
When we talk about primary research, it is a type of study in which the researchers collect relevant data samples directly, rather than relying on previously collected data. This type of research is focused on gaining content specific facts that can be sued to solve specific problems. Since the collected data is fresh and first hand therefore it makes the study more accurate and genuine.
We at SNS Insider have divided Primary Research into 2 parts.
Part 1 wherein we interview the KOLs of major players as well as the upcoming ones across various geographic regions. This allows us to have their view over the market scenario and acts as an important tool to come closer to the accurate market numbers. As many as 45 paid and unpaid primary interviews are taken from both the demand and supply side of the industry to make sure we land at an accurate judgement and analysis of the market.
This step involves the triangulation of data wherein our team analyses the interview transcripts, online survey responses and observation of on filed participants. The below mentioned chart should give a better understanding of the part 1 of the primary interview.
Part 2: In this part of primary research the data collected via secondary research and the part 1 of the primary research is validated with the interviews from individual consultants and subject matter experts.
Consultants are those set of people who have at least 12 years of experience and expertise within the industry whereas Subject Matter Experts are those with at least 15 years of experience behind their back within the same space. The data with the help of two main processes i.e., FGDs (Focused Group Discussions) and IDs (Individual Discussions). This gives us a 3rd party nonbiased primary view of the market scenario making it a more dependable one while collation of the data pointers.
Step 3: Data Bank Validation
Once all the information is collected via primary and secondary sources, we run that information for data validation. At our intelligence centre our research heads track a lot of information related to the market which includes the quarterly reports, the daily stock prices, and other relevant information. Our data bank server gets updated every fortnight and that is how the information which we collected using our primary and secondary information is revalidated in real time.
Step 4: QA/QC Process
After all the data collection and validation our team does a final level of quality check and quality assurance to get rid of any unwanted or undesired mistakes. This might include but not limited to getting rid of the any typos, duplication of numbers or missing of any important information. The people involved in this process include technical content writers, research heads and graphics people. Once this process is completed the title gets uploader on our platform for our clients to read it.
Step 5: Final QC/QA Process:
This is the last process and comes when the client has ordered the study. In this process a final QA/QC is done before the study is emailed to the client. Since we believe in giving our clients a good experience of our research studies, therefore, to make sure that we do not lack at our end in any way humanly possible we do a final round of quality check and then dispatch the study to the client.
Key Segments:
By Channel
Point of Sale (POS)
Online
By Enterprise Type
SMEs
Large Enterprises
By Category
Banking, Financial Services and Insurance (BFSI)
Consumer Electronics
Fashion & Garment
Healthcare
Retail
Media and Entertainment
Others (Travel and Transportation, Education, Logistics)
Request for Segment Customization as per your Business Requirement: Segment Customization Request
Regional Coverage:
North America
US
Canada
Mexico
Europe
Germany
France
UK
Italy
Spain
Poland
Turkey
Rest of Europe
Asia Pacific
China
India
Japan
South Korea
Singapore
Australia
Rest of Asia Pacific
Middle East & Africa
UAE
Saudi Arabia
Qatar
South Africa
Rest of Middle East & Africa
Latin America
Brazil
Argentina
Rest of Latin America
Request for Country Level Research Report: Country Level Customization Request
Available Customization
With the given market data, SNS Insider offers customization as per the company’s specific needs. The following customization options are available for the report:
Detailed Volume Analysis
Criss-Cross segment analysis (e.g. Product X Application)
Competitive Product Benchmarking
Geographic Analysis
Additional countries in any of the regions
Customized Data Representation
Detailed analysis and profiling of additional market players