AI Psychological Counseling Market Report Scope & Overview:
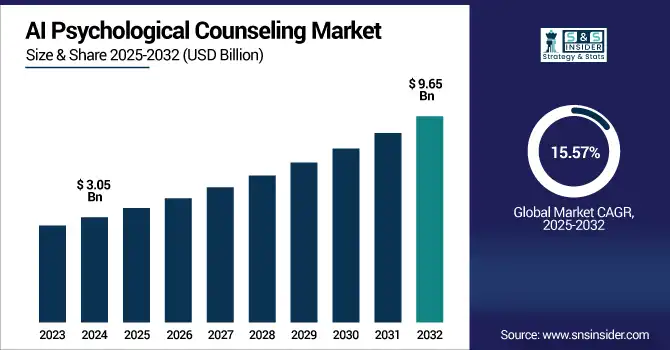
AI Psychological Counseling Market size was valued at USD 3.05 billion in 2024 and is expected to reach USD 9.65 billion by 2032, growing at a CAGR of 15.57% over 2025-2032.
To Get more information onPsychological Counseling Market - Request Free Sample Report
The AI Psychological Counseling Market growth is being driven by rising mental health awareness, unmet clinical needs, and increasing demand for accessible care options. Several key statistics highlight the urgency and opportunity for AI-powered solutions:
-
Depression Prevalence: As of 2023, approximately 5% of adults globally suffer from depression at any given time, translating to nearly 280 million people, according to WHO.
-
Mental Health Burden in 2024 (AXA Mind Health Index):
-
47% of respondents exhibited symptoms likely indicating depression (up from 44% in 2023).
-
23% showed signs of anxiety (up from 20% in 2023).
-
64% experienced stress-related symptoms (up from 62% in 2023).
-
32% reported ongoing mental health issues (unchanged from 2023).
-
-
AI Chatbot Adoption: A German survey revealed that 27% of adults already confide in AI chatbots or conversational agents for mental health concerns, indicating rising trust and user engagement.
-
Treatment Gap in Mental Healthcare:
-
In low- and middle-income countries, 76–85% of individuals who need mental healthcare receive no treatment.
-
Even in high-income countries, the treatment gap remains between 35–50%.
-
Gaps in mental healthcare access and rising mental health issues are driving adoption of AI-powered platforms offering 24/7, anonymous, and personalized therapy. Growing smartphone and internet use, emotional AI integration, wearable monitoring, supportive regulations, and rising investment in digital therapeutics are accelerating global expansion of AI psychological counseling solutions.
The U.S. AI Psychological Counseling Market size was valued at USD 0.87 billion in 2024 and is expected to reach USD 2.75 billion by 2032, growing at a CAGR of 15.46% over 2025-2032.
The U.S. AI Psychological Counseling Market is growing due to the rising mental health concerns, high digital health adoption, therapist shortages, and strong investment in AI-driven healthcare. Increased demand for scalable, cost-effective, and remote mental health solutions further accelerates market expansion.
AI Psychological Counseling Market Dynamics:
Drivers:
-
Increased Global Demand For Mental Health Support Drives Integration Of AI To Address Therapy Gaps And Scale Accessibility Efficiently.
Growing demand in the world for mental health assistance and awareness is driving AI use to bridge therapy gaps and address staff shortages. High costs and scarcity of specialists are putting pressure on traditional care models. The AI-based counselling platforms that provide the 24/7 available affordable and anonymous support powered by machine learning (personalized CBT, mood monitoring, and virtual agents). Their responsiveness in real-time is essential for underserved areas and times of crisis, and promotes access to mental health care globally.
Youth & Global Mental Health Statistics:
| Metric | Statistic | Region |
|---|---|---|
| Adolescents (11–15 yrs) with problematic social media use | 11% | Europe |
| Adolescents at risk for addictive gaming | 12% | Europe |
| Psychiatrists per 100,000 people (global average) | 0.3 | Global |
| Psychiatrists per 100,000 people | 0.1 | Africa |
| Increase in anxiety and depression due to COVID-19 | 25% | Global |
| Individuals aged 12+ reporting depressive symptoms | 13.10% | United States |
| Adolescents with depressive symptoms | 19.20% | United States |
| Children and adolescents (10–19 yrs) with diagnosed mental health condition | Over 1 in 7 | Global |
Restraints:
-
Lack Of Human Empathy In AI Mental Health Tools Limits Trust, Acceptance, And Long-Term Patient Engagement In Critical Care Scenarios.
People seeking therapy often seek humanity empathy, emotional attunement, and a therapeutic relationship that AI cannot yet create. Artificial intelligence chat bots can be impersonal and unengaging when users are in sensitive situations. Without human intuition, they are prone to misunderstand tone or cultural nuance and providing machine-like replies. This makes them less suitable for high-risk cases or deep interventions. As a result, AI cannot be used in isolation, thus a hybrid care model is more efficient and feasible across a variety of locales
-
-
A recent Stanford University study found that popular AI chatbots frequently fail to demonstrate essential therapeutic qualities like empathy, avoiding stigma, or detecting suicidal ideation sometimes even reinforcing delusions or giving inappropriate responses.
-
Similarly, a comparative study using 150 real patient forum questions showed that while AI chatbots scored higher in perspective-taking and empathic concern, users consistently rated human therapists as more satisfying and effective.
-
Moreover, a TIME investigation revealed that some therapy chatbots, such as Replika and Nomi, provided dangerous, emotionally inappropriate advice to teenagers, including support for self-harm or illicit behaviors in about 30% of interactions.
-
This drawback represents a notable barrier to the broad implementation in, for example, high-risk individuals or people in need of intensive psychological intervention. This means that in most areas, AI alone is not enough, and hybrid care models are attractive.
Opportunities:
-
Collaborations Between AI Developers and Healthcare Institutions Unlock Innovation and Integration Opportunities in Psychological Counseling Ecosystems
Hospitals, clinics, and mental health startups are increasingly interested in integrating AI and that interest has fueled strategic partnerships. Collaborating with AI partners allows co-creation of data-driven solutions for bespoke populations. These collaborations expedite clinical validation, regulatory clearance, and patient confidence by integrating AI directly into telehealth and EMR’s. They also encourage investment in scalable digital counseling models, cross-sector innovation, clinical testing, and ethical global roll-out of AI based mental health therapies.
Key Collaboration Developments (2024–2025):
-
Treatment.com AI & Alea Health (UAE)
-
In January 2025, Treatment.com AI signed a binding letter of intent to acquire Alea Health. The collaboration brings AI-powered voice agents into patient intake and mental health coaching across the Middle East.
-
-
Eleos & U.S. National Council for Mental Wellbeing
-
Eleos formed a Gold Tier partnership with the council; its AI platform, used in 30+ U.S. states, helps reduce documentation time by 70%, double client engagement, and achieve 3–4× better treatment outcomes.
-
-
HHS, SAMHSA & ONC Initiative
-
U.S. federal agencies launched the Behavioral Health Information Technology initiative to standardize data elements for integrating AI into telehealth and EMR systems.
-
-
Therapy Brands (TheraNest) EMR Integration
-
Therapy Brands announced plans to embed AI tools into its EMR platforms under Responsible AI Principles, supporting seamless and ethical adoption of AI in clinical documentation workflows.
-
Challenges:
-
Algorithmic Bias and Limited Cultural Sensitivity in AI Tools Challenge their Global Applicability in Diverse Mental Health Contexts
Algorithmic bias, as well as a lack of cultural sensitivity in AI, are hampering the worldwide potential of AI in mental healthcare. Most of the psychological AI models are trained using limited datasets that do not contain emotional, cultural, and linguistic variations which result biased responses and interpretations. Techniques, such as sentiment analysis often fail to generalize well to non-Western languages or dialects, where their reliability plummets. These limitations have ethical and practical implications, particularly as AI counselling is deployed to an increasingly large and diverse cross-cultural population globally.
-
A 2024 study found that AI models analyzing social media are three times less effective at detecting signs of depression in Black Americans than in White individuals, highlighting a clear bias stemming from non-diverse training data.
-
Furthermore, natural language processing (NLP) models used in psychiatry have been found to embed clinical, linguistic, and data biases, which can widen disparities and reduce effectiveness for non-Western populations.
AI Psychological Counseling Market Segmentation Analysis:
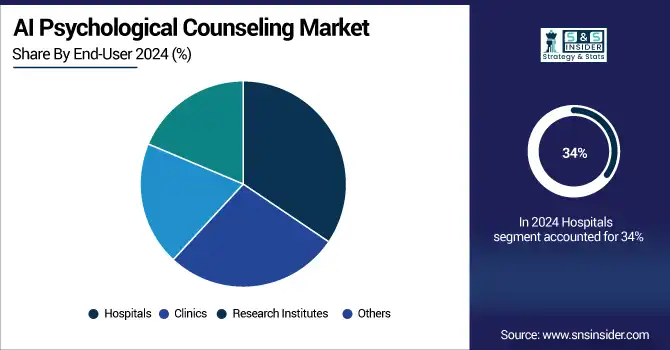
By End-User
Hospitals accounted for the largest revenue share of around 34% in 2024 due to their early integration of AI tools into established psychiatric and psychological care workflows. These institutions benefit from robust funding, skilled professionals, and access to patient data, enabling effective deployment of AI for diagnostics, triage, and therapy augmentation, particularly in inpatient and emergency mental health services where accuracy and oversight are critical.
Clinics are expected to grow at the fastest CAGR of approximately 17.45% over 2025-2032, driven by the rising demand for outpatient mental health services and personalized care. The flexibility of AI integration, combined with lower infrastructure requirements and increased patient traffic in community-based settings, supports rapid adoption. Clinics are increasingly turning to AI to expand capacity, reduce costs, and improve early-stage intervention accessibility for diverse populations.
By Application
Clinical Therapy held the largest revenue share of about 44% in 2024, as AI tools are widely used to support cognitive behavioral therapy, psychotherapy, and diagnostic evaluations. Integration with trained professionals enhances outcomes while maintaining human oversight. Hospitals and licensed therapists favor AI in clinical settings for its ability to track symptoms, personalize sessions, and improve adherence, making it essential in structured mental health treatment programs.
Self-Help Tools are projected to grow at the fastest CAGR of nearly 17.04% during 2025-2032 due to increasing consumer interest in mental wellness, stress management, and anonymous support. These AI-powered mobile apps and platforms offer mood tracking, guided exercises, and conversational support without professional intervention. Their affordability, privacy, and on-demand availability make them especially popular among younger demographics and in underserved regions with limited access to therapists.
By Deployment Mode
Cloud segment led the AI Psychological Counseling Market share of approximately 69% in 2024, and it is also projected to grow at the fastest CAGR of around 16.32% over 2025-2032. This dominance is attributed to the cloud's scalability, ease of deployment, and ability to enable real-time access to AI-powered counseling services across various geographies. Cloud infrastructure supports seamless integration with mobile apps, wearables, and EMR systems while reducing operational costs for healthcare providers. Its flexibility and data-handling efficiency make it the preferred platform for expanding digital mental health solutions globally.
By Component
Software segment captured the largest revenue share of about 63% in 2024 and is anticipated to grow at the fastest CAGR of nearly 16.47% over 2025-2032. The dominance is driven by the increasing demand for AI-enabled mental health applications, chatbots, and therapeutic platforms that deliver personalized user experiences. Continuous software advancements in NLP, sentiment analysis, and cognitive modeling enhance the quality of psychological interactions. Growing adoption across hospitals, clinics, and direct-to-consumer markets further fuels this growth, as users seek accessible, low-cost, and self-guided tools that do not require extensive hardware investment.
AI Psychological Counseling Market Regional Analysis:
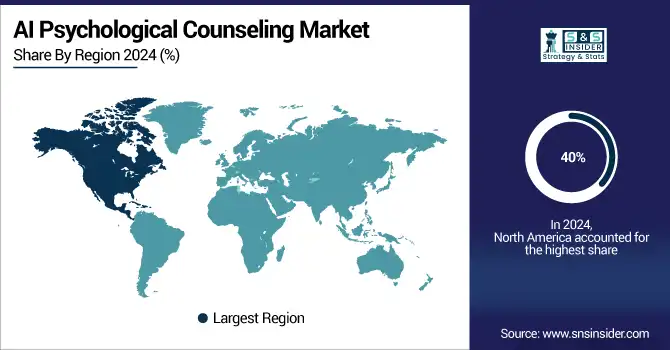
North America
North America accounted for approximately 40% of global AI mental health counseling revenue in 2024, supported by strong healthcare infrastructure, high mental health awareness, and early adoption of AI technologies.
-
In the first half of 2024 alone, North American digital health startups raised USD 9.6 billion, representing 77% of global funding across 414 deals.
-
Telehealth is widely utilized, with approximately 38% of Americans using it for mental health services in early 2024.
-
The U.S. 988 Suicide & Crisis Lifeline, launched in July 2022, further reflects growing digital engagement, having handled over 16.3 million calls, texts, and chats through 2024.
These developments, combined with favorable reimbursement policies and regulatory backing, continue to drive the region’s leadership in AI-based psychological counseling.
The U.S. dominates the AI Psychological Counseling Market due to advanced healthcare infrastructure, high mental health awareness, and strong investment in digital health technologies.
Asia Pacific
Asia Pacific is projected to grow at the fastest CAGR of approximately 17.52% over 2025-2032, driven by expanding smartphone penetration, rising mental health awareness, and strong government initiatives to enhance digital healthcare access. The region’s large, underserved populations and shortage of mental health professionals make AI-powered counseling an essential solution.
-
The Chinese National Health Commission reports 54 million people with depression and 41 million with anxiety, prompting the launch of a national program to ensure every city has outpatient mental services by 2025.
-
A systematic review identified 63 major mental health apps in China, with 78% developed by commercial entities providing services such as counseling, self-assessment, and education.
-
Additionally, a 2025 Guardian report found that young people in Taiwan and China are increasingly turning to AI chatbots including ChatGPT and Ernie Bot for discreet and cost-effective mental health support, especially in the face of stigma and limited traditional access.
Europe
Europe is experiencing growth in the AI Psychological Counseling Market due to increasing mental health awareness, supportive digital health regulations, rising demand for teletherapy, and government initiatives promoting AI-driven healthcare solutions across countries with well-established healthcare and research infrastructures.
-
The EU Artificial Intelligence Act, which came into force on 1 August 2024, enforces strict regulations on high-risk AI systems, including those used in medical and mental health applications, ensuring safe and ethical deployment.
-
Additionally, the EU4Health programme (2021–2027) has allocated USD 5.45 billion to strengthen healthcare resilience, with dedicated investments in mental health initiatives and digital tools.
-
A 2023 Eurobarometer survey reported that 46% of Europeans experienced emotional or psychosocial problems, yet half of them did not seek professional help, highlighting the urgency for accessible AI-enabled counseling solutions across the continent.
Germany dominates the AI Psychological Counseling Market trends in Europe due to its robust healthcare system, strong digital innovation, and early adoption of AI in mental health services.
Get Customized Report as per Your Business Requirement - Enquiry Now
Middle East & Africa and Latin America
The Middle East & Africa and Latin America are witnessing growth in the AI Psychological Counseling Market due to rising mental health awareness, smartphone penetration, limited access to traditional therapy, and increasing adoption of low-cost, scalable AI solutions in underserved and remote communities.
Key Players:
AI Psychological Counseling Market companies are BetterHelp, Talkspace, Ginger, Woebot, ReGain, 7 Cups, iPrevail, Wysa, Youper, Lark Health, Spring Health, Lyra Health, Calmerry, Amwell, and Headspace Health.
Recent Developments:
-
In 2024, Talkspace launched the Behavioral Health Consortium, enabling referrals for specialty care like eating disorders; also co-launched the Women’s Health Coalition with Ovia Health.
-
In 2024, Woebot Health partnered with Virtua Health in New Jersey to integrate "Woebot for Adults" into primary care workflows, offering AI‑based support during appointment wait times.
| Report Attributes | Details |
|---|---|
| Market Size in 2024 | USD 3.05 Billion |
| Market Size by 2032 | USD 9.65 Billion |
| CAGR | CAGR of 15.57% From 2025 to 2032 |
| Base Year | 2024 |
| Forecast Period | 2025-2032 |
| Historical Data | 2021-2023 |
| Report Scope & Coverage | Market Size, Segments Analysis, Competitive Landscape, Regional Analysis, DROC & SWOT Analysis, Forecast Outlook |
| Key Segments | • By Component (Software, Hardware, Services) • By Application (Clinical Therapy, Self-Help Tools, Mental Health Monitoring, Others) • By Deployment Mode (On-Premises, Cloud) • By End-User (Hospitals, Clinics, Research Institutes, Others) |
| Regional Analysis/Coverage | North America (US, Canada, Mexico), Europe (Germany, France, UK, Italy, Spain, Poland, Turkey, Rest of Europe), Asia Pacific (China, India, Japan, South Korea, Singapore, Australia, Rest of Asia Pacific), Middle East & Africa (UAE, Saudi Arabia, Qatar, South Africa, Rest of Middle East & Africa), Latin America (Brazil, Argentina, Rest of Latin America) |
| Company Profiles | BetterHelp, Talkspace, Ginger, Woebot, ReGain, 7 Cups, iPrevail, Wysa, Youper, Lark Health, Spring Health, Lyra Health, Calmerry, Amwell, Headspace Health |
Frequently Asked Questions
Ans: North America dominated the market in 2024, accounting for 40% of the revenue share due to strong digital health infrastructure and early AI adoption.
Ans: The Clinical Therapy segment dominated the market with a 44% share in 2024 due to widespread AI integration in structured treatment programs.
Ans: The market is driven by rising mental health awareness, therapist shortages, and demand for accessible, AI-powered, real-time psychological care solutions.
Ans: In 2024, the AI Psychological Counseling Market was valued at USD 3.05 billion.
Ans: The AI Psychological Counseling Market is expected to grow at a CAGR of 15.57% from 2025 to 2032.
Get in Touch
