Capability Centers Market Report Scope and Overview:
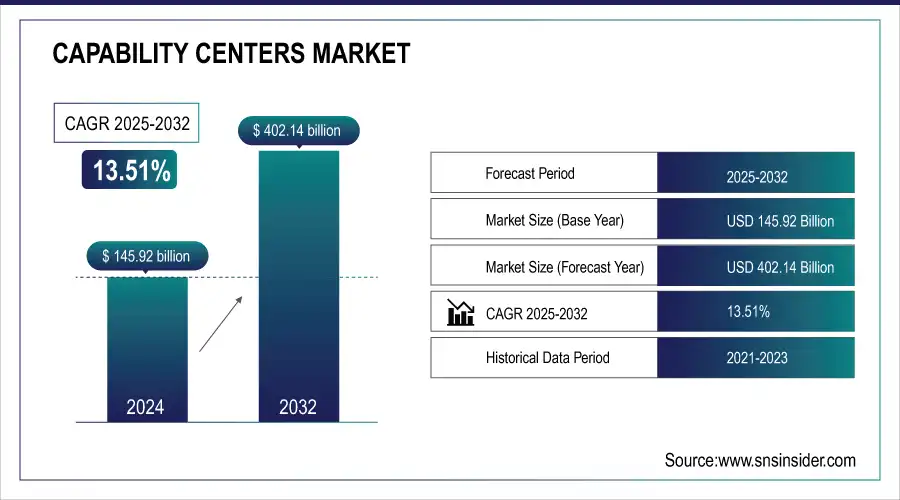
The Capability Centers Market size is projected to reach USD 402.14 billion by 2032 and was valued at USD 145.92 billion in 2024. The estimated CAGR is 13.51% for 2025-2032.
The rising need for cost optimization is the major key driver, where companies can save 30% to 50% with the help of GCCs in strategic locations such as India and Eastern Europe. Another key driver is the intensification of the pursuit of digital transformation; nearly 65% of enterprises use GCCs for more advanced capabilities, such as AI, data analytics, and cloud computing. Increasing the demand for global business services is further emphasized by the fact that 40% of GCCs now support multi-functional services across finance, IT, and human resources. Availability of talent and skills development is also important, as 70% of organizations choose locations based on the skilled labor pool available to enhance operational efficiency. Another critical area which is emphasized upon relates to the impetus of innovation: 55% of GCCs use innovation-driven projects in order to create better products and experience for customers. Cybersecurity and regulatory compliance are emerging as significant demands, with 45% of GCCs contributing to risk management and governance initiatives. These, along with the rising trend toward remote and hybrid working models, are pushing up the potential for GCCs as businesses follow resilient and scalable operational models to stay relevant in a globalized market.

Get More Information on Capability Centers Market - Request Sample Report
Capability Centers Market Size and Forecast:
-
Market Size in 2024: USD 145.92 billion
-
Market Size by 2032: USD 402.14 billion
-
CAGR: 13.51% (2025–2032)
-
Base Year: 2024
-
Forecast Period: 2025–2032
-
Historical Data: 2021–2023
Capability Centers Market Highlights:
-
Nearly 70% of companies choose regions like India and Eastern Europe for GCCs due to strong talent availability.
-
55% of global companies cite GCCs as enablers of business agility and quicker decision-making.
-
Around 40% of companies leverage GCCs for R&D to boost innovation capacity.
-
45% of firms plan to expand GCCs within five years, focusing on customer experience, product development, and cybersecurity.
-
GCCs enable 20% cost reduction and up to 35% improvement in process efficiency through automation and consolidation.
-
Localization of services via GCCs increases customer satisfaction by 30% and customer loyalty by 25%.
-
Challenges include communication gaps (45% companies affected) and cultural differences (35% employees affected), though solutions like cross-border meetings and intercultural training have improved project delivery by 25%.
Availability of talent is another major factor, with nearly 70% of companies opting for regions such as India and Eastern Europe, which have high concentrations of skilled professionals. The need for operational efficiency and process standardization compels companies to rely even more on GCCs as an enabler for centralization and efficiency improvement of business processes. Among the global companies, 55% cite greater business agility along with quicker decision-making functions that involve GCCs. The third significant area for outsourcing is R&D in which 40% of the companies leverage GCCs to enhance innovation capacities. Integration in the GCC is going to experience significant growth within the next five years with 45% of companies expecting to expand their centers in the support of customer experience, product development, and cyber security. All the above indicators are testament to the increasing role of the GCC market within global business ecosystems, opening a wide vista of opportunities for both companies and the centers they set up.
Capability Centers Market Drivers:
-
It help the companies to achieve a stronger presence in local markets, hence service their customers better.
Global Capability Centers, GCCs, become an integral means of supporting the establishment of greater presence for companies in local markets, that is with improved customer service and operational efficiency. Localization of services enables companies to offer services that can best portray and cater for regional needs and, hence, garner customer satisfaction of about 30% higher than other studies have reported from industry surveys. Local solutions of companies directly arrive to understand cultural preferences and the dynamics of the market. It helps in improving customer loyalty by up to 25%.
Also, businesses consolidate back-office operations through GCCs, reducing the overall cost of operations by 20%. This helps in streamlining and automating processes with GCCs, which can involve sophisticated analytics, providing a 35% increase in process efficiency. In addition to these factors, GCCs ensure quicker response time, with a 40% reduction in delivery time of service, and decrease the inconvenience for the customer. Local talent pools also become an attribute to the success of GCCs as more than 60% companies witness an increase in recruitment and retention levels since these centers are attractive for the employees. The strategic use of GCCs in highly competitive markets allows companies to differentiate themselves by offering superior customer engagement and operational effectiveness.
Capability Centers Market Restraints:
-
Rising collaboration between GCC teams and headquarters is challenging because of the differences in geography as well as culture.
GCCs are often situated across different time zones and culture environments. Such a distance from headquarters might compromise the effectiveness of communications, making it challenging to align one's approaches toward the strategic objectives of the parent organization. In fact, in a 2023 study, it has been ascertained that 45% of global companies maintaining GCCs complained about discrepancies between the work done in the various centers and the goals maintained at the head office. A similar percentage of GCC teams were concerned about the channels of clear communication with the head office as 60% of them complained about lags in project implementation due to unclear channels of communication.
Cultural differences also feature predominantly nearly 35% of employees from the GCCs cited difficulty in adapting to the parent company's work culture, affecting overall team synergy. To overcome this, companies have ensured regular cross-border meetings between the two teams by making use of video conferencing tools, which has resulted in improving delivery timelines by 25% for the projects. Among other practices, inter-cultural communications training programs have been quite effective, with positive feedback from GCC employees on team integration increasing by 40%.
Capability Centers Market Segment Analysis:
By Service Type:
Information Technology (IT) services held the largest share, holding approximately 50% market share. As the dependence on digital transformation, cloud computing, and cybersecurity increases for businesses, IT services become inevitable and hence the biggest and most significant sector. As BPM is able to make work processes within an organization more efficient, less costly, and easier to serve customers, it holds the second biggest market share of around 30%. Knowledge Process Outsourcing KPO 20% Market Share KPO provides data analytics, financial research, and legal procedures, which are higher-value services and address more specialized needs of the global markets. Engineering and R&D Services Market Complete with 8% market share. Innovation and product development in sectors such as automotive, healthcare, aerospace require more critical and sensitive work in R&D. The large share of IT services is speaking to the digital shift in business operations across the world, while the large proportion of BPMs speaks again to the increasing requirement for efficiency and outsourcing. KPO being smaller reflects the demand for specialized knowledge and expertise whereas engineering services gave emphasis on innovation in competitive industries.
By Organization Size:
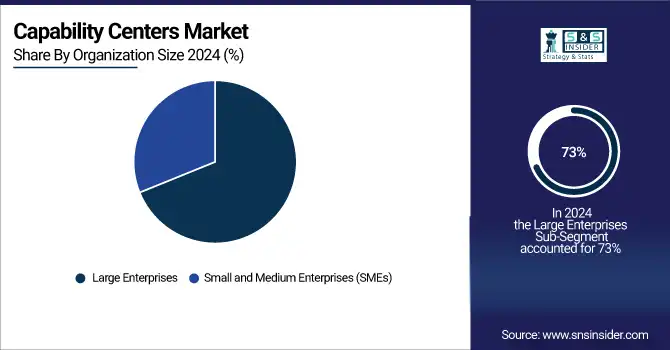
Large Enterprises held 73% of the market share. This dominance can be attributed to their advantage of investing heavily on infrastructure, technology, and talent. Large corporations typically use GCCs for simplifying very complex business processes, managing costs, and centralized functions such as IT, HR, and finance. Primarily large corporations operate cross-border, which demands sophisticated coordination and support that GCCs are well-built for.
On the contrary, in terms of SME, its usage accounted for 36% of the market. Its share is less, but the usage is always on increase in GCCs. Notably, in a macro level, SMEs can gain access to specialized skills, even enhance their efficiency as they trim down many of the operational costs that would have been necessitated by large in-house teams. As digital transformation and cloud services increased in prevalence, the SMES can now join the GCC market because these innovations de-conflate the barriers to entry.

Need any customization research on Capability Centers Market - Enquiry Now
Capability Centers Market Regional Analysis:
Asia-Pacific Capability Centers Market Trends:
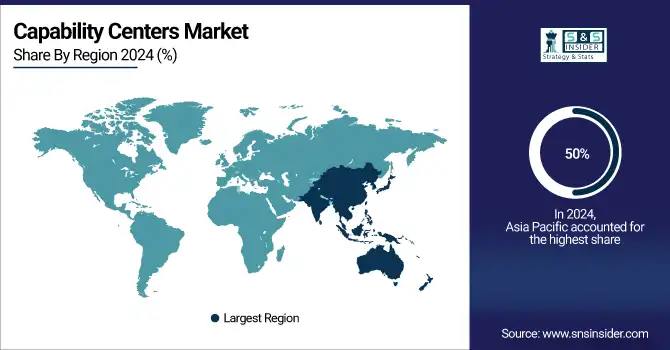
The Asia-Pacific region has been the market leader with a heavy share. India and the Philippines have driven growth in this region, making them important entry points for GCCs. These countries have such a massive share in the market because of low labor costs and a highly skilled workforce; highly favourable government policies have also attracted the largest share to India, which now accounts for nearly 50% of global GCCs. With this imperative, larger American and European companies have been strengthening their number of capability centers in the Asia-Pacific to ride the tide of efficient operations and near-shore strategic proximity to emerging markets.
North America Capability Centers Market Trends:
North America follows suit, in which the portion takes about 18% of the global market. Here, multinationals look forward to eliminating the inefficiencies of operations through GCCs. The demand for emerging advanced technologies like AI, automation, and cloud services highly contribute to the growth of the GCC in the region primarily for innovation and R&D purposes.
Europe Capability Centers Market Trends:
Europe holds around 10% of the market and key countries such as Poland and Ireland become GCC destinations for organizations looking to service the broader European market. Favorable regulatory environments and access to multilingual talent support Europe's growth in this sector.
Latin America & Middle East & Africa Capability Centers Market Trends:
Others include Latin America and Middle East & Africa, making up the remainder 7%. These regions are slowly but surely gaining grounds as emerging GCC hubs as more organizations seek entry into these untapped markets.

Capability Centers Market Key Players
-
Accenture (Digital Transformation Services, Industry-Specific Solutions)
-
Capgemini (Intelligent Automation, Customer Experience Transformation)
-
Cognizant (Cloud and Infrastructure Services, Digital Engineering and Operations)
-
Infosys (AI and Machine Learning, Digital Workplace Solutions)
-
Tata Consultancy Services (TCS) (Business Process Reengineering, Internet of Things (IoT) Solutions)
-
Wipro (Data Analytics and Business Intelligence, Digital Experience Platforms)
-
Genpact (Healthcare Process Outsourcing, Procurement and Supply Chain Management)
-
HCL Technologies (Engineering and R&D Services, Digital Marketing and Commerce Solutions)
-
Mindtree (Digital Transformation Consulting, Product Engineering Services)
-
Tech Mahindra (Network and Security Solutions, Digital Transformation for Telecoms)
-
Neustar (Real-time Communications Solutions, Identity and Security Solutions)
-
Teleperformance (Omnichannel Customer Experience, Language Services)
-
IBM Corporation (Hybrid Cloud Services, AI-Powered Business Solutions)
-
Oracle Corporation (ERP Solutions, Autonomous Database Services)
-
DXC Technology (Cloud Migration Services, IT Modernization)
-
Atos SE (Cybersecurity Services, High-Performance Computing Solutions)
-
SAP SE (Enterprise Software Solutions, Digital Supply Chain Management)
-
NTT Data (IT Infrastructure Management, Business Process Outsourcing)
-
Fujitsu Limited (Quantum-Inspired Computing, IT and Application Services)
-
Deloitte Digital (Customer Strategy, Cloud and AI-Driven Transformation)
Report Attributes | Details |
---|---|
Market Size in 2024 | USD 145.92 billion |
Market Size by 2032 | USD 402.14 Billion |
CAGR | CAGR of 13.51% From 2025 to 2032 |
Base Year | 2024 |
Forecast Period | 2025-2032 |
Historical Data | 2021-2023 |
Report Scope & Coverage | Market Size, Segments Analysis, Competitive Landscape, Regional Analysis, DROC & SWOT Analysis, Forecast Outlook |
Key Segments | • By Service Type: (Information Technology (IT) Services, Business Process Management (BPM), Knowledge Process Outsourcing (KPO), Engineering and R&D Services) • By Industry Vertical: (Banking, Financial Services, and Insurance (BFSI), Healthcare and Life Sciences, Retail and Consumer Goods, Manufacturing and Automotive, Telecom & IT) • By Organization Size: (Large Enterprises, Small and Medium Enterprises (SMEs)) |
Regional Analysis/Coverage | North America (US, Canada, Mexico), Europe (Eastern Europe [Poland, Romania, Hungary, Turkey, Rest of Eastern Europe] Western Europe] Germany, France, UK, Italy, Spain, Netherlands, Switzerland, Austria, Rest of Western Europe]), Asia Pacific (China, India, Japan, South Korea, Vietnam, Singapore, Australia, Rest of Asia Pacific), Middle East & Africa (Middle East [UAE, Egypt, Saudi Arabia, Qatar, Rest of Middle East], Africa [Nigeria, South Africa, Rest of Africa], Latin America (Brazil, Argentina, Colombia, Rest of Latin America) |
Company Profiles | Accenture, Capgemini, Cognizant, Infosys, Tata Consultancy Services (TCS), Wipro, Genpact, HCL Technologies, Mindtree, Tech Mahindra, Neustar, Teleperformance, IBM Corporation, Oracle Corporation, DXC Technology, Atos SE, SAP SE, NTT Data, Fujitsu Limited, Deloitte Digital. |
Table Of Contents
1. Introduction
1.1 Market Definition & Scope
1.2 Research Assumptions & Abbreviations
1.3 Research Methodology
2. Executive Summary
2.1 Market Snapshot
2.2 Market Absolute $ Opportunity Assessment & Y-o-Y Analysis, 2021–2032
2.3 Market Size & Forecast, By Segmentation, 2021–2032
2.3.1 Market Size By Service Type
2.3.2 Market Size By Enterprise Size
2.3.3 Market Size By Organization Size
2.4 Market Share & Bps Analysis By Region, 2024
2.5 Industry Growth Scenarios – Conservative, Likely & Optimistic
2.6 Industry CxO’s Perspective
3. Market Overview
3.1 Market Dynamics
3.1.1 Drivers
3.1.2 Restraints
3.1.3 Opportunities
3.1.4 Key Market Trends
3.2 Industry PESTLE Analysis
3.3 Key Industry Forces (Porter’s) Impacting Market Growth
3.4 Industry Supply Chain Analysis
3.4.1 Raw Material Suppliers
3.4.2 Manufacturers
3.4.3 Distributors/Suppliers
3.4.4 Customers/End-Users
3.5 Industry Life Cycle Assessment
3.6 Parent Market Overview
3.7 Market Risk Assessment
4. Statistical Insights & Trends Reporting
4.1 Establishment & Adoption Metrics
4.1.1 Number of Global Capability Centers (GCCs) Established by Region
4.1.2 Annual Growth Rate of New GCCs (Year-on-Year Trends)
4.1.3 Share of Captive Centers vs. Outsourced Service Centers
4.1.4 Industry-wise Penetration (IT & Telecom, BFSI, Healthcare, Retail, Manufacturing, Others)
4.2 Workforce & Talent Metrics
4.2.1 Average Workforce Size per Capability Center
4.2.2 Skill Set Distribution (IT, Analytics, Engineering, R&D, Finance & Accounting, HR & Operations)
4.2.3 Attrition Rate in Capability Centers vs. Outsourcing Firms
4.2.4 Share of AI/Automation-driven Roles in GCC
4.3 Cost & Efficiency Metrics
4.3.1 Average Cost Savings (%) Achieved Through GCCs vs. Traditional Outsourcing
4.3.2 Operational Expenditure Breakdown (Talent, Infrastructure, Technology)
4.3.3 ROI and Payback Period for New GCC Establishments
4.3.4 Regional Comparison of Labor Cost Differentials
5. Capability Centers Market Segmental Analysis & Forecast, By Service Type, 2021 – 2032, Value (USD Billion)
5.1 Introduction
5.2 Information Technology (IT) Services
5.2.1 Key Trends
5.2.2 Market Size & Forecast, 2021 – 2032
5.3 Business Process Management (BPM)
5.4 Knowledge Process Outsourcing (KPO)
5.5 Engineering and R&D Services
6. Capability Centers Market Segmental Analysis & Forecast, By Enterprise Size, 2021 – 2032, Value (USD Billion)
6.1 Introduction
6.2 Banking, Financial Services, and Insurance (BFSI)
6.2.1 Key Trends
6.2.2 Market Size & Forecast, 2021 – 2032
6.3 Healthcare and Life Sciences
6.4 Retail and Consumer Goods
6.5 Manufacturing and Automotive
6.6 Telecom & IT
7. Capability Centers Market Segmental Analysis & Forecast, By Organization Size, 2021 – 2032, Value (USD Billion)
7.1 Introduction
7.2 Large Enterprises
7.2.1 Key Trends
7.2.2 Market Size & Forecast, 2021 – 2032
7.3 Small and Medium Enterprises (SMEs)
8. Capability Centers Market Segmental Analysis & Forecast By Region, 2021 – 2032, Value (USD Billion)
8.1 Introduction
8.2 North America
8.2.1 Key Trends
8.2.2 Capability Centers Market Size & Forecast, By Service Type, 2021 – 2032
8.2.3 Capability Centers Market Size & Forecast, By Enterprise Size, 2021 – 2032
8.2.4 Capability Centers Market Size & Forecast, By Organization Size, 2021 – 2032
8.2.5 Capability Centers Market Size & Forecast, By Country, 2021 – 2032
8.2.5.1 USA
8.2.5.1.1 Capability Centers Market Size & Forecast, By Service Type, 2021 – 2032
8.2.5.1.2 Capability Centers Market Size & Forecast, By Enterprise Size, 2021 – 2032
8.2.5.1.3 Capability Centers Market Size & Forecast, By Organization Size, 2021 – 2032
8.2.5.2 Canada
8.2.5.2.1 Capability Centers Market Size & Forecast, By Service Type, 2021 – 2032
8.2.5.2.2 Capability Centers Market Size & Forecast, By Enterprise Size, 2021 – 2032
8.2.5.2.3 Capability Centers Market Size & Forecast, By Organization Size, 2021 – 2032
8.3 Europe
8.3.1 Key Trends
8.3.2 Capability Centers Market Size & Forecast, By Service Type, 2021 – 2032
8.3.3 Capability Centers Market Size & Forecast, By Enterprise Size, 2021 – 2032
8.3.4 Capability Centers Market Size & Forecast, By Organization Size, 2021 – 2032
8.3.5 Capability Centers Market Size & Forecast, By Country, 2021 – 2032
8.3.5.1 Germany
8.3.5.1.1 Capability Centers Market Size & Forecast, By Service Type, 2021 – 2032
8.3.5.1.2 Capability Centers Market Size & Forecast, By Enterprise Size, 2021 – 2032
8.3.5.1.3 Capability Centers Market Size & Forecast, By Organization Size, 2021 – 2032
8.3.5.2 UK
8.3.5.2.1 Capability Centers Market Size & Forecast, By Service Type, 2021 – 2032
8.3.5.2.2 Capability Centers Market Size & Forecast, By Enterprise Size, 2021 – 2032
8.3.5.2.3 Capability Centers Market Size & Forecast, By Organization Size, 2021 – 2032
8.3.5.3 France
8.3.5.3.1 Capability Centers Market Size & Forecast, By Service Type, 2021 – 2032
8.3.5.3.2 Capability Centers Market Size & Forecast, By Enterprise Size, 2021 – 2032
8.3.5.3.3 Capability Centers Market Size & Forecast, By Organization Size, 2021 – 2032
8.3.5.4 Italy
8.3.5.4.1 Capability Centers Market Size & Forecast, By Service Type, 2021 – 2032
8.3.5.4.2 Capability Centers Market Size & Forecast, By Enterprise Size, 2021 – 2032
8.3.5.4.3 Capability Centers Market Size & Forecast, By Organization Size, 2021 – 2032
8.3.5.5 Spain
8.3.5.5.1 Capability Centers Market Size & Forecast, By Service Type, 2021 – 2032
8.3.5.5.2 Capability Centers Market Size & Forecast, By Enterprise Size, 2021 – 2032
8.3.5.5.3 Capability Centers Market Size & Forecast, By Organization Size, 2021 – 2032
8.3.5.6 Russia
8.3.5.6.1 Capability Centers Market Size & Forecast, By Service Type, 2021 – 2032
8.3.5.6.2 Capability Centers Market Size & Forecast, By Enterprise Size, 2021 – 2032
8.3.5.6.3 Capability Centers Market Size & Forecast, By Organization Size, 2021 – 2032
8.3.5.7 Poland
8.3.5.7.1 Capability Centers Market Size & Forecast, By Service Type, 2021 – 2032
8.3.5.7.2 Capability Centers Market Size & Forecast, By Enterprise Size, 2021 – 2032
8.3.5.7.3 Capability Centers Market Size & Forecast, By Organization Size, 2021 – 2032
8.3.5.8 Rest of Europe
8.3.5.8.1 Capability Centers Market Size & Forecast, By Service Type, 2021 – 2032
8.3.5.8.2 Capability Centers Market Size & Forecast, By Enterprise Size, 2021 – 2032
8.3.5.8.3 Capability Centers Market Size & Forecast, By Organization Size, 2021 – 2032
8.4 Asia-Pacific
8.4.1 Key Trends
8.4.2 Capability Centers Market Size & Forecast, By Service Type, 2021 – 2032
8.4.3 Capability Centers Market Size & Forecast, By Enterprise Size, 2021 – 2032
8.4.4 Capability Centers Market Size & Forecast, By Organization Size, 2021 – 2032
8.4.5 Capability Centers Market Size & Forecast, By Country, 2021 – 2032
8.4.5.1 China
8.4.5.1.1 Capability Centers Market Size & Forecast, By Service Type, 2021 – 2032
8.4.5.1.2 Capability Centers Market Size & Forecast, By Enterprise Size, 2021 – 2032
8.4.5.1.3 Capability Centers Market Size & Forecast, By Organization Size, 2021 – 2032
8.4.5.2 India
8.4.5.2.1 Capability Centers Market Size & Forecast, By Service Type, 2021 – 2032
8.4.5.2.2 Capability Centers Market Size & Forecast, By Enterprise Size, 2021 – 2032
8.4.5.2.3 Capability Centers Market Size & Forecast, By Organization Size, 2021 – 2032
8.4.5.3 Japan
8.4.5.3.1 Capability Centers Market Size & Forecast, By Service Type, 2021 – 2032
8.4.5.3.2 Capability Centers Market Size & Forecast, By Enterprise Size, 2021 – 2032
8.4.5.3.3 Capability Centers Market Size & Forecast, By Organization Size, 2021 – 2032
8.4.5.4 South Korea
8.4.5.4.1 Capability Centers Market Size & Forecast, By Service Type, 2021 – 2032
8.4.5.4.2 Capability Centers Market Size & Forecast, By Enterprise Size, 2021 – 2032
8.4.5.4.3 Capability Centers Market Size & Forecast, By Organization Size, 2021 – 2032
8.4.5.5 Australia
8.4.5.5.1 Capability Centers Market Size & Forecast, By Service Type, 2021 – 2032
8.4.5.5.2 Capability Centers Market Size & Forecast, By Enterprise Size, 2021 – 2032
8.4.5.5.3 Capability Centers Market Size & Forecast, By Organization Size, 2021 – 2032
8.4.5.6 ASEAN Countries
8.4.5.6.1 Capability Centers Market Size & Forecast, By Service Type, 2021 – 2032
8.4.5.6.2 Capability Centers Market Size & Forecast, By Enterprise Size, 2021 – 2032
8.4.5.6.3 Capability Centers Market Size & Forecast, By Organization Size, 2021 – 2032
8.4.5.7 Rest of Asia-Pacific
8.4.5.7.1 Capability Centers Market Size & Forecast, By Service Type, 2021 – 2032
8.4.5.7.2 Capability Centers Market Size & Forecast, By Enterprise Size, 2021 – 2032
8.4.5.7.3 Capability Centers Market Size & Forecast, By Organization Size, 2021 – 2032
8.5 Latin America
8.5.1 Key Trends
8.5.2 Capability Centers Market Size & Forecast, By Service Type, 2021 – 2032
8.5.3 Capability Centers Market Size & Forecast, By Enterprise Size, 2021 – 2032
8.5.4 Capability Centers Market Size & Forecast, By Organization Size, 2021 – 2032
8.5.5 Capability Centers Market Size & Forecast, By Country, 2021 – 2032
8.5.5.1 Brazil
8.5.5.1.1 Capability Centers Market Size & Forecast, By Service Type, 2021 – 2032
8.5.5.1.2 Capability Centers Market Size & Forecast, By Enterprise Size, 2021 – 2032
8.5.5.1.3 Capability Centers Market Size & Forecast, By Organization Size, 2021 – 2032
8.5.5.2 Argentina
8.5.5.2.1 Capability Centers Market Size & Forecast, By Service Type, 2021 – 2032
8.5.5.2.2 Capability Centers Market Size & Forecast, By Enterprise Size, 2021 – 2032
8.5.5.2.3 Capability Centers Market Size & Forecast, By Organization Size, 2021 – 2032
8.5.5.3 Mexico
8.5.5.3.1 Capability Centers Market Size & Forecast, By Service Type, 2021 – 2032
8.5.5.3.2 Capability Centers Market Size & Forecast, By Enterprise Size, 2021 – 2032
8.5.5.3.3 Capability Centers Market Size & Forecast, By Organization Size, 2021 – 2032
8.5.5.4 Colombia
8.5.5.4.1 Capability Centers Market Size & Forecast, By Service Type, 2021 – 2032
8.5.5.4.2 Capability Centers Market Size & Forecast, By Enterprise Size, 2021 – 2032
8.5.5.4.3 Capability Centers Market Size & Forecast, By Organization Size, 2021 – 2032
8.5.5.5 Rest of Latin America
8.5.5.5.1 Capability Centers Market Size & Forecast, By Service Type, 2021 – 2032
8.5.5.5.2 Capability Centers Market Size & Forecast, By Enterprise Size, 2021 – 2032
8.5.5.5.3 Capability Centers Market Size & Forecast, By Organization Size, 2021 – 2032
8.6 Middle East & Africa
8.6.1 Key Trends
8.6.2 Capability Centers Market Size & Forecast, By Service Type, 2021 – 2032
8.6.3 Capability Centers Market Size & Forecast, By Enterprise Size, 2021 – 2032
8.6.4 Capability Centers Market Size & Forecast, By Organization Size, 2021 – 2032
8.6.5 Capability Centers Market Size & Forecast, By Country, 2021 – 2032
8.6.5.1 UAE
8.6.5.1.1 Capability Centers Market Size & Forecast, By Service Type, 2021 – 2032
8.6.5.1.2 Capability Centers Market Size & Forecast, By Enterprise Size, 2021 – 2032
8.6.5.1.3 Capability Centers Market Size & Forecast, By Organization Size, 2021 – 2032
8.6.5.2 Saudi Arabia
8.6.5.2.1 Capability Centers Market Size & Forecast, By Service Type, 2021 – 2032
8.6.5.2.2 Capability Centers Market Size & Forecast, By Enterprise Size, 2021 – 2032
8.6.5.2.3 Capability Centers Market Size & Forecast, By Organization Size, 2021 – 2032
8.6.5.3 Qatar
8.6.5.3.1 Capability Centers Market Size & Forecast, By Service Type, 2021 – 2032
8.6.5.3.2 Capability Centers Market Size & Forecast, By Enterprise Size, 2021 – 2032
8.6.5.3.3 Capability Centers Market Size & Forecast, By Organization Size, 2021 – 2032
8.6.5.4 Egypt
8.6.5.4.1 Capability Centers Market Size & Forecast, By Service Type, 2021 – 2032
8.6.5.4.2 Capability Centers Market Size & Forecast, By Enterprise Size, 2021 – 2032
8.6.5.4.3 Capability Centers Market Size & Forecast, By Organization Size, 2021 – 2032
8.6.5.5 South Africa
8.6.5.5.1 Capability Centers Market Size & Forecast, By Service Type, 2021 – 2032
8.6.5.5.2 Capability Centers Market Size & Forecast, By Enterprise Size, 2021 – 2032
8.6.5.5.3 Capability Centers Market Size & Forecast, By Organization Size, 2021 – 2032
8.6.5.6 Rest of Middle East & Africa
8.6.5.6.1 Capability Centers Market Size & Forecast, By Service Type, 2021 – 2032
8.6.5.6.2 Capability Centers Market Size & Forecast, By Enterprise Size, 2021 – 2032
8.6.5.6.3 Capability Centers Market Size & Forecast, By Organization Size, 2021 – 2032
9. Competitive Landscape
9.1 Key Players' Positioning
9.2 Competitive Developments
9.2.1 Key Strategies Adopted (%), By Key Players, 2024
9.2.2 Year-Wise Strategies & Development, 2021 – 2032
9.2.3 Number Of Strategies Adopted By Key Players, 2024
9.3 Market Share Analysis, 2024
9.4 Product/Service & Application Benchmarking
9.4.1 Product/Service Specifications & Features By Key Players
9.4.2 Product/Service Heatmap By Key Players
9.4.3 Application Heatmap By Key Players
9.5 Industry Start-Up & Innovation Landscape
9.6 Key Company Profiles
9.6.1 Schneider Electric
9.6.1.1 Company Overview & Snapshot
9.6.1.2 Product/Service Portfolio
9.6.1.3 Key Company Financials
9.6.1.4 SWOT Analysis
9.6.2 Vertiv Group Corp.
9.6.3 Eaton Corporation
9.6.4 Huawei Technologies Co., Ltd.
9.6.5 IBM Corporation
9.6.6 Rittal GmbH & Co. KG
9.6.7 Siemens AG
9.6.8 Delta Electronics, Inc.
9.6.9 Cisco Systems, Inc.
9.6.10 Hewlett Packard Enterprise
9.6.11 ABB Ltd.
9.6.12 Fujitsu Ltd.
9.6.13 Lenovo Group Ltd.
9.6.14 NTT Ltd.
9.6.15 STULZ GmbH
9.6.16 Mitsubishi Electric Corporation
9.6.17 APC by Schneider Electric
9.6.18 Inspur Group Co., Ltd.
9.6.19 NetApp, Inc.
9.6.20 Oracle Corporation
10. Analyst Recommendations
10.1 SNS Insider Opportunity Map
10.2 Industry Low-Hanging Fruit Assessment
10.3 Market Entry & Growth Strategy
10.4 Analyst Viewpoint & Suggestions On Market Growth
11. Assumptions
12. Disclaimer
13. Appendix
13.1 List Of Tables
13.2 List Of Figures
Key Market Segments:
By Service Type:
-
Information Technology (IT) Services
-
Business Process Management (BPM)
-
Knowledge Process Outsourcing (KPO)
-
Engineering and R&D Services
By Industry Vertical:
-
Banking, Financial Services, and Insurance (BFSI)
-
Healthcare and Life Sciences
-
Retail and Consumer Goods:
-
Manufacturing and Automotive
-
Telecom & IT
By Organization Size:
-
Large Enterprises
-
Small and Medium Enterprises (SMEs)
Request for Segment Customization as per your Business Requirement: Segment Customization Request
Regional Coverage:
North America
-
US
-
Canada
-
Mexico
Europe
-
Eastern Europe
-
Poland
-
Romania
-
Hungary
-
Turkey
-
Rest of Eastern Europe
-
-
Western Europe
-
Germany
-
France
-
UK
-
Italy
-
Spain
-
Netherlands
-
Switzerland
-
Austria
-
Rest of Western Europe
-
Asia Pacific
-
China
-
India
-
Japan
-
South Korea
-
Middle East & Africa
Middle East
-
UAE
-
Egypt
-
Saudi Arabia
-
Qatar
-
Rest of Middle East
Africa
-
Nigeria
-
South Africa
-
Rest of Africa
-
Latin America
-
Brazil
-
Argentina
-
Colombia
-
Rest of Latin America
Request for Country Level Research Report: Country Level Customization Request
Available Customization
-
With the given market data, SNS Insider offers customization as per the company’s specific needs. The following customization options are available for the report:
-
Product Analysis
-
Criss-Cross segment analysis (e.g. Product X Application)
-
Product Matrix which gives a detailed comparison of product portfolio of each company
-
Geographic Analysis
-
Additional countries in any of the regions
-
Company Information
-
Detailed analysis and profiling of additional market players (Up to five)
-
Vietnam
-
Singapore
-
Australia
-
Rest of Asia Pacific
An accurate research report requires proper strategizing as well as implementation. There are multiple factors involved in the completion of good and accurate research report and selecting the best methodology to compete the research is the toughest part. Since the research reports we provide play a crucial role in any company’s decision-making process, therefore we at SNS Insider always believe that we should choose the best method which gives us results closer to reality. This allows us to reach at a stage wherein we can provide our clients best and accurate investment to output ratio.
Each report that we prepare takes a timeframe of 350-400 business hours for production. Starting from the selection of titles through a couple of in-depth brain storming session to the final QC process before uploading our titles on our website we dedicate around 350 working hours. The titles are selected based on their current market cap and the foreseen CAGR and growth.
The 5 steps process:
Step 1: Secondary Research:
Secondary Research or Desk Research is as the name suggests is a research process wherein, we collect data through the readily available information. In this process we use various paid and unpaid databases which our team has access to and gather data through the same. This includes examining of listed companies’ annual reports, Journals, SEC filling etc. Apart from this our team has access to various associations across the globe across different industries. Lastly, we have exchange relationships with various university as well as individual libraries.

Step 2: Primary Research
When we talk about primary research, it is a type of study in which the researchers collect relevant data samples directly, rather than relying on previously collected data. This type of research is focused on gaining content specific facts that can be sued to solve specific problems. Since the collected data is fresh and first hand therefore it makes the study more accurate and genuine.
We at SNS Insider have divided Primary Research into 2 parts.
Part 1 wherein we interview the KOLs of major players as well as the upcoming ones across various geographic regions. This allows us to have their view over the market scenario and acts as an important tool to come closer to the accurate market numbers. As many as 45 paid and unpaid primary interviews are taken from both the demand and supply side of the industry to make sure we land at an accurate judgement and analysis of the market.
This step involves the triangulation of data wherein our team analyses the interview transcripts, online survey responses and observation of on filed participants. The below mentioned chart should give a better understanding of the part 1 of the primary interview.

Part 2: In this part of primary research the data collected via secondary research and the part 1 of the primary research is validated with the interviews from individual consultants and subject matter experts.
Consultants are those set of people who have at least 12 years of experience and expertise within the industry whereas Subject Matter Experts are those with at least 15 years of experience behind their back within the same space. The data with the help of two main processes i.e., FGDs (Focused Group Discussions) and IDs (Individual Discussions). This gives us a 3rd party nonbiased primary view of the market scenario making it a more dependable one while collation of the data pointers.
Step 3: Data Bank Validation
Once all the information is collected via primary and secondary sources, we run that information for data validation. At our intelligence centre our research heads track a lot of information related to the market which includes the quarterly reports, the daily stock prices, and other relevant information. Our data bank server gets updated every fortnight and that is how the information which we collected using our primary and secondary information is revalidated in real time.

Step 4: QA/QC Process
After all the data collection and validation our team does a final level of quality check and quality assurance to get rid of any unwanted or undesired mistakes. This might include but not limited to getting rid of the any typos, duplication of numbers or missing of any important information. The people involved in this process include technical content writers, research heads and graphics people. Once this process is completed the title gets uploader on our platform for our clients to read it.
Step 5: Final QC/QA Process:
This is the last process and comes when the client has ordered the study. In this process a final QA/QC is done before the study is emailed to the client. Since we believe in giving our clients a good experience of our research studies, therefore, to make sure that we do not lack at our end in any way humanly possible we do a final round of quality check and then dispatch the study to the client.