Digital Fitness Market Report Scope & Overview:
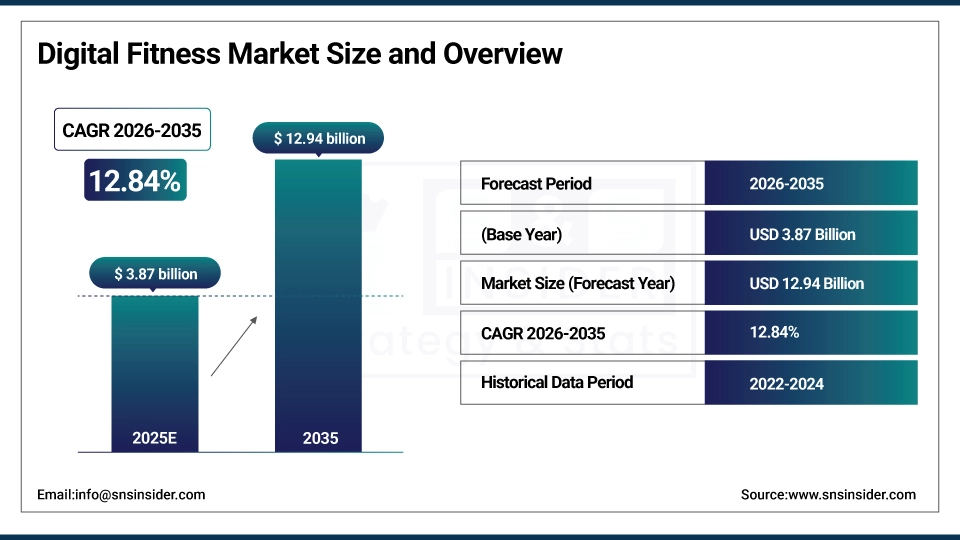
The Digital Fitness Market was valued at USD 3.87 billion in 2025 and is expected to reach USD 12.94 billion by 2035, growing at a CAGR of 12.84% from 2026-2035.
The market is robust, propelled by growing adoption of fitness Apps, wearable technology and managed online training platforms. Changing consumer wellness behavior, including the health consciousness, the demand for personalize fitness solutions, and the integration of artificial intelligence (AI) and connected devices. Firms such as Apple, Peloton, Garmin, and Fitbit already have plenty of demographic penetration and are expanding their portfolios around things like data analytics, virtual classes, and cross-channel integration.
According to the study, the market is experiencing strong growth, reaching 345 million active users in 2024, while total downloads for the year climbed to 850 million.
Digital Fitness Market Size and Forecast
-
Market Size in 2025: USD 3.87 Billion
-
Market Size by 2035: USD 12.94 Billion
-
CAGR: 12.84% from 2026 to 2035
-
Base Year: 2025
-
Forecast Period: 2026–2035
-
Historical Data: 2022–2024
To Get more information on Digital Fitness Market - Request Free Sample Report
Digital Fitness Market Trends
-
Rising health awareness and growing adoption of connected devices are driving the digital fitness market.
-
Increasing use of fitness apps, wearables, and smart equipment is boosting market growth.
-
Expansion across gyms, corporate wellness programs, and home fitness solutions is fueling deployment.
-
Growing focus on personalized workout plans, real-time tracking, and AI-driven coaching is shaping adoption trends.
-
Advancements in AR/VR fitness experiences, gamification, and cloud-based analytics are enhancing user engagement.
-
Rising demand for remote and on-demand fitness solutions is supporting market expansion.
-
Collaborations between technology providers, fitness brands, and healthcare organizations are accelerating innovation and global adoption.
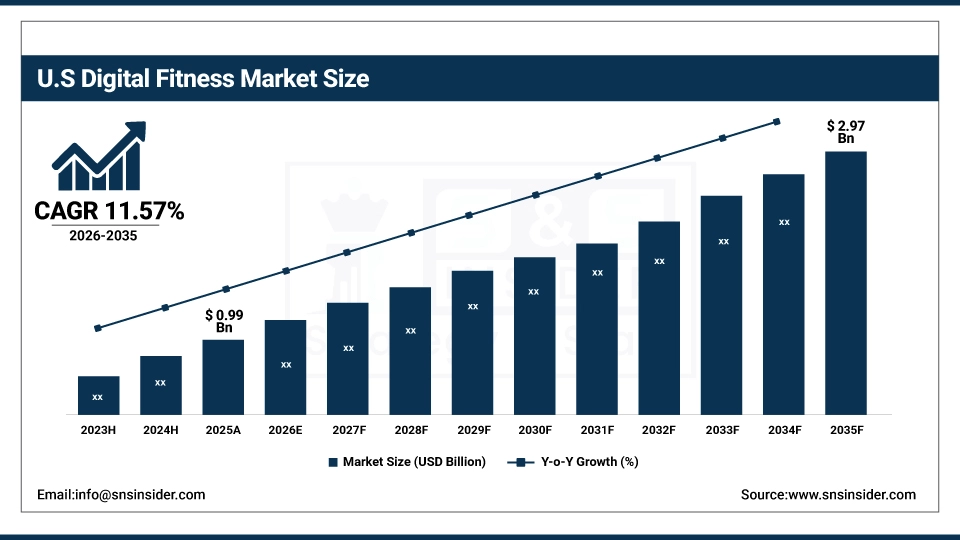
U.S. Digital Fitness Market was valued at USD 0.99 billion in 2025 and is expected to reach USD 2.97 billion by 2035, growing at a CAGR of 11.57% from 2026-2035.
The U.S. Market is driven by the rising health consciousness among individuals, high penetration of smartphones and rising adoption of wearable devices which in turn is creating demand for personal fitness solutions. Fitness apps and Online training platforms are gaining significant traction in terms of adoption owing to consumers seeking for functionality and convenience.
Digital Fitness Market Growth Drivers:
-
Integration of AI-powered virtual coaching accelerates digital fitness personalization, enhancing user motivation and engagement
Hyper personalization and interactivity as a digital fitness experience has always been in demand and with the launch of Apple Work-out Buddy in June 2025, in the form of AI-driven virtual coaching for fitness has put competitiveness on the map for other digital fitness names to follow suit. As a result, real-time motivational feedback by the original voices of trainers, increases engagement and duration of workouts while increasing fitness goal adherence. The evolution tackled a users requirement of having a human-like coach that complemented the strong focus on the convenience and efficacy of digital platforms.
Digital Fitness Market Restraints:
-
Rising concerns over data privacy and security limit user trust, hindering the adoption of digital fitness platforms reliant on sensitive health information
Highly personalized data on health and activity collected and analyzed through digital fitness platforms raises more privacy and security related concerns, causing reluctance among users. This ultimately drives away potential adopters who would otherwise feel more empowered to use fitness apps and wearable integrations as they may be concerned that their data could be breached, or used inappropriately. This loss of trust slows the growth of subscriptions and the ability to personalize with data, leading to decreased consumer engagement and significant under Indexation of the digital fitness market. Thus, privacy fear will remain a key deterrent, without a strong promise of data security and regulatory compliance by the companies.
Digital Fitness Market Opportunities:
-
Demand for holistic wellness and corporate wellness platforms offers an expansion opportunity, as seen with the AI-driven CloudFit introduction
With integrated health solutions combining fitness, nutrition, and mental wellness increasingly favored by organizations and users, the opportunity is vast, as evidenced by the launch of the AI-enabled holistic health app CloudFit in March 2025, celebrating the potential of corporate wellness platforms. This allows digital fitness providers to expand beyond pure activity tracking and offer nutrition, sleep and mental well-being enablement tools targeting employers looking to both cut sickness and increase productivity. This all-encompassing approach at the same time draws in users that seek integrated lifestyle assistance from a single platform, leading to increased adoption and deeper engagement alongside other B2B revenue streams.
Digital Fitness Market Segment Analysis
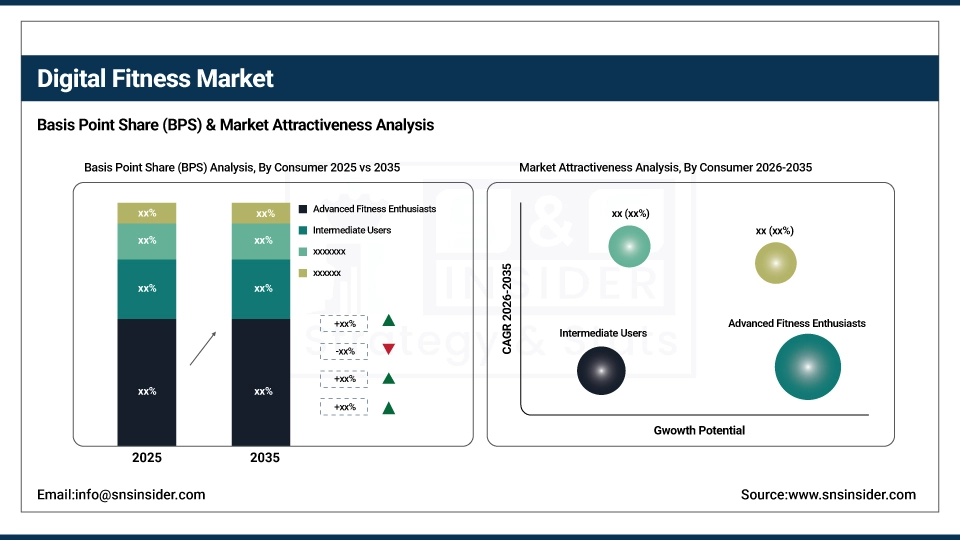
By Consumer
Advanced fitness enthusiasts accounted for the largest 34% revenue share in 2025 as their demand for high-performance wearables, best-in-class applications and connected devices to drive improved advanced analytics and AI-based performance tracking, led companies to enhance their capabilities here. Doing so made them deeper pockets with bigger bottom lines and obviously recurring subscriptions by hiring for the premium and high-end solutions.
Beginner fitness enthusiasts are expanding at the fastest CAGR of 14.12% during the forecast period, is attributed to emerging fitness beginners, as fitness apps opportunities increased, where the entry of users looking for easy to use apps, gamified fitness solution and interactive digital coaching solution, increase. In response, companies developed custom starter programs and hybrid coaching platforms for first-time customers.
By Fitness Goals
The weight loss segment captured the largest 37% revenue share in 2025 owing to a well-heated consumer pursuit of calorie tracking, coupled with integrated nutrition apps and virtual workouts. Increasing health concerns and lifestyle-based problems encouraged users to track their weight and respond with solutions that collectively allowed the user to exercise while also monitoring the diet. Together, these developments established weight loss as the anchor goal in terms of market stability, broadened penetration across demographic groups, and ensured sustained alignment with broader trends in the digital fitness market.
Endurance training is projected to grow at a CAGR of 14.55% during the forecast period owing to increasing participation in cycling, marathons, and high-performance sports which eventually led to the development of dedicated digital platforms. Wearable devices came with real-time monitoring and adaptive training schedules, while users were looking for professional-level guidance. This advancement allowed for a wider reach of digital fitness, among both athletes and cardio enthusiasts.
By Product
Fitness apps dominated with a 47% revenue share in 2025 as affordability, accessibility, and tailored features allowed for mass adoption. AI trainers, gamified challenges and health integrations drove continuous interaction and subscription retention. App became the backbone of the digital fitness, and companies started growing primarily as app development companies. Fastest growing segments are the key platform components that are driving the industry, and ensuring countless growth in global digital fitness market.
Online classes and programs are forecasted to grow at the fastest CAGR of 15.61% as demand for flexibility, instructor-led sessions, & community-based workouts increased. Live stream, hybrid class and interactive group formats encouraged greater participation and retention, not to mention the expansion of offerings companies made. This product category established a social ecosystem that reinforces apps & wearables, and enhances user satisfaction. Widespread adoption of online programs improves access, making digital fitness a service that is woven into people’s lifestyles, enabling prolonged growth.
By Age Demographics
Gen Z held the largest 33% revenue share in 2025 as this age group adopted mobile-first platforms, gamification, and social integration into workouts. Interactive features and active user engagement prompted companies to deliver sassy, presence-enhanced, haptic experiences. With Gen Z continuing to participate, we saw innovations based on fitness, entertainment, and community building.
Millennials are growing at the fastest CAGR of 13.93% during the forecast period, due to the increasing demand for a convenient and time-saving mode of fitness because of the busy schedule to juggle family, work, and wellness. Organizations created tech like AI-based coaching, wearable integrations and hybrid wellness platforms to cater to this lifestyle-driven demand. Its rapid growth underpinned sustainable adoption in work and home, and supported by large userbases among enterprises. Millennials played a significant role in bringing digital fitness to more stages of life and promising long-term growth to the industry.
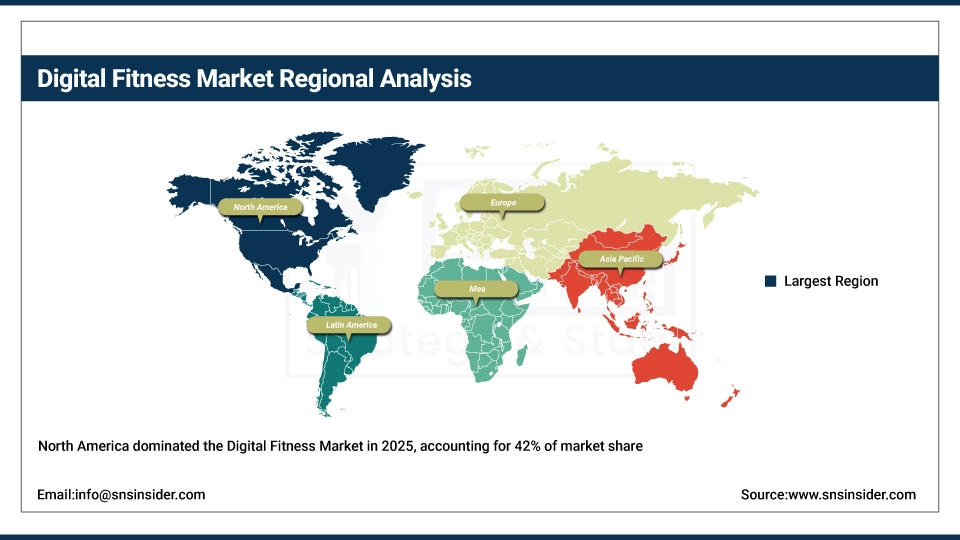
Digital Fitness Market Regional Analysis
North America Digital Fitness Market Insights
North America Dominating Region in 2025 with an Estimated Market Share 42%. superior technological infrastructure, increased wearable penetration, and mature application ecosystems that resulted into effective consumer engagement and loyal consumer base. The United States claimed the top spot in North America by adopting smartwatches, fitness apps, and online classes faster than anyone else. The well-known global leaders like Apple, Peloton, Fitbit not only strengthen the presence ratio but it also elevates the accessibility and product innovation being backed due to a high consumer spending power.
Get Customized Report as per Your Business Requirement - Enquiry Now
Asia Pacific Digital Fitness Market Insights
Asia Pacific Fastest the fastest-growing region in 2025 with an estimated CAGR of 14.81%. Expanding smartphone penetration, increasing health awareness & affordable digital platforms helped the Asia Pacific to evolve rapidly and provide ample new expansion opportunities. The Asia Pacific includes China, which due to its massive population base, increasing middle class incomes and growing emphasis on preventive care, helped to dominate this region. Large-scale adoption was driven by government-led initiatives on health and fitness, coupled with growing acceptance of local apps and smart devices.
Europe Digital Fitness Market Insights
Europe represented a significant share of the global digital fitness market in 2025. This led to wider technology, continuous innovation and higher demand for hybrid wellness platforms, as well as advanced forms of wearable integrations across European nations. Which will be supplemented by the adoption of fitness wearables, app-based programs and hybrid online training models. United Kingdom: The UK has emerged the leading country on the back of strong digital infrastructure, high interest for wellness solution from consumer perspective and substantial investments in connected health platforms in this region.
Middle East & Africa and Latin America Digital Fitness Market Insights
In 2025, the digital fitness market was stable in the Middle east & Africa, supported by urbanization, availability of smartphones, and increasing awareness of lifestyle health problems. Latin America too posted encouraging numbers as smartphone penetration rates and an interest in fitness among younger consumers propelled fitness segment growth.
Digital Fitness Market Competitive Landscape:
Apple Inc.
Apple Inc. is an American multinational technology company specializing in consumer electronics, software, and services class. Apple Fitness+ works with iPhone, iPad, Apple Watch, and Apple TV to provide guided workouts, meditation and personalized coaching. And in turn, Apple places a premium on seamless integration with its own devices, 4K content quality, music as the driving force, global access to the health-conscious, and vice versa. Apple Fitness+ uses a combination of wearable health metrics, analytics, and multidimensional content to help users track progress and performance and maintain comprehensive wellness practices globally.
-
2025: Apple Fitness+ unveils expanded workouts, meditation, yoga, progressive strength programs, Artist Spotlight series, and Strava integration for richer 4K fitness content and tracking.
-
2025: Apple Fitness+ expands to 28 new markets with dubbed workouts, K‑Pop music, custom plans, and broader device integration across iPhone, iPad, Apple TV, and Watch.
Peloton Interactive, Inc.
Peloton Interactive offers connected fitness products along with a diverse range of digital workout content and an interactive training platform. We have an ecosystem now across a stationary bike, a treadmill and even app-based content that will have real-time coaching and AI-powered personalization. Peloton uses analytics, building communities, & varied content to up performance & motivation. AI personalization, cross-training programs, and community features collectively enable Peloton to enhance its competitive position in connected fitness, providing users the opportunity to complete fitness goals while receiving immersive, interactive, and data-driven exercise experiences.
-
2025: Peloton launches Peloton IQ AI personalization and Cross Training Series, providing advanced coaching, expanded content, and upgraded connected fitness experiences for users.
Samsung Electronics Co., Ltd.
Samsung Electronics makes consumer electronics, mobile devices and wearables as well as digital health solutions. These include fitness tracking, health monitoring, and personalized workout programs, as seen in most samsung health and Galaxy wearable device. Integration of third-party fitness content and health analytics allows Samsung to provide enhanced user engagement as well as better wellness results. Those three pillars include hardware, software, as well as content partners to create an immersive experience of the product.
-
2025: Samsung partners with iFit to bring video workout content to Samsung Health and Galaxy Watch users, including six‑month trial access with select device purchases.
Key Players
Some of the Digital Fitness Market Companies
-
Apple Inc.
-
Peloton Interactive, Inc.
-
Garmin Ltd.
-
Fitbit (Google)
-
Samsung Electronics Co., Ltd.
-
Nike, Inc.
-
Adidas AG (Runtastic)
-
Under Armour, Inc.
-
Technogym S.p.A.
-
Tonal Systems, Inc.
-
Zwift Inc.
-
Whoop, Inc.
-
Echelon Fitness Multimedia LLC
-
Mirror (Lululemon Athletica)
-
Les Mills International Ltd.
-
MyFitnessPal, Inc.
-
Strava, Inc.
-
iFIT Health & Fitness Inc.
-
FitOn
-
Freeletics
| Report Attributes | Details |
|---|---|
| Market Size in 2025 | USD 3.87 Billion |
| Market Size by 2035 | USD 12.94 Billion |
| CAGR | CAGR of 12.84% From 2026 to 2035 |
| Base Year | 2025 |
| Forecast Period | 2026-2035 |
| Historical Data | 2022-2024 |
| Report Scope & Coverage | Market Size, Segments Analysis, Competitive Landscape, Regional Analysis, DROC & SWOT Analysis, Forecast Outlook |
| Key Segments | • By Consumer Type (Beginner Fitness Enthusiasts, Intermediate Users, Advanced Fitness Enthusiasts, Special Needs Populations [e.g., seniors, rehabilitation], Occasional Users) • By Fitness Goal (Weight Loss, Muscle Building, Endurance Training, Flexibility & Mobility Improvement, Overall Wellness & Health Maintenance) • By Product Type (Fitness Apps, Wearable Technology, Online Classes & Programs) • By Age Demographics (Gen Z [18–24 years], Millennials [25–40 years], Gen X [41–56 years], Baby Boomers [57–75 years], Seniors [76+ years]) |
| Regional Analysis/Coverage | North America (US, Canada), Europe (Germany, UK, France, Italy, Spain, Russia, Poland, Rest of Europe), Asia Pacific (China, India, Japan, South Korea, Australia, ASEAN Countries, Rest of Asia Pacific), Middle East & Africa (UAE, Saudi Arabia, Qatar, South Africa, Rest of Middle East & Africa), Latin America (Brazil, Argentina, Mexico, Colombia, Rest of Latin America). |
| Company Profiles | Apple Inc., Peloton Interactive, Inc., Garmin Ltd., Fitbit (Google), Samsung Electronics Co., Ltd., Nike, Inc., Adidas AG (Runtastic), Under Armour, Inc., Technogym S.p.A., Tonal Systems, Inc., Zwift Inc., Whoop, Inc., Echelon Fitness Multimedia LLC, Mirror (Lululemon Athletica), Les Mills International Ltd., MyFitnessPal, Inc., Strava, Inc., iFIT Health & Fitness Inc., FitOn, Freeletics, and Others. |
Frequently Asked Questions
North America dominated the Digital Fitness Market in 2025.
The Advanced Fitness Enthusiasts segment dominated the Digital Fitness Market.
The major growth factor of the Digital Fitness Market is the rising adoption of fitness apps, wearables, and online training platforms.
The Digital Fitness Market was valued at USD 3.87 billion in 2025 and is expected to reach USD 12.94 billion by 2035.
The Digital Fitness Market is expected to grow at a CAGR of 12.84% from 2026-2035.
Get in Touch
