Capacitive Sensor Market Size Analysis:
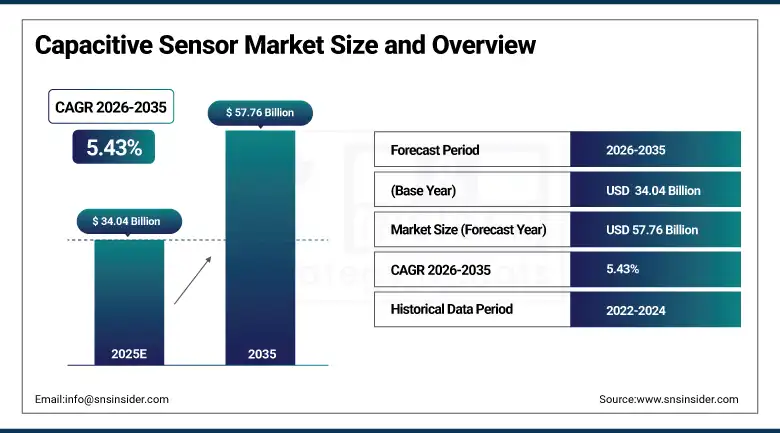
The Capacitive Sensor Market Size is valued at USD 34.04 Billion in 2025E and is projected to reach USD 57.76 Billion by 2035, growing at a CAGR of 5.43% during 2026–2035.
The Capacitive Sensor Market analysis report gives a thorough review of end-use integration across several industries, industrial adoption trends, operational principles, and sensor technologies. Capacitive sensors enable extremely sensitive, contactless, and dependable sensing systems by detecting changes in capacitance brought on by human touch or object proximity. Over the course of the forecast period, the market is anticipated to increase due to rising demand for touch-based interfaces, industrial automation, safety systems, and smart devices.
Capacitive sensors are expected to be integrated into over 18.5 billion electronic and industrial devices by 2025, driven by expanding consumer electronics production, automotive electrification, medical device miniaturization, and Industry 4.0 adoption.
Capacitive Sensor Market Size and Growth Projection:
-
Market Size in 2025: USD 34.04 Billion
-
Market Size by 2035: USD 57.76 Billion
-
CAGR: 5.43 % from 2026 to 2035
-
Base Year: 2025
-
Forecast Period: 2026–2035
-
Historical Data: 2022–2024
To Get more information on Capacitive Sensor Market - Request Free Sample Report
Capacitive Sensor Market Trends:
-
Adoption of touch-based HMI is driving capacitive sensor use, with over 70% of smartphones and wearables using capacitive interfaces.
-
Growth of gesture recognition and proximity sensing is increasing demand in automotive and consumer electronics, growing at 12–15% annually.
-
Focus on miniaturization and low power is boosting ultra-thin sensors, cutting energy use by 20–30% in portable devices.
-
Expansion of industrial automation is raising adoption of capacitive proximity and position sensors, improving precision by 25%+.
-
Integration with AI and edge processing is enhancing sensing accuracy and responsiveness by 15–20%.
-
Demand for hygienic, contactless interfaces is accelerating the shift from mechanical switches, with capacitive sensors used in over 60% of new healthcare and food processing systems.
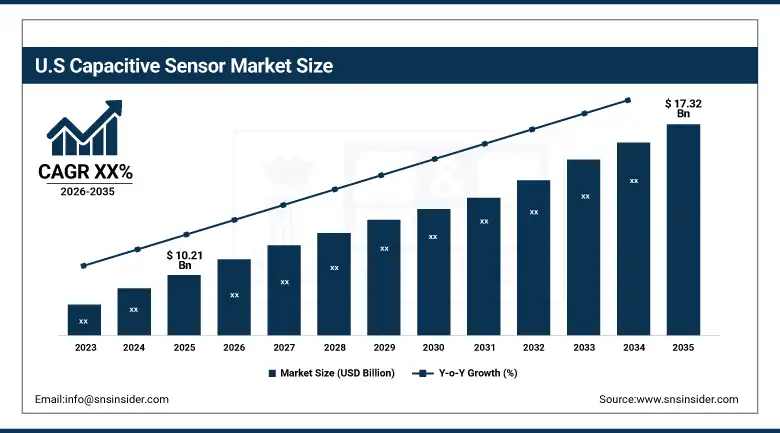
U.S. Capacitive Sensor Market Outlook:
The U.S. Capacitive Sensor Market size is projected to grow from USD 10.21 Billion in 2025E to reach USD 17.32 Billion by 2035. Strong demand for industrial automation systems, electric cars, medical equipment, and sophisticated consumer electronics is fueling growth. The nation's adoption of high-performance capacitive touch, motion, and position sensors is accelerating due to rising investments in smart manufacturing, aircraft electronics, and healthcare technology.
Capacitive Sensor Market Growth Drivers:
-
Rising Demand for Touch-Based Interfaces and Smart Devices Drive Adoption Globally
One major factor propelling the growth of the capacitive sensor market is the rising need for touch-enabled interfaces. Capacitive touch sensors are becoming more and more important for simple user engagement in smartphones, tablets, wearables, computers, and smart home appliances. In 2025, capacitive touch technology was integrated into over 6.3 billion smartphones and tablets, indicating its almost widespread use in consumer electronics. Because they are more responsive, durable, and multi-touch capable than resistive sensors, capacitive sensors are crucial to the design of contemporary devices.
Additionally, the use of capacitive sensors in automobiles is growing due to the development of digital dashboards, HMI panels, and car infotainment systems. Long-term demand is also supported by the shift to software-defined cars and touch-based cockpit controls.
Capacitive sensor shipments for consumer electronics are projected to grow by over 10% annually through 2027, driven by device upgrades and feature-rich interfaces.
Capacitive Sensor Market Restraints:
-
Performance Sensitivity and Environmental Interference Challenges May Hamper Growth Globally
The capacitive sensors market is significantly constrained by environmental sensitivity and signal interference. Temperature fluctuations, humidity, electromagnetic interference, and contamination can all damage capacitive sensors, potentially affecting their accuracy and dependability in challenging industrial settings. The complexity and cost of the system are increased when sensors are designed with proper shielding, calibration, and correction.
Deploying capacitive sensors in applications that call for thick gloves, high moisture exposure, or metallic environments also presents integration issues. Despite overall market growth, these restrictions may limit acceptance in specific oil and gas, outdoor industrial, and heavy machinery applications, limiting penetration.
Capacitive Sensor Market Opportunities:
-
Expansion of Automotive Electrification and Advanced Driver Systems Create Growth Opportunities Globally
The market for capacitive sensors has a lot of potential due to the increasing use of advanced driver assistance systems (ADAS) and electric cars (EVs). Steering wheels, door handles, driver monitoring systems, seat occupancy detection, and proximity-based safety measures are all using more and more capacitive sensors.
By 2025, capacitive sensing will be included into more than 58% of new passenger cars for safety and interior control purposes. The need for dependable, low-latency, and non-contact sensing technologies will only grow as cars move toward connected and autonomous platforms.
Capacitive sensors in automotive applications are expected to account for over 22% of total market demand by 2035.
Capacitive Sensor Market Segmentation Analysis:
-
By Type, Touch Sensors held the largest market share of 46.28% in 2025, while Motion Sensors are expected to grow at the fastest CAGR of 9.34% during 2026–2035.
-
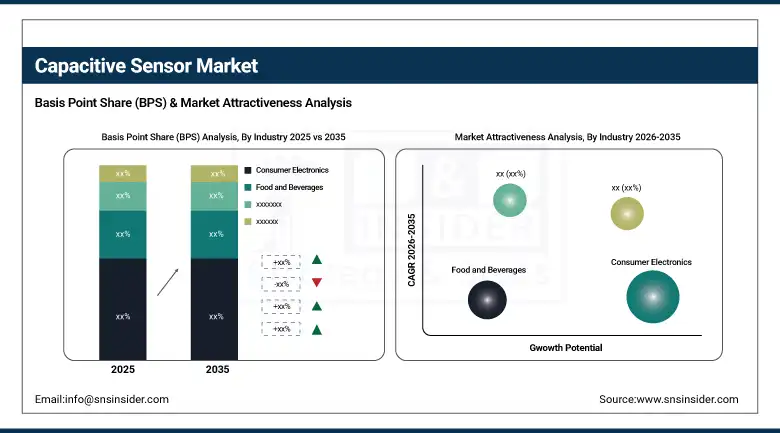
By Industry, Consumer Electronics dominated with a 38.96% share in 2025, while Automotive is projected to expand at the fastest CAGR of 9.12% during the forecast period.
By Type, Touch Sensors Dominate While Motion Sensors Expand Rapidly
Touch sensors dominated the market owing to the large deployment in smartphones, tablets, kiosks, appliances, and industrial control panels. Over 11 billion capacitive touch sensors were deployed globally in 2025, supporting multi-touch functionality, durability, and low maintenance.
Motion sensors are the fastest-growing segment, driven by increasing adoption in gesture recognition, proximity detection, and contactless control systems. In 2025, more than 2.8 billion devices incorporated capacitive motion sensing, reflecting rising demand for intuitive, hygienic, and smart user interfaces across automotive and consumer applications.
Position sensors maintain steady growth, especially in the industrial automation and manufacturing equipment, where precise non-contact measurement improves reliability and reduces mechanical wear.
By Industry, Consumer Electronics Dominate While Automotive Expands Rapidly
Consumer electronics dominated the market due to massive production volumes of smartphones, wearables, laptops, and smart home devices. Capacitive sensors are integral to touchscreens, buttons, sliders, and proximity sensing, with adoption exceeding 95% penetration in premium consumer devices.
Automotive is the fastest-growing industry segment, fueled by digital cockpit adoption, EV production, and safety regulation enhancements. Over 420 million vehicles globally utilized capacitive sensing technologies, highlighting strong growth potential by 2025.
Healthcare adoption is expanding steadily, driven by medical device miniaturization, wearable health monitors, and hygienic touchless controls. Manufacturing, aerospace & defense, food & beverages, and oil & gas sectors continue adopting capacitive sensors for durability, reliability, and precision monitoring.
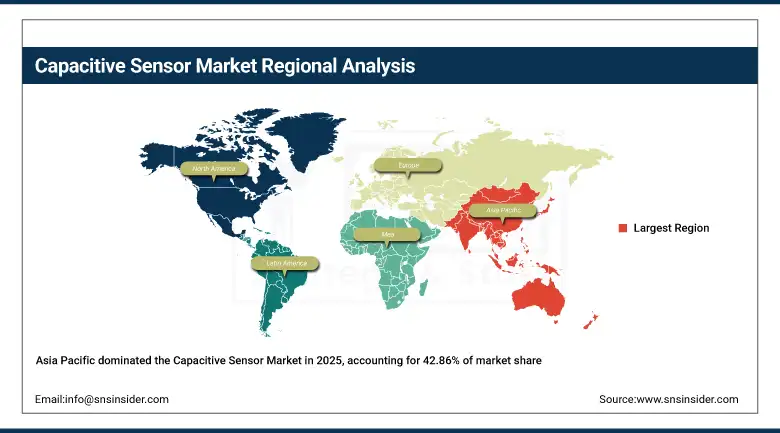
Asia Pacific Capacitive Sensor Market Insights:
Asia Pacific dominated the Capacitive Sensor Market, holding 42.86% market share in 2025. Large-scale semiconductor fabrication, automobile manufacturing, and electronics manufacturing in China, Japan, South Korea, and Taiwan are the main drivers of growth. Asia-Pacific is positioned as the global center for capacitive sensor production and adoption due to robust regional supply chains, high consumer electronics output, and ongoing sensor innovation and shrinking.
Get Customized Report as per Your Business Requirement - Enquiry Now
China Capacitive Sensor Market Insights:
China is the largest contributor in Asia Pacific, accounting for over 34% of global capacitive sensor production in 2025. Rapid EV adoption, growing expenditures in industrial automation, and widespread consumer electronics manufacturing all contribute to market expansion. Touch, motion, and position capacitive sensors are still in high demand due to domestic semiconductor capacity expansion and smart manufacturing initiatives.
North America Capacitive Sensor Market Insights:
North America is the fastest-growing regional market, projected to expand at a CAGR of 9.18% during the forecast period. Advanced automotive electronics, aircraft systems, medical gadgets, and industrial automation usage in the U.S. and Canada all contribute to growth. Regional demand is further accelerated by the growing integration of capacitive sensing technologies in smart medical gadgets and electric vehicles.
U.S. Capacitive Sensor Market Insights:
The U.S. dominates the North American market, contributing approximately 71% of regional revenue. Growth is driven by strong R&D activity, high penetration of smart devices, and leadership in automotive electronics and medical technology. Integration of capacitive sensors into EV platforms, industrial automation systems, and next-generation human–machine interfaces support sustained market expansion.
Europe Capacitive Sensor Market Insights:
Europe’s Capacitive Sensor Market growth is supported by automotive manufacturing, industrial automation, and aerospace electronics demand. Strong safety laws, increased EV production, and the use of innovative manufacturing technology have made Germany, France, the U.K., and Italy major contributors. Stable regional expansion is supported by the growing usage of capacitive sensors in HMI and safety systems.
Germany Capacitive Sensor Market Insights:
Germany plays a critical role in Europe, accounting for nearly 29% of regional demand. The market is expanding due to the dominance of the automotive industry, the adoption of Industry 4.0, and the extensive use of capacitive sensors in automation systems, industrial machinery, and car interiors. Germany's regional significance is further reinforced by its robust OEM presence and emphasis on precision manufacturing.
Latin America Capacitive Sensor Market Insights:
Latin America is witnessing steady market growth, backed by growing consumer electronics demand, growing automobile assembly processes, and a slow deployment of industrial automation. Leading contributors are Brazil and Mexico, who gain from programs for infrastructural development and manufacturing localization.
Brazil Capacitive Sensor Market Insights:
Brazil represents the largest market in Latin America, accounting for approximately 36% of regional demand. Manufacturing of industrial equipment, automobiles, and the growing use of automation technology are the main drivers of growth. Continued market expansion is supported by the growing integration of capacitive sensors in consumer appliances, industrial panels, and vehicle controls.
Middle East & Africa Capacitive Sensor Market Insights:
The Middle East & Africa market is expanding gradually, driven by industrial automation, oil & gas monitoring, and infrastructure modernization initiatives. Increasing adoption of smart industrial systems and digital control interfaces is supporting demand for capacitive sensing solutions across the region.
Saudi Arabia Capacitive Sensor Market Insights:
Saudi Arabia leads the MEA region, contributing nearly 31% of regional market revenue. Vision 2030 industrial diversification, smart infrastructure initiatives, and automation use in the manufacturing and oil and gas industries all contribute to growth. Growing use of capacitive sensors in industrial monitoring and control systems boosts market expansion.
Capacitive Sensor Market Competitive Landscape:
Honeywell International Inc., is a world leader in industrial sensing, automation, and control technologies, having been founded in 1906 and having its headquarters in Charlotte, North Carolina. Honeywell provides durable touch, proximity, and position sensors in the capacitive sensor market that are intended for demanding and mission-critical settings, such as industrial automation, oil and gas, and aerospace. Market leadership is reinforced by its robust R&D capabilities and industrial-grade dependability.
-
In 2023, Honeywell expanded its industrial sensor portfolio with enhanced capacitive sensing solutions optimized for smart factories and connected industrial systems.
Infineon Technologies AG, based in Germany and established in 1999, is a leading provider of capacitive sensing integrated circuits for use in consumer, industrial, and automotive electronics. In order to enable widespread deployment across high-volume sectors, such as EVs and smart devices, the company focuses on low-power architectures, automotive-grade qualification, and high system integration.
-
In 2023, Infineon introduced next-generation capacitive sensing ICs with improved noise immunity and ultra-low power consumption for automotive and IoT platforms.
STMicroelectronics, based in Switzerland and founded in 1987, is a leading supplier of motion sensing devices, proximity sensors, and capacitive touch controllers. Strong market penetration in consumer electronics, automotive, and industrial sectors helps the company promote the broad use of capacitive interfaces in smart gadgets and automobiles.
-
In 2023, STMicroelectronics enhanced its capacitive touch and sensing portfolio with integrated solutions for automotive HMIs and advanced consumer electronics.
Analog Devices Inc., based in Wilmington, Massachusetts, and established in 1965, focuses on providing high-precision capacitive sensing systems for instrumentation, industrial, aerospace, and medical applications. In order to provide dependable performance in difficult conditions, the company places a strong emphasis on signal integrity, measurement precision, and system-level integration.
-
In 2023, Analog Devices expanded its precision sensing platform with advanced capacitive measurement solutions targeting industrial automation and medical device applications.
Capacitive Sensor Companies are:
-
Honeywell International Inc.
-
SICK AG
-
TE Connectivity
-
MTS Systems
-
Vishay Intertechnology, Inc.
-
Infineon Technologies AG
-
STMicroelectronics
-
Bourns
-
Synaptics Incorporated
-
Apple Inc.
-
Egis Technology
-
Analog Devices Inc.
-
Somalytics Inc.
-
Cypress Semiconductor
-
Texas Instruments
-
Murata Manufacturing
-
Panasonic Corporation
-
NXP Semiconductors
| Report Attributes | Details |
|---|---|
| Market Size in 2025E | USD 34.04 Billion |
| Market Size by 2035 | USD 57.76 Billion |
| CAGR | CAGR of 5.43% From 2026 to 2035 |
| Base Year | 2025E |
| Forecast Period | 2026-2035 |
| Historical Data | 2022-2024 |
| Report Scope & Coverage | Market Size, Segments Analysis, Competitive Landscape, Regional Analysis, DROC & SWOT Analysis, Forecast Outlook |
| Key Segments | • By Type (Touch Sensor, Motion Sensor, Position Sensor) • By Industry (Healthcare, Aerospace and Defense, Automotive, Consumer Electronics , Food and Beverages, Oil and Gas, Manufacturing) |
| Regional Analysis/Coverage | North America (US, Canada), Europe (Germany, UK, France, Italy, Spain, Russia, Poland, Rest of Europe), Asia Pacific (China, India, Japan, South Korea, Australia, ASEAN Countries, Rest of Asia Pacific), Middle East & Africa (UAE, Saudi Arabia, Qatar, South Africa, Rest of Middle East & Africa), Latin America (Brazil, Argentina, Mexico, Colombia, Rest of Latin America). |
| Company Profiles | Honeywell International Inc., SICK AG, ams OSRAM AG, TE Connectivity, MTS Systems, Vishay Intertechnology, Inc., Infineon Technologies AG, STMicroelectronics, Bourns, Allegro Microsystems, Synaptics Incorporated, Apple Inc., Egis Technology, Analog Devices Inc., Somalytics Inc., Cypress Semiconductor, Texas Instruments, Murata Manufacturing, Panasonic Corporation, NXP Semiconductors. |
Frequently Asked Questions
Asia Pacific is to hold the largest market share in the Capacitive Sensor market during the forecast period.
The Touch Sensor Segment is leading in the market revenue share in 2025.
North America region is anticipated to record the Fastest Growing in the Capacitive Sensor market.
The Capacitive Sensor Market Size is valued at USD 34.04 Billion in 2025E and is projected to reach USD 57.76 Billion by 2035, at a CAGR of 5.43% during 2026–2035.
Capacitive sensors power user-friendly interfaces and secure authentication in the Touch Revolution.
Get in Touch
