Carbon Capture and Storage Market Report Scope and Overview:
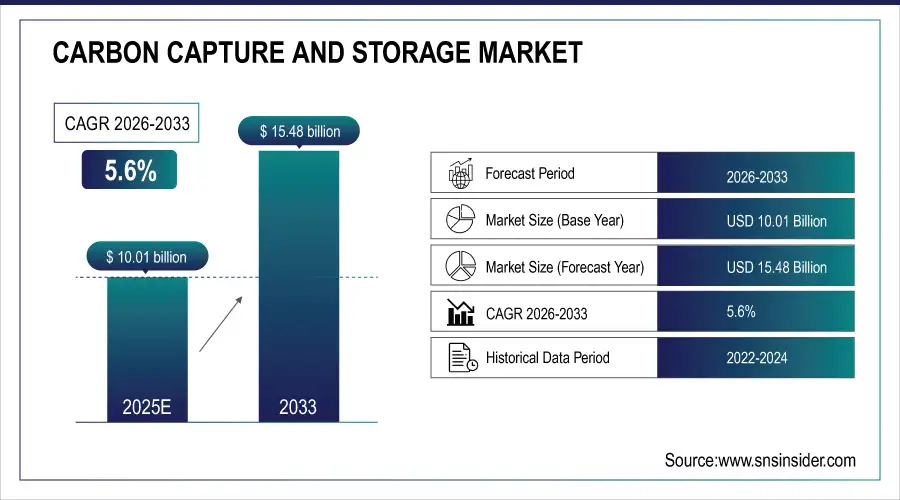
The Carbon Capture and Storage Market size was valued at USD 10.01 billion in 2025 and is expected to grow to USD 15.48 billion by 2033 with a growing CAGR of 5.6% over the forecast period of 2026-2033.
Reducing carbon emissions through carbon capture and storage (CCS) might be crucial in the fight against global warming. It involves collecting the carbon dioxide produced by power plants or other industrial processes, such the production of steel or cement, transferring it, and then storing it underground. Here, we examine CCS's operational principles and prospective advantages.
The Intergovernmental Panel on Climate Change (IPCC) emphasised that, in addition to increasing efforts to reduce emissions, we also need to use technologies to remove carbon from the atmosphere if we hope to meet the goals of the Paris Agreement and keep future temperature increases to 1.5°C (2.7°F).
Saline aquifers or depleted oil and gas reserves, which normally need to be at least 0.62 miles (1 km) below the surface, are potential storage locations for carbon emissions. The 'Endurance' saline aquifer in the southern North Sea, about 90 km offshore, is a storage location for the UK's projected Zero Carbon Humber project. Endurance has the capacity to store enormous volumes of CO2 and is located around one mile (1.6 km) below the seabed. Similar to this, there are other large-scale carbon sites in the US, including the Alabama-based Citronelle Project. The approximate size of this saline reservoir injection location Deepness is 4.9 miles (2.9 km).
Carbon Capture and Storage Market Size and Forecast:
-
Market Size in 2025E: USD 10.01 Billion
-
Market Size by 2033: USD 15.48 Billion
-
CAGR: 5.6% from 2026 to 2033
-
Base Year: 2025E
-
Forecast Period: 2026–2033
-
Historical Data: 2022–2024
To Get More Information on Carbon Capture and Storage Market - Request Sample Report
Carbon Capture and Storage Market Highlights:
-
Rising demand for natural gas is driven by environmental consciousness and the global shift toward cleaner, low-carbon energy sources, making it a preferred transition fuel
-
Natural gas offers a lower carbon footprint, higher energy efficiency, and compatibility with renewable energy systems, supporting emission reduction goals
-
Safety challenges in storage arise as improper handling of fuels, chemicals, or gases can lead to fires, explosions, and environmental contamination, requiring strict protocols
-
There is a need for advanced storage solutions focusing on temperature control, pressure regulation, material compatibility, and secure containment to ensure operational safety
-
Opportunities in innovative capture technologies exist through investment in direct air capture, chemical absorption, and membrane-based methods, driving efficiency, scalability, and commercialization
-
Technological innovation supports sustainability and collaboration, fostering global low-carbon goals and strengthening industry-academia partnerships
Carbon Capture and Storage Market Drivers:
-
Increasing demand for natural gas due to growing environmental consciousness
The increasing demand for natural gas is driven primarily by growing environmental consciousness and the global push for cleaner, low-carbon energy sources. As countries work to reduce greenhouse gas emissions, natural gas is emerging as a preferred alternative to coal and petroleum, owing to its lower carbon footprint, higher energy efficiency, and compatibility with modern clean technologies. Its role as a transition fuel supports renewable energy growth by providing stable backup to intermittent sources like wind and solar. Industries, transportation systems, and power generation units are increasingly adopting natural gas to comply with environmental regulations, improve fuel efficiency, and meet sustainability targets.
Carbon Capture and Storage Market Restraints:
-
Safety issues about storage methods
Storage of fuels, chemicals, or industrial gases presents significant safety challenges that require careful management to prevent accidents, leaks, or contamination. Improper storage methods can lead to fire hazards, explosions, chemical reactions, or environmental pollution. Factors such as temperature control, pressure regulation, material compatibility, and secure containment are critical to ensuring safe storage. Additionally, inadequate monitoring, maintenance, or handling practices can exacerbate risks, potentially endangering workers and surrounding communities. Implementing stringent safety protocols, regular inspections, emergency response plans, and advanced storage technologies is essential to minimize hazards and maintain operational safety in industrial, commercial, and residential storage applications.
Carbon Capture and Storage Market Opportunities:
-
Investment in developing new innovative capturing technologies
Investment in developing new and innovative capturing technologies is rapidly gaining momentum as industries and governments strive to mitigate climate change and reduce carbon emissions. Advanced capture methods, such as direct air capture, chemical absorption, and membrane-based technologies, are being researched and implemented to improve efficiency, lower costs, and enhance scalability. Funding from private enterprises, venture capital, and public initiatives is accelerating innovation, enabling pilot projects and commercialization of cutting-edge solutions. This investment not only drives technological breakthroughs but also supports global sustainability goals, fosters collaboration between research institutions and industry, and strengthens the transition toward a low-carbon economy.
Carbon Capture and Storage Market Segment Analysis:
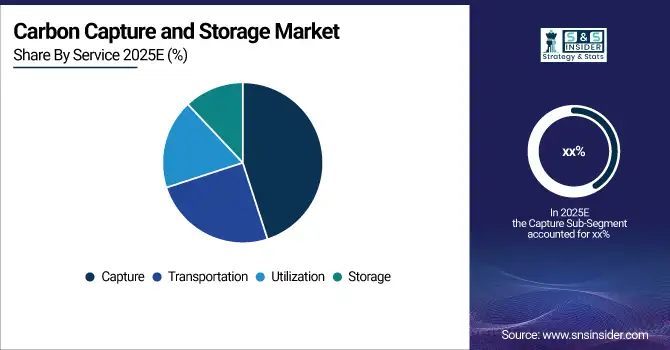
By Service
In the Carbon Capture and Storage (CCS) market, the Capture segment currently dominates, accounting for the largest share of revenue due to its critical role in reducing CO₂ emissions from industrial and power generation sources. Meanwhile, Utilization is the fastest-growing service segment, driven by increasing efforts to convert captured carbon into value-added products such as fuels, chemicals, and building materials. Transportation and storage services, while essential, occupy smaller shares compared to capture and utilization, reflecting the ongoing focus on emission reduction and resource optimization.
By Technology
Among CCS technologies, Solvents & Sorbents remain the dominant method, particularly for post-combustion capture, as they can be effectively retrofitted to existing industrial and power plants. These technologies offer high efficiency and are widely adopted globally. Other technologies, including membranes and chemical looping, are gaining attention for their innovative potential and energy efficiency; however, their market share is still smaller. The CCS market continues to invest in alternative and emerging technologies to improve capture efficiency, reduce costs, and enable scalable deployment in diverse industrial applications.
By End-User
The Oil & Gas sector is the largest end-user of CCS solutions, driven primarily by infrastructure availability and the use of captured CO₂ for enhanced oil recovery. Power Generation is also a major end-user, with retrofitting of coal- and gas-fired plants contributing significantly to CCS adoption. Among the fastest-growing segments, Chemicals & Petrochemicals are expanding rapidly as industries increasingly utilize captured carbon as feedstock for fuels, chemicals, and other value-added products. Other sectors such as cement, iron & steel, and various industrial applications are steadily adopting CCS technologies to meet sustainability targets and regulatory requirements.
Carbon Capture and Storage Market Regional Analysis:
North America Carbon Capture and Storage Market Trends:
North America remains the global leader in CCS, holding the largest share of the market. Strong infrastructure, numerous large-scale CCS and CO₂ storage projects, and supportive regulatory and fiscal policies have driven market growth. The region benefits from mature oil & gas, power generation, chemical, and industrial sectors, which are increasingly adopting CCS solutions. North America continues to attract significant investments in capture, transport, and storage infrastructure, as well as new project pipelines, ensuring steady market expansion and technological advancements.
Do You Need any Customization Research on Carbon Capture and Storage Market - Enquire Now
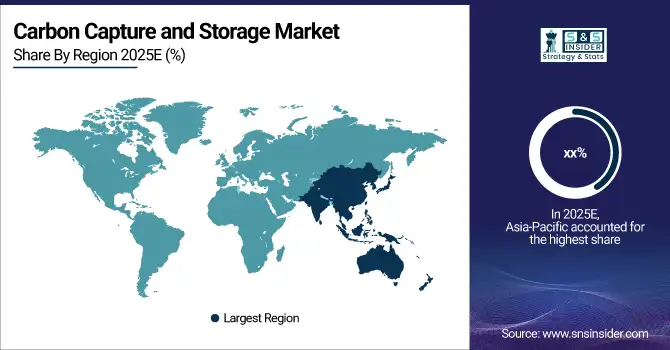
Asia-Pacific Carbon Capture and Storage Market Trends:
Asia-Pacific is rapidly emerging as a major growth hub for CCS. Countries like China, Japan, South Korea, and Australia are leading adoption due to increasing industrialization, emissions from power, cement, steel, and other heavy industries, and national carbon reduction commitments. Governments are integrating CCS into decarbonization plans, supporting policy frameworks, pilot projects, and R&D investments. With these initiatives, Asia-Pacific is expected to be the fastest-growing regional CCS market in the coming decade.
Europe Carbon Capture and Storage Market Trends:
Europe holds a significant CCS market share, driven by strong climate policies, emission reduction targets, and regulatory frameworks. Many countries are investing in CCS infrastructure, including offshore CO₂ transport and storage, and the development of industrial clusters integrating CO₂ capture. Adoption is particularly strong in hard-to-decarbonize industries such as cement, chemicals, and heavy manufacturing. Europe continues to be a key region for CCS deployment and cross-border collaboration in storage and transport networks.
Latin America Carbon Capture and Storage Market Trends:
Latin America currently represents a smaller portion of the global CCS market. Activity is mostly at early or pilot-project stages in countries such as Brazil and Argentina. Key drivers include growing industrialization, interest in low-carbon fuel production, and emerging recognition of CCS as a tool for industrial decarbonization. Challenges such as limited infrastructure, lower investment levels, and nascent regulatory frameworks restrict rapid market expansion, though opportunities exist for future growth as awareness and support increase.
Middle East & Africa Carbon Capture and Storage Market Trends:
The Middle East & Africa region is gaining momentum in CCS, particularly in oil- and gas-rich countries where it supports emissions reduction, enhanced oil recovery, hydrogen and blue-fuel production, and industrial decarbonization. Some African countries are exploring pilot projects in heavy industries, mining, and cement, although infrastructure and funding remain constraints. With abundant geological storage potential and growing energy-sector transformation efforts, the region is considered strategic for future CCS deployment.
Carbon Capture and Storage Market Competitive Landscape:
ExxonMobil, established in 1999, is a leading global energy and petrochemical company providing fuels, lubricants, chemicals, and low-carbon solutions. With a strong focus on innovation and large-scale infrastructure, it operates advanced CCS projects, extensive CO₂ pipeline networks, and technologies supporting global decarbonization.
-
In October 2024, ExxonMobil secured a 271,000-acre offshore CO₂ storage lease in Texas, expanding its Gulf Coast CCS capacity and strengthening its leadership in U.S. carbon capture.
Shell Established in 1907, Shell is a global energy and petrochemical company providing oil, gas, chemicals and renewable energy solutions. Shell is rapidly scaling carbon capture, hydrogen, and bioenergy technologies, targeting net-zero emissions by 2050 and investing in large-scale CCS facilities like Northern Lights in partnership with industry leaders.
Equinor Established in 1972, Equinor is a leading energy company focused on oil, gas, and low-carbon solutions. Headquartered in Norway, it is actively developing carbon capture, hydrogen, offshore wind technologies, and CO₂ transport and storage infrastructure. Equinor co-develops the Northern Lights CCS project, supporting Europe’s decarbonization efforts.
TotalEnergies Established in 1924, TotalEnergies is a major global energy producer supplying oil, gas, electricity, and renewable energy solutions. The company is advancing large-scale CCS, hydrogen, biofuels, and solar power projects worldwide. TotalEnergies is a key partner in Northern Lights, strengthening its clean-energy transition and carbon-management portfolio.
-
In September 2024, Shell, Equinor and TotalEnergies opened the Northern Lights CO₂ storage facility—ready to receive first deliveries in 2025; Phase 1 capacity ~1.5 MtCO₂/year with planned expansion.
Carbon Capture and Storage Market Key Players:
-
Fluor Corporation
-
ExxonMobil Corporation
-
Linde PLC
-
Shell plc
-
Mitsubishi Heavy Industries Ltd.
-
JGC Holdings Corporation
-
Schlumberger Ltd.
-
Aker Solutions / Aker Carbon Capture
-
Honeywell International Inc.
-
Equinor ASA
-
Halliburton Company
-
Siemens Energy
-
TotalEnergies SE
-
NRG Energy, Inc.
-
Carbon Engineering Ltd.
-
LanzaTech Inc.
-
Japan CCS Co., Ltd.
-
C-Capture Ltd.
-
CO2 Capsol AS
-
Sulzer Ltd.
| Report Attributes | Details |
|---|---|
| Market Size in 2025E | USD 10.01 Billion |
| Market Size by 2033 | USD 15.48 Billion |
| CAGR | CAGR of 5.6% From 2026 to 2033 |
| Base Year | 2025E |
| Forecast Period | 2026-2033 |
| Historical Data | 2022-2024 |
| Report Scope & Coverage | Market Size, Segments Analysis, Competitive Landscape, Regional Analysis, DROC & SWOT Analysis, Forecast Outlook |
| Key Segments | • By Service (Capture, Transportation, Utilization, Storage) • By Technology (Chemical Looping, Solvents & Sorbents, Membranes, Others) • By End-User (Oil & Gas, Power Generation, Chemicals & Petrochemicals, Cement, Iron & Steel, Others) |
| Regional Analysis/Coverage | North America (US, Canada), Europe (Germany, UK, France, Italy, Spain, Russia, Poland, Rest of Europe), Asia Pacific (China, India, Japan, South Korea, Australia, ASEAN Countries, Rest of Asia Pacific), Middle East & Africa (UAE, Saudi Arabia, Qatar, South Africa, Rest of Middle East & Africa), Latin America (Brazil, Argentina, Mexico, Colombia, Rest of Latin America). |
| Company Profiles | Fluor Corporation, ExxonMobil Corporation, Linde PLC, Shell plc, Mitsubishi Heavy Industries Ltd., JGC Holdings Corporation, Schlumberger Ltd., Aker Solutions / Aker Carbon Capture, Honeywell International Inc., Equinor ASA, Halliburton Company, Siemens Energy, TotalEnergies SE, NRG Energy Inc., Carbon Engineering Ltd., LanzaTech Inc., Japan CCS Co. Ltd., C-Capture Ltd., CO2 Capsol AS, and Sulzer Ltd. |
Frequently Asked Questions
Ans: Investment in developing new innovative capturing technologies
Preventing emission of greenhouse gas
Ans: Safety issues about storage methods, Locations are limiting market expansion and High storing cost.
Ans: Carbon Capture and Storage Market size was valued at USD 10.01 billion in 2025
Ans: USD 15.48 billion is expected to grow by 2033.
Ans: Carbon Capture and Storage Market is anticipated to expand by 5.6 % from 2023 to 2030.
Get in Touch
