Distributed Energy Generation Market Report Scope & Overview:
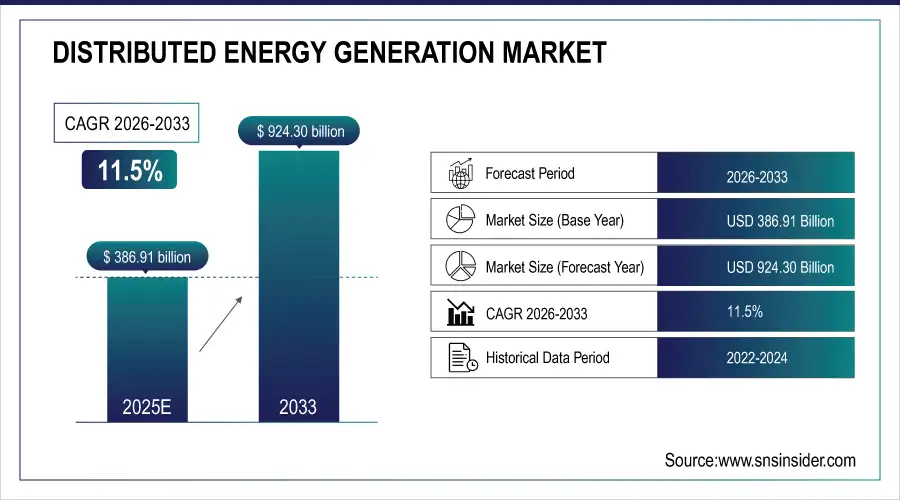
The Distributed Energy Generation Market size was valued at USD 386.91 billion in 2025E and is expected to grow to USD 924.30 billion by 2033 and grow at a CAGR of 11.5% over the forecast period of 2026-2033.
Electrical generation and storage are carried out by a range of tiny, grid-connected, or distribution system-connected devices known as distributed energy resources (DER), also known as distributed generation, distributed energy, on-site generation (OSG), or district/decentralized energy.
Traditional power facilities are centralized and frequently necessitate the transmission of electric energy across great distances, including coal-fired, gas-fired, and nuclear power plants, hydroelectric dams, and large-scale solar power plants.
Different municipal, state, and federal rules apply to distributed generating systems markets, and restrictions as opposed to centralized generation. The financial attractiveness of a distributed generating plant is impacted by the vast differences in rules and incentives from one region to another.
Two examples of distributed generation technologies that generate energy at or near the area where it will be used are solar panels and combined heat and power systems. A single building, such as a home or business, may be powered by distributed generation. It may also be a part of a microgrid, which is a network of two smaller grids connected to a larger energy delivery system.
Market Size and Forecast: 2025E
-
Market Size in 2025E USD 386.91Billion
-
Market Size by 2033 USD 924.30 Billion
-
CAGR of 11.5% From 2026 to 2033
-
Base Year 2025E
-
Forecast Period 2026-2033
-
Historical Data 2022-2024
To Get More Information on Distributed Energy Generation Market - Request Sample Report
Distributed Energy Generation Market Trends:
-
Increasing deployment of distributed renewable energy systems across residential, commercial, and industrial sectors.
-
Growing adoption of hybrid distributed energy systems integrating solar, wind, storage, and microgrids.
-
Rapid decline in solar PV and battery storage costs, accelerating distributed energy investments.
-
Rising integration of smart grid technologies and digital energy management platforms.
-
Expansion of decentralized power generation to enhance grid resilience and reduce dependency on centralized utilities.
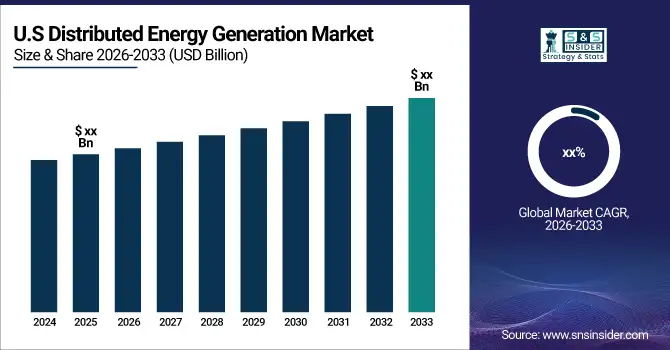
The U.S. Distributed Energy Generation market size was valued at an estimated USD 142.50 billion in 2025 and is projected to reach USD 340.50 billion by 2033, growing at a CAGR of 11.1% over the forecast period 2026–2033. Market growth is driven by increasing adoption of renewable energy sources such as solar, wind, and combined heat and power (CHP) systems, rising demand for decentralized and reliable power solutions, and government incentives promoting clean energy deployment. The need for energy efficiency, reduction of transmission losses, and integration of smart grid technologies further accelerates market expansion. Additionally, advancements in energy storage systems, microgrid development, and supportive regulatory frameworks contribute to the strong growth outlook of the U.S. distributed energy generation market during the forecast period.
Distributed Energy Generation Market Growth Drivers:
-
Rising environmental concerns
-
Growing solar panel installation
-
Increasing government policies and greenhouse gas
The market for distributed energy generation (DEG) is expanding due to more stringent government regulations and goals for reducing greenhouse gas (GHG) emissions. Additionally, the advantages of renewable technology, such as energy security, robustness, and carbon reductions, are in part to blame for global market expansion.
Distributed Energy Generation Market Restraints:
Economic uncertainty and rising capital costs act as major restraints for the Distributed Energy Generation (DEG) Market. High upfront investment requirements, fluctuating interest rates, and inflation-driven equipment expenses limit adoption, especially for small and medium enterprises. These financial pressures slow project deployment and reduce the viability of new distributed energy installations.
Distributed Energy Generation Market Opportunities:
Advancements in solar technologies and the accelerating demand for clean energy are creating strong opportunities in the Distributed Energy Generation Market. Higher solar efficiency, falling module prices, and improved storage integration make decentralized systems more viable. Growing consumer and industrial preference for sustainable, low-carbon energy further boosts market adoption and long-term investment potential.
Distributed Energy Generation Market Segment Analysis:
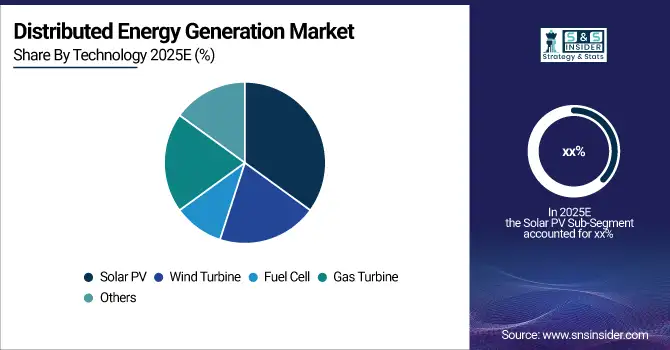
By Technology
Distributed Energy Generation technologies include Solar PV, Wind Turbines, Fuel Cells, Gas Turbines, and other emerging systems. Solar PV leads due to declining costs and easy deployment, while wind and fuel cells support reliable decentralized power. Gas turbines offer flexible backup generation. Together, these technologies enable efficient, resilient, and diversified on-site energy production.
By Application
Distributed Energy Generation serves Industrial, Residential, and Commercial applications, each driving adoption for different needs. Industrial users rely on DEG for energy security and cost control, while residential installations grow with rooftop solar demand. Commercial sectors adopt DEG to reduce operating expenses, improve sustainability performance, and ensure uninterrupted power for critical operations.
Distributed Energy Generation Market Regional Analysis:
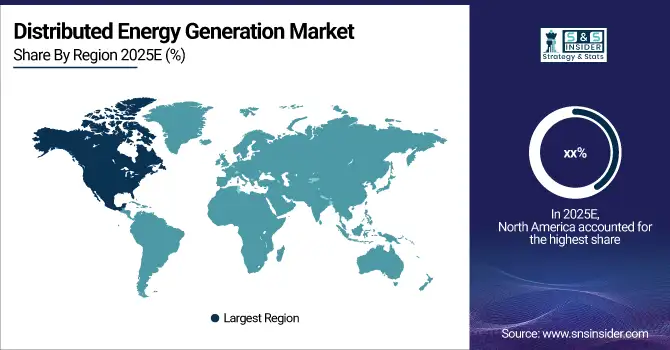
North America Distributed Energy Generation Market Insights
North America is anticipated to contribute considerably. Governmental subsidies, solar installation rules, and growing environmental concerns are anticipated to have a substantial impact on the industry. The market for distributed power generation in North America has grown as a consequence of technical developments that have reduced the cost of producing solar panels and improved efficiency.
Do You Need any Customization Research on Distributed Energy Generation Market - Enquire Now
Europe Distributed Energy Generation Market Insights
The majority of European product demand is accounted for by Germany and Italy. As more governments set goals for renewable energy and put more supportive policies in place, the regional market for solar PV and wind turbines is expected to expand dramatically. By 2033, GHG emissions must be cut by 40%, according to the European Commission.
Asia Pacific Distributed Energy Generation Market Insights
Asia Pacific leads the Distributed Energy Generation market due to rapid urbanization, strong government renewable policies, and expanding industrial activity. High solar adoption in China, India, and Southeast Asia, combined with declining equipment costs, accelerates distributed systems deployment. Microgrids and hybrid renewable solutions further strengthen regional market growth and energy resilience.
Latin America (LATAM) and Middle East & Africa (MEA) Distributed Energy Generation Market Insights
LATAM and MEA experience rising Distributed Energy Generation adoption driven by the need for energy security, grid reliability, and reduced dependence on centralized infrastructure. Growing solar and wind potential, supportive policies, and rural electrification initiatives fuel market expansion. Cost reductions in renewable technologies further accelerate decentralized power solutions across both regions.
Competitive Landscape for Distributed Energy Generation Market:
Rolls-Royce is a global engineering company specializing in power and propulsion systems for aviation, energy, and defense sectors. The company is increasingly active in distributed energy generation through advanced gas turbines, microgrids, and sustainable power solutions. Its innovations support efficiency, reliability, and low-carbon energy transitions across industrial and commercial applications worldwide.
-
Rolls-Royce stated that it will serve as the company's and the industry's employer brand in July 2021. It also stated that the MTU brand would be strengthened as the only available product and solution brand. On a product-by-product basis, the 'MTU Onsite Energy' trademark for distributed power supply systems will be phased out and incorporated into the MTU brand.
Schneider Electric is a global leader in energy management and automation, delivering solutions that enhance efficiency, resilience, and sustainability across industries. The company supports distributed energy generation through smart grid technologies, microgrid systems, and digital platforms that optimize renewable integration. Its innovations help customers reduce carbon emissions, improve reliability, and manage decentralized energy resources effectively.
-
Schneider Electric will introduce the Energy Centre for Distributed-Energy-Enabled Homes in January 2021. The use of solar energy, batteries, electric car chargers, and whole-home energy management is spreading.
Distributed Energy Generation Market Key Players:
The Major Players are Siemens, Ansaldo Energia SpA, General Electric, Ballard Power Systems, Schneider Electric, Caterpillar, Vestas, NextEra Energy, Inc., Orsted A/S, Suzlon Energy Limited, and other players
| Report Attributes | Details |
| Market Size in 2025E | USD 386.91 Billion |
| Market Size by 2033 | USD 924.30 Billion |
| CAGR | CAGR of 11.5% From 2026 to 2033 |
| Base Year | 2025E |
| Forecast Period | 2026-2033 |
| Historical Data | 2022-2024 |
| Report Scope & Coverage | Market Size, Segments Analysis, Competitive Landscape, Regional Analysis, DROC & SWOT Analysis, Forecast Outlook |
| Key Segments | • By Technology (Solar PV, Wind Turbine, Fuel Cell, Gas Turbine, Others) • By Application (Industrial, Residential, Commercial) |
| Regional Analysis/Coverage | North America (US, Canada), Europe (Germany, UK, France, Italy, Spain, Russia, Poland, Rest of Europe), Asia Pacific (China, India, Japan, South Korea, Australia, ASEAN Countries, Rest of Asia Pacific), Middle East & Africa (UAE, Saudi Arabia, Qatar, South Africa, Rest of Middle East & Africa), Latin America (Brazil, Argentina, Mexico, Colombia, Rest of Latin America). |
| Company Profiles | Siemens, Ansaldo Energia SpA, General Electric, Ballard Power Systems, Schneider Electric, Caterpillar, Vestas, NextEra Energy, Inc., Orsted A/S, Suzlon Energy Limited |
Frequently Asked Questions
Ans: Rising environmental concerns, growing solar panel installation, and Increasing government policies and greenhouse gas
Ans: North America is dominating the market.
Ans: Distributed Energy Generation Market size was valued at USD 386.91 billion in 2022
Ans: USD 924.30 billion is expected to grow by 2033.
Ans: Distributed Energy Generation Market is anticipated to expand by 11.5 % from 2026 to 2033.
Get in Touch
